
Recommended
Recommended
More Related Content
What's hot
What's hot (20)
Similar to Corbett Road Market Week and Key Dates
Similar to Corbett Road Market Week and Key Dates (20)
Recently uploaded
Recently uploaded (20)
Corbett Road Market Week and Key Dates
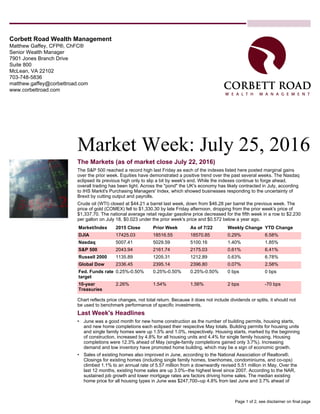
- 1. Corbett Road Wealth Management Matthew Gaffey, CFP®, ChFC® Senior Wealth Manager 7901 Jones Branch Drive Suite 800 McLean, VA 22102 703-748-5836 matthew.gaffey@corbettroad.com www.corbettroad.com Market Week: July 25, 2016 The Markets (as of market close July 22, 2016) The S&P 500 reached a record high last Friday as each of the indexes listed here posted marginal gains over the prior week. Equities have demonstrated a positive trend over the past several weeks. The Nasdaq eclipsed its previous high only to slip a bit by week's end. While the indexes continue to forge ahead, overall trading has been light. Across the "pond" the UK's economy has likely contracted in July, according to IHS Markit's Purchasing Managers' Index, which showed businesses responding to the uncertainty of Brexit by cutting output and payrolls. Crude oil (WTI) closed at $44.21 a barrel last week, down from $46.28 per barrel the previous week. The price of gold (COMEX) fell to $1,330.30 by late Friday afternoon, dropping from the prior week's price of $1,337.70. The national average retail regular gasoline price decreased for the fifth week in a row to $2.230 per gallon on July 18, $0.023 under the prior week's price and $0.572 below a year ago. Market/Index 2015 Close Prior Week As of 7/22 Weekly Change YTD Change DJIA 17425.03 18516.55 18570.85 0.29% 6.58% Nasdaq 5007.41 5029.59 5100.16 1.40% 1.85% S&P 500 2043.94 2161.74 2175.03 0.61% 6.41% Russell 2000 1135.89 1205.31 1212.89 0.63% 6.78% Global Dow 2336.45 2395.14 2396.80 0.07% 2.58% Fed. Funds rate target 0.25%-0.50% 0.25%-0.50% 0.25%-0.50% 0 bps 0 bps 10-year Treasuries 2.26% 1.54% 1.56% 2 bps -70 bps Chart reflects price changes, not total return. Because it does not include dividends or splits, it should not be used to benchmark performance of specific investments. Last Week's Headlines • June was a good month for new home construction as the number of building permits, housing starts, and new home completions each eclipsed their respective May totals. Building permits for housing units and single family homes were up 1.5% and 1.0%, respectively. Housing starts, marked by the beginning of construction, increased by 4.8% for all housing units and 4.4% for single family housing. Housing completions were 12.3% ahead of May (single-family completions gained only 3.7%). Increasing demand and low inventory have promoted home building, which may be a sign of economic growth. • Sales of existing homes also improved in June, according to the National Association of Realtors®. Closings for existing homes (including single family homes, townhomes, condominiums, and co-ops) climbed 1.1% to an annual rate of 5.57 million from a downwardly revised 5.51 million in May. Over the last 12 months, existing home sales are up 3.0%--the highest level since 2007. According to the NAR, sustained job growth and lower mortgage rates are factors driving home sales. The median existing home price for all housing types in June was $247,700--up 4.8% from last June and 3.7% ahead of Page 1 of 2, see disclaimer on final page
- 2. Prepared by Broadridge Investor Communication Solutions, Inc. Copyright 2016 May's median price. Available inventory remains an issue for homebuyers as it dipped 0.9% to 2.12 million, which is 5.8% lower than a year ago. • Builders remained cautiously optimistic about the newly built, single-family home market in July, according to the latest survey from the National Association of Home Builders. The Housing Market Index, based on respondents' feedback, fell 1 point to 59 from June's index of 60. An index reading above 50 indicates generally favorable expectations. • According to the Markit Flash U.S. Manufacturing PMI™, the Purchasing Managers' Index™ was 52.9 in July, up from 51.3 in June. This reading signals solid improvement in overall business conditions, with the latest reading the strongest since October 2015. Manufacturing output, new orders, and employment continue to rise. • In the week ended July 16, the advance figure for seasonally adjusted initial unemployment insurance claims was 253,000, a decrease of 1,000 from the prior week's level. The advance seasonally adjusted insured unemployment rate dropped to 1.5%. The advance number for seasonally adjusted insured unemployment during the week ended July 9 was 2,128,000, a decrease of 25,000 from the previous week's revised level. Eye on the Week Ahead This week is an important one for economic news. The FOMC meets and may consider raising interest rates based on the surging stock market, slowly advancing inflation, and the rebounding employment situation. Also, the latest figures on the second-quarter gross domestic product are released at the end of the week. Data sources: News items are based on reports from multiple commonly available international news sources (i.e. wire services) and are independently verified when necessary with secondary sources such as government agencies, corporate press releases, or trade organizations. Market data: Based on data reported in WSJ Market Data Center (indexes); U.S. Treasury (Treasury yields); U.S. Energy Information Administration/Bloomberg.com Market Data (oil spot price, WTI Cushing, OK); www.goldprice.org (spot gold/silver); Oanda/FX Street (currency exchange rates). All information is based on sources deemed reliable, but no warranty or guarantee is made as to its accuracy or completeness. Neither the information nor any opinion expressed herein constitutes a solicitation for the purchase or sale of any securities, and should not be relied on as financial advice. Past performance is no guarantee of future results. All investing involves risk, including the potential loss of principal, and there can be no guarantee that any investing strategy will be successful. The Dow Jones Industrial Average (DJIA) is a price-weighted index composed of 30 widely traded blue-chip U.S. common stocks. The S&P 500 is a market-cap weighted index composed of the common stocks of 500 leading companies in leading industries of the U.S. economy. The NASDAQ Composite Index is a market-value weighted index of all common stocks listed on the NASDAQ stock exchange. The Russell 2000 is a market-cap weighted index composed of 2,000 U.S. small-cap common stocks. The Global Dow is an equally weighted index of 150 widely traded blue-chip common stocks worldwide. Market indices listed are unmanaged and are not available for direct investment. Key Dates/Data Releases 7/26: New home sales, consumer confidence 7/27: Durable goods orders, FOMC meeting announcement 7/28: International trade in goods 7/29: GDP, employment cost index, consumer sentiment IMPORTANT DISCLOSURES Spire Wealth Management, LLC is a Federally Registered Investment Advisory Firm. Securities offered through an affiliated company, Spire Securities, LLC., a Registered Broker/Dealer and member FINRA/SIPC. Neither Spire Wealth Management, Corbett Road Wealth Management nor Matthew Gaffey provide tax or legal advice. The information presented here is not specific to any individual's personal circumstances. Please speak with your tax of legal professional. These materials are provided for general information and educational purposes based upon publicly available information from sources believed to be reliable—we cannot assure the accuracy or completeness of these materials. The information in these materials may change at any time and without notice. Page 2 of 2