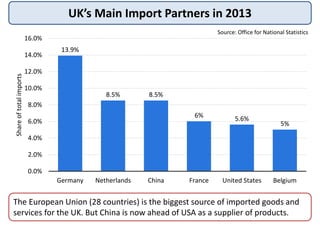
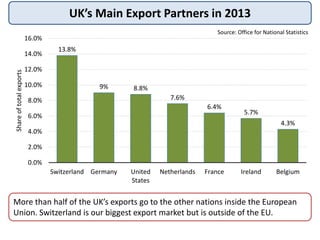
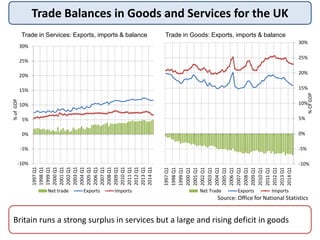
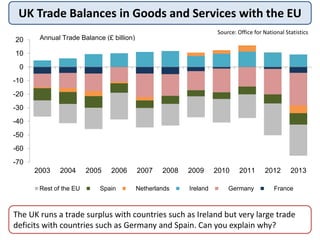
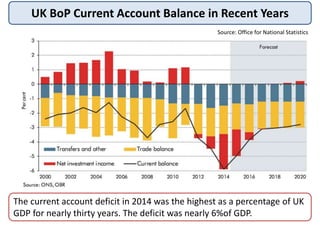
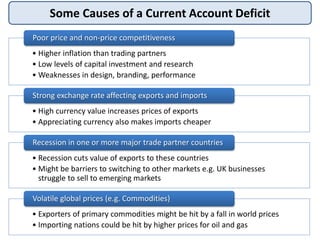
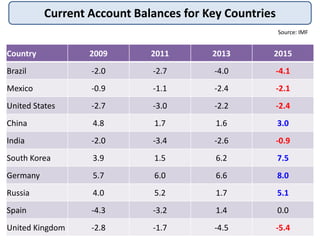
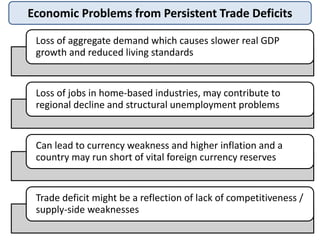
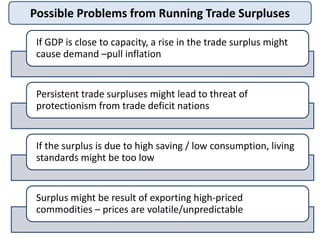
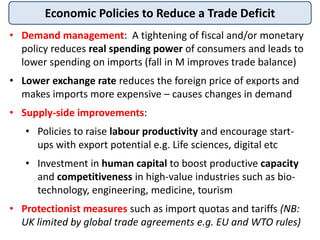
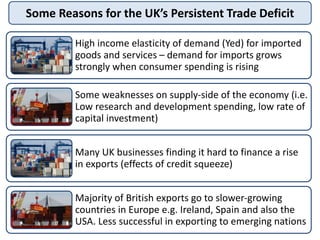
Balance of Payments and Trade
EdExcel AS Economics 2.1.4
The Changing Global Economy
The world economy is changing rapidly! Since 1980 the share of global economic
output has shifted towards Asian-Pacific countries who now dominate.
19.6%
22.7%
26.2%
28.5%
31.4%
0%
5%
10%
15%
20%
25%
30%
35%
40%
1980 1990 2000 2010 2015
US EU-28 Asia-Pacific
Percentage share of world GDP, at current market prices & exchange rates
Source: IMF World Outlook
UK’s Main Import Partners in 2013
13.9%
8.5% 8.5%
6% 5.6%
5%
0.0%
2.0%
4.0%
6.0%
8.0%
10.0%
12.0%
14.0%
16.0%
Germany Netherlands China France United States Belgium
Shareoftotalimports
The European Union (28 countries) is the biggest source of imported goods and
services for the UK. But China is now ahead of USA as a supplier of products.
Source: Office for National Statistics
UK’s Main Export Partners in 2013
Text goes here
13.8%
9% 8.8%
7.6%
6.4%
5.7%
4.3%
0.0%
2.0%
4.0%
6.0%
8.0%
10.0%
12.0%
14.0%
16.0%
Switzerland Germany United
States
Netherlands France Ireland Belgium
Shareoftotalexports
More than half of the UK’s exports go to the other nations inside the European
Union. Switzerland is our biggest export market but is outside of the EU.
Source: Office for National Statistics
Trade to GDP ratios are
rising for most countries
Big expansion of
Financial Capital Flows
between countries
Rise in Foreign Direct
Investment and Cross
Border M&A
Rise of global brands –
including many from
emerging countries
Deeper specialization of
labour – i.e. components
from many nations
Global supply chains &
new trade and
investment routes
Key Aspects of Globalisation
The Balance of Payments
For AS economics emphasis is on the current account of the BoP
and in particular the balance in trade in goods and services
• The balance of payments (BOP) records all financial
transactions made between consumers, businesses and
the government in one country with other nations
• Inflows of foreign currency are counted as a positive
entry (e.g. exports sold overseas)
• Outflows of foreign currency are counted as a negative
entry (e.g. imported goods and services)
• The current account of the balance of payments is the
main measure of external trade performance
Items in the Current Account of the BoP
• Finished manufactured goods, components,
raw materials
• Energy products, Capital technology
Trade Balance in
Goods
• Banking, Insurance, Consultancy
• Tourism, Transport, Logistics
• Shipping, Education, Health,
• Research, Cultural Arts
Trade Balance in
Services
• Overseas aid / debt relief
• Private money transfers e.g. From migrants
Net Money
Transfers
• Profits, interest and dividends from
investments in other countries e.g. The
profits from transnational businesses
Net Investment
Income from
Overseas Assets
Worked Example of the BoP Current Account
Item of the Balance of Payments Net Balance
$ billion
Current Account
(1) Balance of trade in goods -25
(2) Balance of trade in services +10
(3) Net investment income -12
(4) Net overseas transfers +8
Sum of 1+2+3+4 = Current account balance -19
The current account comprises the balance of trade in goods
and services net investment incomes and net transfers.
If a country is running a current account deficit, there is a net
outflow of demand and income from the circular flow.
UK BoP Current Account Balance in Recent Years
* forecast
Current balance =
sum of 1 + 2 + 3
(1) Transfers and
other
(2) Net trade
balance in goods
and services
(3) Net investment
income
% of GDP % of GDP % of GDP % of GDP
2007 -2.7 -1.0 -2.7 1.0
2008 -3.7 -0.9 -3.0 0.2
2009 -2.8 -1.0 -1.9 0.1
2010 -2.6 -1.3 -2.4 1.1
2011 -1.7 -1.4 -1.5 1.2
2012 -3.7 -1.4 -2.1 -0.3
2013 -4.5 -1.6 -2.0 -0.9
2014 -5.9 -1.5 -2.0 -2.4
2015* -5.0 -1.3 -1.8 -1.8
The current account measures the UK’s trade in goods and services with
the rest of the world, as well as current transfers and income flows in to
and out of the UK from cross-border investments.
Trade Balances in Goods and Services for the UK
Britain runs a strong surplus in services but a large and rising deficit in goods
-10%
-5%
0%
5%
10%
15%
20%
25%
30%
1997Q1
1998Q1
1999Q1
2000Q1
2001Q1
2002Q1
2003Q1
2004Q1
2005Q1
2006Q1
2007Q1
2008Q1
2009Q1
2010Q1
2011Q1
2012Q1
2013Q1
2014Q1
%ofGDP
Net trade Exports Imports
-10%
-5%
0%
5%
10%
15%
20%
25%
30%
1997Q1
1998Q1
1999Q1
2000Q1
2001Q1
2002Q1
2003Q1
2004Q1
2005Q1
2006Q1
2007Q1
2008Q1
2009Q1
2010Q1
2011Q1
2012Q1
2013Q1
2014Q1
%OfGDP
Net Trade Exports Imports
Trade in Services: Exports, imports & balance Trade in Goods: Exports, imports & balance
Source: Office for National Statistics
UK Trade Balances in Goods and Services with the EU
The UK runs a trade surplus with countries such as Ireland but very large trade
deficits with countries such as Germany and Spain. Can you explain why?
-70
-60
-50
-40
-30
-20
-10
0
10
20
2003 2004 2005 2006 2007 2008 2009 2010 2011 2012 2013
Rest of the EU Spain Netherlands Ireland Germany France
Annual Trade Balance (£ billion)
Source: Office for National Statistics
UK BoP Current Account Balance in Recent Years
The current account deficit in 2014 was the highest as a percentage of UK
GDP for nearly thirty years. The deficit was nearly 6%of GDP.
Source: Office for National Statistics
Some Causes of a Current Account Deficit
• Higher inflation than trading partners
• Low levels of capital investment and research
• Weaknesses in design, branding, performance
Poor price and non-price competitiveness
• High currency value increases prices of exports
• Appreciating currency also makes imports cheaper
Strong exchange rate affecting exports and imports
• Recession cuts value of exports to these countries
• Might be barriers to switching to other markets e.g. UK businesses
struggle to sell to emerging markets
Recession in one or more major trade partner countries
• Exporters of primary commodities might be hit by a fall in world prices
• Importing nations could be hit by higher prices for oil and gas
Volatile global prices (e.g. Commodities)
The Export Multiplier Effect
A fall in exports will reduce AD and the final impact on GDP, jobs
and investment is amplified by multiplier and accelerator effects
Real GDP
GPL1
Y1
AD1
AS
Y2
AD2
GPL2
GPL
The Export Multiplier Effect
Many industries rely heavily on key
export industries remaining
competitive – these include:
• Transportation / freight /
logistics businesses
• Trade finance businesses e.g.
Insurance and trade credit
• Service businesses that operate
in ports and airports
Exports particularly important for
regional economic performance
Country 2009 2011 2013 2015
Brazil -2.0 -2.7 -4.0 -4.1
Mexico -0.9 -1.1 -2.4 -2.1
United States -2.7 -3.0 -2.2 -2.4
China 4.8 1.7 1.6 3.0
India -2.0 -3.4 -2.6 -0.9
South Korea 3.9 1.5 6.2 7.5
Germany 5.7 6.0 6.6 8.0
Russia 4.0 5.2 1.7 5.1
Spain -4.3 -3.2 1.4 0.0
United Kingdom -2.8 -1.7 -4.5 -5.4
Current Account Balances for Key Countries
Source: IMF
Economic Problems from Persistent Trade Deficits
Loss of aggregate demand which causes slower real GDP
growth and reduced living standards
Loss of jobs in home-based industries, may contribute to
regional decline and structural unemployment problems
Can lead to currency weakness and higher inflation and a
country may run short of vital foreign currency reserves
Trade deficit might be a reflection of lack of competitiveness /
supply-side weaknesses
Possible Problems from Running Trade Surpluses
If GDP is close to capacity, a rise in the trade surplus might
cause demand –pull inflation
Persistent trade surpluses might lead to threat of
protectionism from trade deficit nations
If the surplus is due to high saving / low consumption, living
standards might be too low
Surplus might be result of exporting high-priced
commodities – prices are volatile/unpredictable
Economic Policies to Reduce a Trade Deficit
• Demand management: A tightening of fiscal and/or monetary
policy reduces real spending power of consumers and leads to
lower spending on imports (fall in M improves trade balance)
• Lower exchange rate reduces the foreign price of exports and
makes imports more expensive – causes changes in demand
• Supply-side improvements:
• Policies to raise labour productivity and encourage start-
ups with export potential e.g. Life sciences, digital etc
• Investment in human capital to boost productive capacity
and competitiveness in high-value industries such as bio-
technology, engineering, medicine, tourism
• Protectionist measures such as import quotas and tariffs (NB:
UK limited by global trade agreements e.g. EU and WTO rules)
Some Reasons for the UK’s Persistent Trade Deficit
High income elasticity of demand (Yed) for imported
goods and services – demand for imports grows
strongly when consumer spending is rising
Some weaknesses on supply-side of the economy (i.e.
Low research and development spending, low rate of
capital investment)
Many UK businesses finding it hard to finance a rise
in exports (effects of credit squeeze)
Majority of British exports go to slower-growing
countries in Europe e.g. Ireland, Spain and also the
USA. Less successful in exporting to emerging nations
The Global Competitiveness Index uses indicators which measure:
Indicator Brief comment on the indicator
Effectiveness of institutions Protection of property rights, rule of law, corruption
Quality of infrastructure Quality of transport, communications, energy etc.
Macroeconomic performance Inflation, fiscal balance, government debt, growth
Health and primary education Malaria incidence, prevalence of HIV, mortality rates
Higher education and training Quality of teaching and attainment e.g. in Maths
Efficiency of goods & labour
markets
Intensity of competition, tariffs, other barriers
Technological readiness Internet use, availability of latest technologies
Sophistication of business Supplier quality, business clusters,
Innovation Patent applications, research & development spend
Indicators used to judge Competitiveness
Indicator
UK ranking out of
144 countries
Overall
competitiveness
9/144
Institutions 12/144
Infrastructure 10/144
Macroeconomic
environment
107/144
Labour market
efficiency
5/144
Technological
readiness
2/144
Highlighted problems for UK business
• Access to financing
• Inadequately educated workforce
Data on UK Competitiveness for 2014
Analysis: International (External) Competitiveness
External competitiveness is the ability to sell goods and services at
competitive prices in a foreign country
• Cost competitiveness
• Differences in unit labour costs – reflected in producer prices
• Non-price competitiveness
• Product quality, design, reliability and performance, choice,
after-sales services, marketing, branding and the availability
and cost of replacement parts
• Non-wage costs:
• Costs of meeting environmental / health regulations
• Environmental taxes e.g. carbon taxes and waste taxes
• Employment protection laws and health and safety laws
• Requirements to provide pensions for employees
Balance of Payments and Trade
EdExcel AS Economics 2.1.4

Balance of payments_trade

  • 1.
    Balance of Paymentsand Trade EdExcel AS Economics 2.1.4
  • 2.
    The Changing GlobalEconomy The world economy is changing rapidly! Since 1980 the share of global economic output has shifted towards Asian-Pacific countries who now dominate. 19.6% 22.7% 26.2% 28.5% 31.4% 0% 5% 10% 15% 20% 25% 30% 35% 40% 1980 1990 2000 2010 2015 US EU-28 Asia-Pacific Percentage share of world GDP, at current market prices & exchange rates Source: IMF World Outlook
  • 3.
    UK’s Main ImportPartners in 2013 13.9% 8.5% 8.5% 6% 5.6% 5% 0.0% 2.0% 4.0% 6.0% 8.0% 10.0% 12.0% 14.0% 16.0% Germany Netherlands China France United States Belgium Shareoftotalimports The European Union (28 countries) is the biggest source of imported goods and services for the UK. But China is now ahead of USA as a supplier of products. Source: Office for National Statistics
  • 4.
    UK’s Main ExportPartners in 2013 Text goes here 13.8% 9% 8.8% 7.6% 6.4% 5.7% 4.3% 0.0% 2.0% 4.0% 6.0% 8.0% 10.0% 12.0% 14.0% 16.0% Switzerland Germany United States Netherlands France Ireland Belgium Shareoftotalexports More than half of the UK’s exports go to the other nations inside the European Union. Switzerland is our biggest export market but is outside of the EU. Source: Office for National Statistics
  • 5.
    Trade to GDPratios are rising for most countries Big expansion of Financial Capital Flows between countries Rise in Foreign Direct Investment and Cross Border M&A Rise of global brands – including many from emerging countries Deeper specialization of labour – i.e. components from many nations Global supply chains & new trade and investment routes Key Aspects of Globalisation
  • 6.
    The Balance ofPayments For AS economics emphasis is on the current account of the BoP and in particular the balance in trade in goods and services • The balance of payments (BOP) records all financial transactions made between consumers, businesses and the government in one country with other nations • Inflows of foreign currency are counted as a positive entry (e.g. exports sold overseas) • Outflows of foreign currency are counted as a negative entry (e.g. imported goods and services) • The current account of the balance of payments is the main measure of external trade performance
  • 7.
    Items in theCurrent Account of the BoP • Finished manufactured goods, components, raw materials • Energy products, Capital technology Trade Balance in Goods • Banking, Insurance, Consultancy • Tourism, Transport, Logistics • Shipping, Education, Health, • Research, Cultural Arts Trade Balance in Services • Overseas aid / debt relief • Private money transfers e.g. From migrants Net Money Transfers • Profits, interest and dividends from investments in other countries e.g. The profits from transnational businesses Net Investment Income from Overseas Assets
  • 8.
    Worked Example ofthe BoP Current Account Item of the Balance of Payments Net Balance $ billion Current Account (1) Balance of trade in goods -25 (2) Balance of trade in services +10 (3) Net investment income -12 (4) Net overseas transfers +8 Sum of 1+2+3+4 = Current account balance -19 The current account comprises the balance of trade in goods and services net investment incomes and net transfers. If a country is running a current account deficit, there is a net outflow of demand and income from the circular flow.
  • 9.
    UK BoP CurrentAccount Balance in Recent Years * forecast Current balance = sum of 1 + 2 + 3 (1) Transfers and other (2) Net trade balance in goods and services (3) Net investment income % of GDP % of GDP % of GDP % of GDP 2007 -2.7 -1.0 -2.7 1.0 2008 -3.7 -0.9 -3.0 0.2 2009 -2.8 -1.0 -1.9 0.1 2010 -2.6 -1.3 -2.4 1.1 2011 -1.7 -1.4 -1.5 1.2 2012 -3.7 -1.4 -2.1 -0.3 2013 -4.5 -1.6 -2.0 -0.9 2014 -5.9 -1.5 -2.0 -2.4 2015* -5.0 -1.3 -1.8 -1.8 The current account measures the UK’s trade in goods and services with the rest of the world, as well as current transfers and income flows in to and out of the UK from cross-border investments.
  • 10.
    Trade Balances inGoods and Services for the UK Britain runs a strong surplus in services but a large and rising deficit in goods -10% -5% 0% 5% 10% 15% 20% 25% 30% 1997Q1 1998Q1 1999Q1 2000Q1 2001Q1 2002Q1 2003Q1 2004Q1 2005Q1 2006Q1 2007Q1 2008Q1 2009Q1 2010Q1 2011Q1 2012Q1 2013Q1 2014Q1 %ofGDP Net trade Exports Imports -10% -5% 0% 5% 10% 15% 20% 25% 30% 1997Q1 1998Q1 1999Q1 2000Q1 2001Q1 2002Q1 2003Q1 2004Q1 2005Q1 2006Q1 2007Q1 2008Q1 2009Q1 2010Q1 2011Q1 2012Q1 2013Q1 2014Q1 %OfGDP Net Trade Exports Imports Trade in Services: Exports, imports & balance Trade in Goods: Exports, imports & balance Source: Office for National Statistics
  • 11.
    UK Trade Balancesin Goods and Services with the EU The UK runs a trade surplus with countries such as Ireland but very large trade deficits with countries such as Germany and Spain. Can you explain why? -70 -60 -50 -40 -30 -20 -10 0 10 20 2003 2004 2005 2006 2007 2008 2009 2010 2011 2012 2013 Rest of the EU Spain Netherlands Ireland Germany France Annual Trade Balance (£ billion) Source: Office for National Statistics
  • 12.
    UK BoP CurrentAccount Balance in Recent Years The current account deficit in 2014 was the highest as a percentage of UK GDP for nearly thirty years. The deficit was nearly 6%of GDP. Source: Office for National Statistics
  • 13.
    Some Causes ofa Current Account Deficit • Higher inflation than trading partners • Low levels of capital investment and research • Weaknesses in design, branding, performance Poor price and non-price competitiveness • High currency value increases prices of exports • Appreciating currency also makes imports cheaper Strong exchange rate affecting exports and imports • Recession cuts value of exports to these countries • Might be barriers to switching to other markets e.g. UK businesses struggle to sell to emerging markets Recession in one or more major trade partner countries • Exporters of primary commodities might be hit by a fall in world prices • Importing nations could be hit by higher prices for oil and gas Volatile global prices (e.g. Commodities)
  • 14.
    The Export MultiplierEffect A fall in exports will reduce AD and the final impact on GDP, jobs and investment is amplified by multiplier and accelerator effects Real GDP GPL1 Y1 AD1 AS Y2 AD2 GPL2 GPL The Export Multiplier Effect Many industries rely heavily on key export industries remaining competitive – these include: • Transportation / freight / logistics businesses • Trade finance businesses e.g. Insurance and trade credit • Service businesses that operate in ports and airports Exports particularly important for regional economic performance
  • 15.
    Country 2009 20112013 2015 Brazil -2.0 -2.7 -4.0 -4.1 Mexico -0.9 -1.1 -2.4 -2.1 United States -2.7 -3.0 -2.2 -2.4 China 4.8 1.7 1.6 3.0 India -2.0 -3.4 -2.6 -0.9 South Korea 3.9 1.5 6.2 7.5 Germany 5.7 6.0 6.6 8.0 Russia 4.0 5.2 1.7 5.1 Spain -4.3 -3.2 1.4 0.0 United Kingdom -2.8 -1.7 -4.5 -5.4 Current Account Balances for Key Countries Source: IMF
  • 16.
    Economic Problems fromPersistent Trade Deficits Loss of aggregate demand which causes slower real GDP growth and reduced living standards Loss of jobs in home-based industries, may contribute to regional decline and structural unemployment problems Can lead to currency weakness and higher inflation and a country may run short of vital foreign currency reserves Trade deficit might be a reflection of lack of competitiveness / supply-side weaknesses
  • 17.
    Possible Problems fromRunning Trade Surpluses If GDP is close to capacity, a rise in the trade surplus might cause demand –pull inflation Persistent trade surpluses might lead to threat of protectionism from trade deficit nations If the surplus is due to high saving / low consumption, living standards might be too low Surplus might be result of exporting high-priced commodities – prices are volatile/unpredictable
  • 18.
    Economic Policies toReduce a Trade Deficit • Demand management: A tightening of fiscal and/or monetary policy reduces real spending power of consumers and leads to lower spending on imports (fall in M improves trade balance) • Lower exchange rate reduces the foreign price of exports and makes imports more expensive – causes changes in demand • Supply-side improvements: • Policies to raise labour productivity and encourage start- ups with export potential e.g. Life sciences, digital etc • Investment in human capital to boost productive capacity and competitiveness in high-value industries such as bio- technology, engineering, medicine, tourism • Protectionist measures such as import quotas and tariffs (NB: UK limited by global trade agreements e.g. EU and WTO rules)
  • 19.
    Some Reasons forthe UK’s Persistent Trade Deficit High income elasticity of demand (Yed) for imported goods and services – demand for imports grows strongly when consumer spending is rising Some weaknesses on supply-side of the economy (i.e. Low research and development spending, low rate of capital investment) Many UK businesses finding it hard to finance a rise in exports (effects of credit squeeze) Majority of British exports go to slower-growing countries in Europe e.g. Ireland, Spain and also the USA. Less successful in exporting to emerging nations
  • 20.
    The Global CompetitivenessIndex uses indicators which measure: Indicator Brief comment on the indicator Effectiveness of institutions Protection of property rights, rule of law, corruption Quality of infrastructure Quality of transport, communications, energy etc. Macroeconomic performance Inflation, fiscal balance, government debt, growth Health and primary education Malaria incidence, prevalence of HIV, mortality rates Higher education and training Quality of teaching and attainment e.g. in Maths Efficiency of goods & labour markets Intensity of competition, tariffs, other barriers Technological readiness Internet use, availability of latest technologies Sophistication of business Supplier quality, business clusters, Innovation Patent applications, research & development spend Indicators used to judge Competitiveness
  • 21.
    Indicator UK ranking outof 144 countries Overall competitiveness 9/144 Institutions 12/144 Infrastructure 10/144 Macroeconomic environment 107/144 Labour market efficiency 5/144 Technological readiness 2/144 Highlighted problems for UK business • Access to financing • Inadequately educated workforce Data on UK Competitiveness for 2014
  • 22.
    Analysis: International (External)Competitiveness External competitiveness is the ability to sell goods and services at competitive prices in a foreign country • Cost competitiveness • Differences in unit labour costs – reflected in producer prices • Non-price competitiveness • Product quality, design, reliability and performance, choice, after-sales services, marketing, branding and the availability and cost of replacement parts • Non-wage costs: • Costs of meeting environmental / health regulations • Environmental taxes e.g. carbon taxes and waste taxes • Employment protection laws and health and safety laws • Requirements to provide pensions for employees
  • 23.
    Balance of Paymentsand Trade EdExcel AS Economics 2.1.4

Editor's Notes

  • #7 In this section on the balance of payments, first make sure you know the main parts of the current account balance. Then build an understanding of the meaning of Balance of Payments deficits and surpluses on the current account. For this unit, emphasis will be on the current account. Most AS questions make special reference to a country’s balance in trade in goods and services. Understand the causes & costs of an imbalance in the current account and be able to analyse and discuss the impact on the current account of factors including: a change in the exchange rate, changes in the state of the world economy, non-price factors. Much of this topic is closely linked to your study of the economics of exchanges rates.