OFFSHORE WIND RESOURCE ASSESSMENT OFF THE SOUTH AFRICAN COASTLINE
WP Technical Paper - Inter-annual variability of wind speed in South Africa
1. INTER-ANNUAL VARIABILITY OF WIND SPEED IN SOUTH AFRICA
Matthew Behrens and David Pullinger
Wind Prospect Ltd, South Africa and United Kingdom
February 2016
Abstract
Wind Prospect has undertaken a study of ground stations and long-term reanalysis data sources
across South Africa, including South African Weather Service stations, MERRA and ERA-Interim data
points. The purpose of the study is to determine a suitable inter-annual variability (IAV) figure for
the region in order to more accurately represent the uncertainties in wind resource and energy
yield assessments.
The study was undertaken using a total of 26 ground stations and corresponding MERRA and ERA-I
datasets. Previous assumptions as to IAV in South Africa are shown to be conservative with a mean
of 4.3% being determined from this work. Relationships between long-term and short-term data
from ground stations were investigated and it was determined that, overall, no correlation could be
found between the two in terms of IAV. The relationship between ground stations and reanalysis
datasets was also studied and it was concluded that there was no consistent adjustment that could
be applied to produce a representative IAV. The study also showed that the required period in
order to determine a converged, and therefore representative, IAV figure was 8 years for surface
stations and 15 and 13 years for MERRA and ERA-I respectively.
Finally some guidelines as to an appropriate procedure for assessing site specific IAV within South
Africa are presented.
1. INTRODUCTION
1.1 Inter-annual variability
Energy yield assessments involve a number of
uncertainties when predicting the future yield
of a site. One such uncertainty, which
impacts energy yield, is the inter-annual
variability of wind speed.
Inter-annual variability (IAV) is a measure of
the extent to which wind speeds vary from
one year to the next. IAV is defined as the
standard deviation of annual mean wind
speed over several years and is typically
represented as a percentage. Variation in
wind speeds is proportional to the variation
in energy yield and therefore the IAV figure is
an important input to assessing the
confidence in an energy yield prediction for a
wind farm. From experience, typically over a
10-year return period the inter-annual
variability impacts on anywhere between 10%
and 25% (figures representing both historic
and future wind variability) of the overall
uncertainty. The accuracy of energy yield
predictions is crucial for banks and investors
looking to finance large-scale wind farms and
evaluate the project. For this reason, it is
necessary to use representative IAV figures
when assessing sites in different regions.
Producing a site-specific or even regional IAV
figure is not a simple task. Wind
measurements for potential wind farms are
typically carried out on-site over a short
period of time using a meteorological mast
and/or a SoDAR (Sonic Detection and
Ranging) or LiDAR (Light Detection and
Ranging) device. A typical measurement
campaign lasts between 12 months and up to
a few years (often only one to two years in
South Africa). Ideally one would be able to
determine IAV for a specific site using on-site
measurements, but the period recorded is
usually not sufficient to draw conclusions on
the IAV for the site.
Given the limited availability within South
Africa, but also in many regions
internationally, of long-term (greater than 10
year) consistent data sources, reanalysis data
sources provide an attractive potential input
for an IAV study.
2. Reanalysis data sources take historical,
climatic measurements from a variety of
sources (surface-based stations, rawinsonde,
satellite, aircraft measurements etc.) and
apply a model which is used to predict the
states of the climate at different times and
locations. Specifically for meteorological
reanalyses it is a method for developing a
comprehensive record of how weather and
climate are varying over time. The output of
a reanalysis model is usually given at a specific
spatial and temporal resolution
A key limitation of reanalysis data sources is
whether the output can be considered to be
consistent. Several papers have been
produced attempting to validate the
consistency and suitability of reanalysis data
sources (Brower, 2006), (Jiminez, 2012),
(Lileo and Petrik, 2011) and (Pullinger &
Davies, 2012). However the use of reanalysis
data within IAV assessments has not been
investigated in as much detail.
1.2 Previous studies
There is limited literature available on the
inter-annual variability of wind speeds
internationally. The current industry standard
is to use an IAV figure of ~6% that is
applicable to North-Western Europe and
based on a relatively old study (Raftery,
1997). Whilst more recent investigations into
IAV broadly support this assumption for
north-western Europe, it is often applied in
other parts of the world which could have
IAV values that differ substantially.
Work by (Brower, et al., 2013) provides a
detailed investigation into IAV within
reanalysis data sources within the United
States of America. In addition a global map
was also produced using a combination of tall
tower and reanalysis data sources. The paper
concluded that IAV varied widely depending
on location with figures ranging from less
than 3% up to 10%. Most importantly, the
results implied that assuming a standard value
for all wind farm sites was not suitable.
(Brower, et al., 2013) is based on a
reasonable sample across the United States,
however the resolution and
representativeness of figures outside this
region, in particular Africa, are questionable
given the low amount of input data.
A preliminary investigation of inter-annual
variability (Pullinger & Hill, 2015), which
examined a total of 53 sites including 25 sites
across South Africa, concluded that inter-
annual variability predicted using reanalysis
datasets is consistently lower than traditional
cup anemometry. A sample of reanalysis
datasets demonstrate that inter-annual
variability converges on a consistent figure
after 15-years.
1.3 Need for South African IAV
figures
The South African wind industry has
experienced tremendous growth over the
past few years since the launch of the
Renewable Energy Independent Power
Producers Procurement Programme
(REIPPPP) in 2011 (Department of Energy,
2011). The programme has transformed the
country into one of the most attractive
renewable energy markets globally with
project tariffs averaging as low as R0.62/kWh
in round 4 of the programme (Horstmann,
2015).
Financial predictions for wind energy projects
are based on the energy yield predictions (in
South Africa often documented as Forecast
Energy Sales Reports (FESR)) made by energy
resource professionals. Consequently, it is
important to update the assumptions
associated with these predictions, based on
evidence, to truly represent the conditions
found at the specific location being assessed.
In a South African context, the accuracy and
confidence in energy yield predictions is vital
in planning a competitive bid within the
REIPPPP that can still produce returns for
investors.
However, IAV is a difficult measure to assess
for a number of reasons. To find a converged
IAV figure it requires the use of data from
reliable datasets spanning a relatively long
time period. Generally ground stations in
South Africa span a maximum of 16 years and
have to be restricted to shorter periods due
to inconsistencies, changes to equipment, etc.
Furthermore, these stations only measure at
a height of 10m, whereas turbines typically
have a hub height of approximately 80m-
120m. Ground station measurements are
3. more susceptible to their immediate
surroundings and conditions can differ when
compared with wind speeds at tip heights of
up to 200m. Despite these challenges, a
representative IAV figure can be determined
if multiple, consistent datasets, covering an
appropriate period of time, are all referenced
for a particular area. In order to more
accurately represent the conditions of the
South African climate, a study of the
country’s IAV has been conducted.
1.4 Summary of objectives
This study aimed to achieve several
objectives and provide a foundation for
further work to be carried out. The three
primary objectives of the study were as
follows:
Determine a general IAV figure applicable
to South Africa and the individual sites
being studied.
Determine if a consistent relationship in
IAV exists between reanalysis data and
ground station data or long-term and
short-term ground station data.
Investigate the data period required for
IAV to converge on a consistent value.
The aim of the study is to provide practical
guidance on the best approach to evaluating
IAV for South African wind energy projects.
It should also be useful for all stakeholders
within wind energy projects as a reference as
to appropriate assumptions when evaluating
energy yield.
2. METHODOLOGY
2.1 Input data
Three datasets were used in carrying out the
study, with MERRA (Rienecker, 2011) and
ERA-I (Dee, 2011) datasets being selected as
long-term reanalysis references.
Observational data from 26 South African
Weather Service (SAWS) ground stations
were used as inputs into the study. The
results from the previous study (Pullinger &
Hill, 2015), using data from the Wind Atlas
for South Africa (WASA) masts was also
used in order to confirm short term trends.
MERRA and ERA-I were selected as both are
freely available and are widely used in energy
yield assessments. Furthermore, both
datasets have relatively high horizontal
resolutions of ~55km (0.5° latitude, 0.66°
longitude) and ~80km (0.75°) for MERRA and
ERA-I, respectively. Measurement heights of
50m and 75m were used from the two
datasets. A summary of the studied datasets
can be found in Table 1.
2.2 Screening of datasets
The initial stage of the study involved
collecting datasets for ground stations,
MERRA and ERA-I points across the country.
Focus areas included regions of the Northern
Cape, Western Cape, Eastern Cape and
Kwa-Zulu Natal surrounding existing or still-
to-be constructed wind farms and regions
best suited for wind energy development.
Selected datasets spanned a similar portion of
the country to that covered by the Wind
Atlas for South Africa (Sanedi et al., 2014),
which was consulted as a guideline.
For every ground station dataset that was
selected, the nearest representative MERRA
point and ERA-I point was also downloaded.
The coordinates of each ground station were
recorded. Station locations were also plotted
on a map to ensure that a reasonable spread
of datasets was obtained and the results
were representative of the region being
studied. Metadata was consulted, where
available, to check for any significant changes
to SAWS ground stations over the relevant
period. Figure 1 illustrates the spread of
ground stations used in the study.
Once all datasets had been downloaded, the
data was exported to Microsoft Excel for
analysis. The maximum period of ground
station, MERRA and ERA-I data available was
Source
Horizontal
Resolution
Height above
ground level
Dates
Temporal
Resolution
MERRA 0.5° x 0.67° 50m 1985 to 2015 hourly
ERA- I ~80km 75m 1985 to 2015 3-hourly
SAWS n/a 10m 1999 to 2015 hourly
Table 1: Summary of datasets used
5. 2.5 Data period required for
convergent IAV figure
Further work was done to determine the
length of data required for the IAV figure to
converge on a consistent value. Data periods
of 3 to 31 years were used, depending on the
data available for each site. The IAV was
calculated first considering only 3 years of
the data period (starting with the most
recent data available) and was then
determined for all sequential annual data
periods up to a maximum of 31 years. IAV
was plotted for ground station, MERRA and
ERA-I for the individual sites.
Ground station, MERRA and ERA-I figures
were plotted separately which made it
simpler to observe if IAV converged within a
minimum amount of years across all the sites.
In this study, a converged IAV was defined as
one which remained within 15% of the long-
term value from that data period onwards.
The long-term value is the final IAV
calculated using the full dataset or screened
dataset (for ground stations). 115% and 85%
bounds were applied to the plots for each
site and the results were recorded.
3. RESULTS
3.1 Overall IAV figure for South
Africa
After screening each of the ground station
datasets and restricting the data period, it
was found that IAV ranged from 2.0% to 6.6%
(using the 238 cumulative years of data from
22 stations across the country). An overall
country IAV of 4.3% was determined using a
mean of all ground station datasets. Overall,
concurrent MERRA data was the closest of
the two reanalysis datasets in estimating IAV
with a mean of 4.0%. ERA-I underestimated
with a mean of 3.4%. MERRA IAV ranged
from 2.3% to 6.0% and ERA-I ranged from
2.2% to 4.6%. The overall IAV results are
presented in Table 2.
Table 2: Minimum, mean and maximum IAV for
each dataset studied
Ground
Station
MERRA ERA-I
Minimum 2.0% 2.3% 2.2%
Mean 4.3% 4.0% 3.4%
Maximum 6.6% 6.0% 4.6%
3.2 Site-specific IAV and relationships
between datasets
An analysis of the sites on an individual basis,
using the ratios described previously, showed
that no correlation existed between
reanalysis data and ground station data IAV.
Ratios were as high as 300.4% and as low as
36.2% across the 22 sites studied. The overall
means for the two ratios supported the
previous conclusion that MERRA was closer
to predicting ground station IAV than ERA-I
data. An overall mean of 104.4% was
observed for MERRA/ground station and
87.2% for ERA-I/ground station. In terms of
the long-term to short-term ground station
IAV ratios, a broad range of values was also
observed with results varying significantly
from site to site (80.7% up to 265.3%). The
ratio results are presented in Table 3 and
Table 4 below.
Table 3: Minimum, mean and maximum values for
reanalysis/ground station ratios
Table 4: Minimum, mean and maximum values for
long-term/short-term ratios
Ground Station
Minimum 80.7%
Mean 126.7%
Maximum 265.3%
Following the site-specific investigations the
sites were grouped based on location in
order to attempt to identify whether regional
trends could be identified. The results of this
were inconclusive with no apparent
correlation between location and IAV figure.
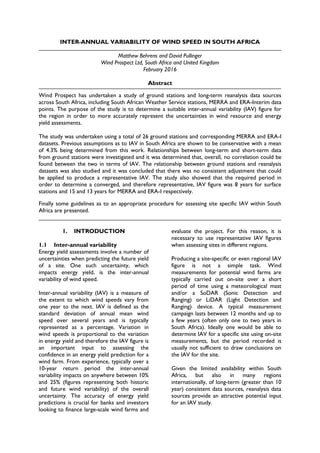
3.3 Data period required for
convergent IAV figure
Following the methodology discussed earlier
in this paper (Section 2.5), 3 plots were
produced for each site corresponding to the
3 datasets studied. A sample plot is for a
single data source and site is provided in
Figure 2.
MERRA :
Ground Station
ERA-I : Ground
Station
Min 36.2% 42.5%
Mean 104.4% 87.2%
Max 300.4% 165.5%
6. Figure 2: Plot of IAV using increasing lengths of data
period
As illustrated in this example, the dataset
converged to within 15% of the long-term
value after 10 years of data were considered
(the solid blue line remains within the dashed
red lines after 10 years). As stated previously,
a converged IAV was defined as one which
remains within 15% of the long-term value.
The data period required for each dataset’s
IAV figure to converge is presented in Table
5.
Table 5: Data period required for converged IAV
Ground
Stations
MERRA ERA-I
No. of years 8 15 13
Standard
Deviation (years)
0.45 0.16 0.20
4. CONCLUSIONS &
RECOMMENDATIONS
4.1 Discussion of results
Following the results of this study on IAV in
South Africa, it has been concluded that the
industry standard figure of 6% is
conservative. It is recommended that site
data is used where possible to make an
informed judgement.
4.2 Overall IAV figure for South
Africa
Overall IAV was found to have a mean of
4.3% (and should generally be within 2% -
6%). WP notes that the median is 4.35% and
that the spread appears normally distributed
for ground stations. This agrees with Wind
Prospect’s experience in the region and
preliminary investigations of short-term site
data. These results provide a useful guideline
as to appropriate value ranges to expect
when performing or reviewing energy yield
assessment uncertainties.
4.3 Site-specific IAV and relationships
between datasets
When investigating relationships between the
various datasets, it was found that no
correlation existed between reanalysis data
and ground station data when looking at IAV.
Ultimately, no suitable adjustment could be
applied to either MERRA or ERA-I datasets
to find a representative IAV figure due to the
vast range of ratios observed across the sites.
This broad range of ratios was also observed
when looking at the relationship between
short-term and long-term ground station IAV
and no relationship was apparent.
The in-ability of the study to identify a
relationship between ground stations and
reanalysis data sources means that it is
difficult to draw firm conclusions. This
contradicts the study by (Brower, et al.,
2013) which found a relationship between
ERA-I and ground stations, the most likely
reason for this is the difference in regions
studied. South Africa has a very different
climate compared to some of the regions
within the aforementioned study. In South
Africa the ability of MERRA or ERA-I to
represent the long-term wind resource is
much lower than in many other regions
globally. Further detailed investigations within
other regions and climates are
recommended.
4.4 Data period required for
convergent IAV figure
It is recommended that a minimum data
period of 8 years is used to determine
representative IAV when using ground
station data. For MERRA and ERA-I,
minimum data periods of 15 years and 13
years are recommended, respectively. It was
found that IAV converged for the majority of
sites for these minimum lengths – as
demonstrated by the low standard deviation
figures presented in Table 5. Again these
figures will be useful guidelines when
assessing IAV for a specific site and the inputs
into this assessment.
7. 4.5 Impact on wind resource
assessments
This study is considered to act as a
benchmark and reference for wind energy
projects in South Africa. In order to make
the results directly relevant for wind energy
professionals the following guidelines are
made as to how to assess site-specific inter-
annual variability:
1. Multiple near-site reference sources
should be investigated;
2. Consistency of the datasets should be
verified;
3. Data period should be >=8-years for
surface stations and >=15 years for
reanalysis data;
4. Outliers should be excluded – based on
inter-comparison of data sources and
also considering the ranges presented
within this report (2-6%);
5. The relative under-prediction of ERA-I
when compared to ground stations
should be considered within the
assessment;
6. Based on this range of results an
assessment can be made as to a suitable
site-specific figure;
7. Justification of the chosen figure should
be presented within the energy yield
report.
4.6 Further work
It is hoped that this first paper on the topic
of IAV in South Africa will allow for more
work to be published by stakeholders in the
market (both within South Africa and
internationally) in order to encourage
discussion and ultimately increase confidence
in energy yield predictions. Further work on
the topic of inter-annual variability should
cover the following areas:
Addition of further data sources in
South Africa, especially from long-term
tall meteorological masts, into this study
to improve confidence in the results.
The testing of the application of this
study’s approach to other regions of the
world.
How long-term weather patterns or
recurring climatic events are accounted
for in IAV calculations – should IAV be
considered purely as an uncertainty or
should a bias be considered in some
cases.
Further investigation into whether
ground stations are representative of
wind power project locations which
experience greater exposure and higher
wind speeds.
5. ACKNOWLEDGEMENTS
The authors would like to thank the South
African Weather Service for ground station
metadata and the data provided by these
stations.
All MERRA, ERA-I and ground station
datasets were downloaded using WindPRO
software v3.0.629 developed by EMD
International A/S: http://www.emd.dk or
http://www.WindPRO.com.
Lastly, the authors would like to
acknowledge the Global Modeling and
Assimilation Office (GMAO) and the GES
DISC (Goddard Earth Sciences Data and
Information Services Center), as well as the
European Center for Medium-Range
Weather Forecasts for the dissemination of
MERRA and ERA-Interim.
6. BIBLIOGRAPHY
Brower, 2006. The use of NCEP/NCAR reanalysis
data in MCP. Athens, Greece, s.n.
Brower, M. C., Lledó, L., Barton, M. S. & Dubois,
J., 2013. A Study of Wind Speed Variability Using
Global Reanalysis Data, s.l.: AWS Truepower.
Department of Energy, 2011. Fact Sheet for the
Media Briefing Session on 31 August 2011 re the
Renewable Energy Independent Power Producer (IPP)
Programme, s.l.: Department of Energy.
Horstmann, J., 2015. Engineering News. [Online]
Available at:
http://www.engineeringnews.co.za/article/renewab
les-tariffs-dropped-over-25-in-round-4-but-how-
low-can-they-go-2015-04-23
[Accessed January 2016].
Jiminez, e. a., 2012. Comparison of NCEP/NCAR and
MERRA reanalysis data for long-term correction in
wind energy assessment. Copenhagen, Denmark,
s.n.
8. Lileo and Petrik, 2011. Investigation of the use of
NCEP/NCAR, MERRA and NCEP/CFSR reanalysis data
in wnd resource analysis. Brussels, Belgium, s.n.
Pullinger, D. & Davies, O., n.d. Validation of MERRA
data as long-term reference source in Great Britain.
s.l.:s.n.
Raftery, e. a., 1997. Understanding the risks of
fincancing wind farms. Dublin, Ireland, s.n.
Sanedi et al., 2014. WASA Project. [Online]
Available at: http://www.wasaproject.info/
[Accessed November 2015].