Legume pastures can reduce N2O emissions intensity
1. Legume pastures can reduce N2O emissions intensity in subtropical
cereal cropping systems
Massimiliano De Antoni Migliorati a,
*, Michael Bell b
, Peter R. Grace a
, Clemens Scheer a
,
David W. Rowlings a
, Shen Liu c
a
Institute for Future Environments, Queensland University of Technology, Brisbane, QLD 4000, Australia
b
Queensland Alliance for Agriculture and Food Innovation, University of Queensland, Kingaroy, QLD 4610, Australia
c
School of Mathematical Sciences, Queensland University of Technology, Brisbane, QLD 4000, Australia
A R T I C L E I N F O
Article history:
Received 19 August 2014
Received in revised form 5 February 2015
Accepted 16 February 2015
Available online 25 February 2015
Keywords:
Nitrous oxide emissions
Legume pasture
Cereal cropping system
N fertiliser management
Automated greenhouse gas measuring
system
A B S T R A C T
Alternative sources of N are required to bolster subtropical cereal production without increasing N2O
emissions from these agro-ecosystems. The reintroduction of legumes in cereal cropping systems is a
possible strategy to reduce synthetic N inputs but elevated N2O losses have sometimes been observed
after the incorporation of legume residues. However, the magnitude of these losses is highly dependent
on local conditions and very little data are available for subtropical regions. The aim of this study was to
assess whether, under subtropical conditions, the N mineralised from legume residues can substantially
decrease the synthetic N input required by the subsequent cereal crop and reduce overall N2O emissions
during the cereal cropping phase. Using a fully automated measuring system, N2O emissions were
monitored in a cereal crop (sorghum) following a legume pasture and compared to the same crop in
rotation with a grass pasture. Each crop rotation included a nil and a fertilised treatment to assess the N
availability of the residues. The incorporation of legumes provided enough readily available N to
effectively support crop development but the low labile C left by these residues is likely to have limited
denitrification and therefore N2O emissions. As a result, N2O emissions intensities (kg N2O-N
yieldÀ1
haÀ1
) were considerably lower in the legume histories than in the grass. Overall, these findings
indicate that the C supplied by the crop residue can be more important than the soil NO3
À
content in
stimulating denitrification and that introducing a legume pasture in a subtropical cereal cropping system
is a sustainable practice from both environmental and agronomic perspectives.
ã 2015 Elsevier B.V. All rights reserved.
1. Introduction
Mitigating climate change and achieving food security are two
of the key challenges of the twenty-first century. Cereals are by far
the world’s most important food source, contributing on average
50% of daily energy intake and up to 70% in some developing
countries (Kearney, 2010). By 2050 the world’s population is
forecast to be over a third larger than at present (UNFPA, 2011) and
cereal demand is predicted to increase by 60% (FAO, 2009).
Pronounced intensification of cereal production is expected to take
place in subtropical regions (Smith et al., 2007), identifying the
need for more nitrogen (N) to be supplied to these agro-
ecosystems.
There is consensus (e.g., Tilman et al., 2002; Crews and Peoples,
2004; Jensen et al., 2012) that both the manufacture and use of
synthetic N fertilisers in crop production generate substantial
environmental threats, with the emission of significant amounts of
nitrous oxide (N2O) arguably one of the most important. N2O is a
potent greenhouse gas (298 CO2-eq over a 100 year time horizon
(Myhre et al., 2013) associated also with the depletion of the ozone
layer in the stratosphere (Ravishankara et al., 2009). Together,
these issues confirm that alternative means of intensification must
be implemented to avoid the increase of subtropical cereal
production through an overuse of synthetic N. If not, the result
would be a net increase in N2O emission rates from these agro-
ecosystems.
The reintroduction of legumes in crop rotations is one possible
strategy to reduce synthetic N inputs whilst sustaining grain yields
(Crews and Peoples, 2004; Jensen et al., 2012). Owing to their
ability to fix atmospheric N2 in symbiosis with rhizobia bacteria,
legumes can reduce N demand of the subsequent crop, and
* Corresponding author. Tel.: +61 7 3138 1360; fax: +61 7 3138 4438.
E-mail address: max.deantonimigliorati@qut.edu.au (M. De Antoni Migliorati).
http://dx.doi.org/10.1016/j.agee.2015.02.007
0167-8809/ã 2015 Elsevier B.V. All rights reserved.
Agriculture, Ecosystems and Environment 204 (2015) 27–39
Contents lists available at ScienceDirect
Agriculture, Ecosystems and Environment
journal homepage: www.elsevier.com/locate/agee
2. consequently decrease N2O emissions associated with synthetic N
fertilisers. In an extensive review on the use of legumes to mitigate
climate change, Jensen et al. (2012) concluded that N2O emissions
during the legume growing season did not differ substantially from
unplanted or unfertilised soils. However, elevated N2O losses were
sometimes reported after the termination of a legume crop, when
plant residues were returned to the soil (Gomes et al., 2009; Pappa
et al., 2011). The low C:N ratio of legume residues can indeed lead
to rapid tissue mineralisation once incorporated into the soil. As a
result, accumulation of mineral N can occur in the soil, increasing
the potential for substantial amounts of N to be lost as N2O via
nitrification and denitrification (Jensen et al., 2012).
The magnitude of N2O losses in response to legume residue
incorporation is, however, highly dependent on local climate and
soil conditions (Rochette et al., 2004). Subtropical cropping
systems are characterised by intense and frequent rainfall events
during the summer months. The warm and moist soil conditions
during these periods can accelerate legume tissue mineralisation
compared to temperate environments, leading to ideal conditions
for nitrifying and denitrifying bacteria and therefore magnifying
the risk of high N2O emissions (Granli and Bøckman, 1995; Skiba
et al., 1997).
However, little data is currently available for these agro-
ecosystems (Mosier et al., 2004) and, although numerous studies
have investigated N2O emissions after the termination of legume
ley pastures prior to a return to cropping, the vast majority were
conducted in temperate climates (Wagner-Riddle and Thurtell,
1998; Baggs et al., 2000; Robertson et al., 2000; Rochette et al.,
2004; Schwenke et al., 2010).
The overall aims of this study were therefore to assess whether,
under subtropical conditions: (i) the N mineralised from legume
residues can substantially reduce the synthetic N input required by
the subsequent cereal crop; (ii) N2O losses occurring after the
incorporation of legume residues can be minimised via synchro-
nizing the release of N derived from the residues with the N
demand of the subsequent crop; (iii) reducing the synthetic N
input applied to a cereal in rotation with a legume crop can
significantly decrease overall seasonal N2O during the cereal
phase.
Seasonal N2O emissions and yields were monitored in a cereal
crop (sorghum) following a legume (legume–ley pasture) and
compared to the same crop in rotation with a non-leguminous crop
(grass ley pasture). Each rotation included both a nil and a fertilised
treatment. The N fertiliser applied to sorghum in the legume–
cereal rotation was reduced compared to the grass–cereal to assess
the availability of the N fixed by the legume ley pasture.
This study is the first to use a fully automated greenhouse gas
measuring system to precisely quantify N2O emissions in a
subtropical cereal crop after the termination of a legume ley
pasture. The results of this study will contribute to define
mitigation strategies for the sustainable intensification of sub-
tropical agroecosystems.
2. Materials and methods
2.1. Local climate and soil characteristics
This experiment was conducted in the subtropical region of
Australia at the J. Bjelke Petersen Research Station of the
Department of Agriculture, Fisheries and Forestry (DAFF). The
research site is located in Kingaroy (26
340
54,300
S, 151
490
43.300
E,
altitude 441 m a.s.l), in the southern Burnett region of southeast
Queensland, Australia. The subtropical climate (classified as Cfa
according to the Köppen climate classification) has warm, humid
summers and mild, dry winters. Daily mean maximum and
minimum temperatures range from 20.1
C to 4.0
C in winter and
from 29.6
C to 16.5
C in summer, respectively. Local mean annual
precipitation is 776.2 mm and varies from a minimum of 28.6 mm
in August to a maximum of 114.1 mm in January (Australian Bureau
of Meteorology, 2015). The soil is a Orthic Ferralsol (FAO, 1998),
characterized by relatively slow permeability and high clay content
(50–65% clay). The effective rooting depth is 1.2 m and the plant
available water holding capacity is 100 mm. The main physical and
chemical soil properties of the field site are highlighted in Table 1.
2.2. Experimental set-up
The experiment was established in a slit plot design with two
main plots (legume and grass ley pastures) and two sub plots
(N fertiliser rates) with three replicates. Each main plot was
30 m  10.8 m, with main plots split into two subplots (15 m  and
10.8 m) during the sorghum cropping season. Allowing for buffer
rows, the effective subplot area was 12 m  7.2 m, or 8 crop rows
spaced 0.9 m apart.
2.2.1. Cropping histories
N2O emissions and yields were measured in plots planted with
sorghum (Sorghum bicolor L.) following two distinct cropping
histories. One crop rotation (hereafter called legume cropping
history) included two seasons of alfalfa pasture (Medicago sativa, L.,
summers 2009/2010 and 2010/2011), one season of maize (Zea
mays, L., summer 2011/2012) and one season of sulla ley pasture
(Hedysarum coronarium L., winter 2012) prior to sowing sorghum.
The other crop rotation (hereafter called grass cropping history)
included two seasons of a mixed rhodes grass (Chloris gayana, K.)
and alfalfa pasture (summers 2009/2010 and 2010/2011), one
season of maize (summer 2011/2012) and one season of wheat
(Triticum aestivum L., winter 2012). Although the mixed alfalfa
pasture was sown in consociation with rhodes grass, the rhodes
grass became rapidly predominant and by the end of the first
season the pasture was composed almost completely by rhodes
grass. All crops in both rotations were unfertilised. Sulla and wheat
were direct drilled in August 2012 and managed as forage crops.
Both crops were terminated 28 November 2012 with all residues
returned to the soil as mulch before being incorporated with four
shallow cultivations (20 cm). The incorporation of sulla residues
(2.3 t dry matter haÀ1
, 1.57% N) was estimated to supply the soil
approximately 36 kg N haÀ1
, while wheat residues (1.24 t dry
matter haÀ1
, 0.75% N) about 9 kg N haÀ1
. The entire field trial was
irrigated with 20 mm on 10 December 2012, two days before plots
were planted with sorghum (12 December 2012). Further details
on the management of the two crop rotations can be found in Bell
et al. (2012).
2.2.2. Sorghum establishment and management
Sorghum (cultivar Pioneer G22) was planted with a plant
density of 7 plants mÀ2
and an inter-row space of 90 cm. Two N
Table 1
Main soil physical and chemical properties of first 30 cm of soil profile for the two
cropping histories (mean Æ SE, n = 3) at the beginning of the sorghum season at
Kingaroy research station, Queensland, Australia.
Soil property (0–30 cm) Legume Grass
pH (H2O) 5.12 Æ 0.03 5.30 Æ 0.02
DOC (kg C haÀ1
)*
43.04 Æ 11.98 56.05 Æ 2.97
PMN (kg N haÀ1
)**
12.78 Æ 1.33 9.25 Æ 1.08
Bulk density 0–30 cm (g cmÀ3
) 1.18 Æ 0.08
Texture (USDA) Clay
Clay (%) 55
Silt (%) 14
Sand (%) 31
*
Dissolved organic carbon.
**
Potentially mineralisable nitrogen.
28 M. De Antoni Migliorati et al. / Agriculture, Ecosystems and Environment 204 (2015) 27–39
3. fertilisation rates were tested on each cropping history, resulting in
a total of four treatments:
L0: Sorghum grown in the legume cropping history, no N
applied;
L70: Sorghum grown in the legume cropping history, 70 kg
N haÀ1
applied;
G0: Sorghum grown in the grass cropping history, no N applied;
G100: Sorghum grown in the grass cropping history, 100 kg
N haÀ1
applied.
Treatments L70 and G100 were base dressed at planting,
banding 20 kg N haÀ1
as urea. On 15 January 2013 (eight leaf stage)
both treatments were inter-row cultivated and side dressed with
banded urea, receiving 50 kg N haÀ1
(L70) or 80 kg N haÀ1
(G100).
The N application rate for G100 was designed to achieve maximum
yield potential and was representative of farming practices of the
region. The synthetic N rate used in L70 was reduced compared to
G100 to assess whether the estimated 30 kg N haÀ1
resulting from
the mineralisation of the sulla residues would have been available
to sorghum.
To prevent water stress limiting the potential yields, the trial
was irrigated three times over the season (25 mm on 18 December
2012, 40 mm on 4 January 2013 and 40 mm on 18 January January)
using surface stored dam water and overhead sprinklers. Sorghum
was harvested on 18 June 2013. The trial area was left fallow until
being cultivated on 6 August 2013 (offset disc and chisel plough to
a depth of 20 cm) and on 19 September 2013 (offset disc to a depth
of 20 cm) to prepare the seedbed for the next crop. Irrigations were
conducted on 27 and 29 August 2013 (30 and 40 mm, respectively)
to assess whether significant amounts of N were still available for
nitrification or denitrification after harvest. Details about crop
rotations and farming operations are displayed in Table 2.
2.3. Measurement of N2 and CO2 emissions
The use of a fully automated greenhouse gas measuring system
enabled a long-term high temporal resolution dataset to be
established. N2O fluxes were monitored for nine months, from
sorghum planting (12 December 2012) to the final preparation of
the seedbed for the subsequent crop (19 September 2013) to assess
overall N2O losses over the cropping season as well as the post-
harvest period.
N2O emissions were captured using twelve automated sam-
pling chambers (one per plot) made of transparent acrylic panels.
Each chamber measured 50 cm  50 cm  15 cm and was attached
via a rubber seal to stainless steel frames inserted 10 cm into the
ground. The chambers were closed airtight with lids operated by
pneumatic actuators and connected to a fully automated sampling
and analysis system as described in De Antoni Migliorati et al.
(2014b) and Scheer et al. (2013).
During a measurement cycle a set of four chambers closed for
60 min with each chamber sampled 4 times for 3 min. A certified
gas standard of 500 ppb N2O (BOC – Munich, Germany- and Air
Liquide – Dallas, TX, USA) was pumped into the gas chromatograph
every 15 min. At the end of the cycle the chambers reopened and
the next set of four chambers closed for sampling. One complete
cycle of twelve chambers lasted 3 h, during which each chamber
was sampled for 1 h and remained opened for 2 h to restore
ambient conditions. This method enabled the determination of up
to 8 single fluxes per chamber per day.
The air samples taken from each chamber headspace were
automatically pumped to the sampling unit. During the 3 min
sampling period the air sample was continuously analysed for CO2
concentration using a single path infra-red gas analyser (Licor, LI
820, St. Joseph, MI, USA). N2O concentration was analysed injecting
3 ml of gas sample into the carrier gas (N2) of a gas chromatograph
(Model 8610C, SRI Instruments, USA) equipped with a 63
Ni electron
capture detector (ECD). A column filter containing sodium
hydroxide-coated silica (Ascarite, Sigma–Aldrich, St. Louis, MO,
USA) was installed upstream of the ECD to minimize the CO2 and
water vapor interference on N2O measurements. The column filter
was replaced every two weeks.
During the 3 h of a complete measuring cycle the system was
automatically calibrated twelve times by a single point calibration
using the certified gas standard of 500 ppb N2O. Greater accuracy
was achieved with a multi-point calibration during the measuring
season using certified gas standards of 500, 980, 5030 ppb N2O
(BOC – Munich, Germany). The GC response over this range was
determined to be linear so no correction was necessary to precisely
determine high fluxes. The detection limit of the system was
calculated using the methodology established by Parkin et al.
(2012) and was approximately 0.5 g N2O-N haÀ1
dayÀ1
for N2O and
1 kg CO2-C haÀ1
dayÀ1
for CO2, respectively. Throughout the season
all system components were constantly checked for leaks, making
the sample dilution due to leakage negligible. The system was
programmed to open the chambers if rain events exceeded 5 mm
or the internal air temperature of the chamber exceeded 55
C.
During irrigation events the system was stopped and all chamber
lids were opened to allow water to enter inside the chambers.
The chamber placement strategy was based on the methodolo-
gy established by Kusa et al. (2006) and Parkin and Kaspar (2006)
in order to measure N2O emissions from both a diffused source
(crop residues) and a localized source (banded fertiliser). Two of
Table 2
Details of crop rotations and farming operations for the four treatments at Kingaroy research station.
Date L0 L70 G0 G100
Summer 2009/2010 Alfalfa pasture Alfalfa pasture Rhodes grass + alfalfa pasture Rhodes grass + alfalfa pasture
Summer 2010/2011 Alfalfa pasture Alfalfa pasture Rhodes grass + alfalfa pasture Rhodes grass + alfalfa pasture
Summer 2011/2012 Maize Maize Maize Maize
Winter 2012 Sulla pasture Sulla pasture Wheat Wheat
28–30/11/2012 Pastures terminated and entire field trail cultivated four times with offset disc to 20 cm
10/12/2012 Entire field trail irrigated with 20 mm
12/12/2012 Sorghum planted Sorghum planted applied 20 kg N haÀ1
Sorghum planted Sorghum planted applied 20 kg N haÀ1
18/12/2012 Entire field trail irrigated with 25 mm
04/01/2013 Entire field trail irrigated with 40 mm
14/01/2013 Applied 50 kg N haÀ1
Applied 80 kg N haÀ1
18/01/2013 Entire field trail irrigated with 40 mm
18/06/2013 Entire field trail harvested
06/08/2013 Entire field trail cultivated twice with offset disc down to 20 cm
27/08/2013 Entire field trail irrigated with 30 mm
29/08/2013 Entire field trail irrigated with 40 mm
19/09/2013 Entire field trail cultivated with offset disc down to 20 cm
M. De Antoni Migliorati et al. / Agriculture, Ecosystems and Environment 204 (2015) 27–39 29
4. the three replicate chambers of each treatment were positioned
over the crop row and the third in the inter-row. Chambers
positioned over the crop row included the banded fertiliser (10 cm
from the plant row) in the chamber area. Sorghum plants inside the
chamber positioned over the crop row were cut when exceeding
the chamber headspace, a practice established by Drury et al.
(2008),Halvorson et al. (2008) and Hu et al. (2013). As recom-
mended by Kusa et al. (2006) and Parkin and Kaspar (2006), the
impact of this practice on belowground C and N dynamics, and
therefore N2O emissions, was minimised by relocating all
chambers placed over the crop row to a new section of the crop
row every fortnight. This strategy proved to be effective as only
marginal differences in daily N2O emissions were observed in the
control treatments between chambers placed in the inter-row and
over the crop row (Table 3, Fig. 5).
The measuring system was deployed immediately after
planting and temporarily withdrawn to permit farming operations
(side dressing, harvest, post-harvest cultivations). During the nine
months of this study an average of 2700 valid N2O and CO2 fluxes
were obtained for each treatment.
2.4. Calculation of N2 and CO2 emissions
Hourly N2O fluxes were calculated with the method described
by Barton et al. (2008), determining the slope of the linear increase
or decrease of the four gas concentrations measured during the
60 min of chamber closure period. In contrast, hourly CO2 fluxes
were computed using the linear increase of six concentrations
measured in the first two sampling intervals, a method used to
avoid possible saturation of CO2 partial pressure in the chamber.
N2O and CO2 fluxes were corrected for the three factors of air
temperature inside the chamber, atmospheric pressure and the
ratio between chamber volume and soil area using:
F ¼
b  VCH  MW  60  106
ACH  MVcorr  109
(1)
where F is the emission rate (mg mÀ2
hÀ1
), b is the variation of gas
concentration inside the chamber (ppb minÀ1
), VCH is the volume
of the chamber (m3
), MW is the gas molar weight (28 for N2O-N
and 12 for CO2-C), 60 is the conversion from minutes to hours, 106
converts g to mg, ACH is the surface area of the chamber (m2
), MVcorr
is the mole volume (m3
molÀ1
) corrected for pressure and
temperature as presented in Eq. (2), 109
converts ppb to mL mÀ3
.
MVcorr ¼ 0:02241 Â
273:15 þ T
273:15
Â
p0
p1
(2)
where 0.02241 m3 is 22.41 L molar volume, T is the temperature of
the chamber at the time of the measurement (Kelvin), p0 is the air
pressure at sea level and p1 is the air pressure at the study site. To
provide greater accuracy, air pressure at the site was determined
using a barometric equation based on the local altitude.
The Pearson correlation was then used to quality-check flux
measurements. Fluxes above the detection limit were discarded if
the regression coefficient (r2
) was 0.80 for N2O and 0.90 for CO2,
respectively. Mean daily fluxes for each treatment were calculated
using weighted averages of hourly data from the three replicates.
That is, for each treatment, hourly fluxes from the two chambers
over the crop row (covering 50 cm around the crop row) were
averaged. The obtained mean flux was then averaged with the
mean of hourly fluxes measured by the chamber in the inter-row
(covering 50 cm in the inter-row). This method made it possible to
accurately calculate the average N2O emissions of each treatment,
accounting for the spatial variability occurring between two crop
rows (98 cm). Cumulative N2O fluxes (kg N2O-N haÀ1
) were
determined by summing daily N2O fluxes measured during the
study period.
Emission factors were corrected for background emissions
(Kroeze et al., 1997) using the following:
EF% ¼
N2OðFertÞ À N2OðUnfertÞ
N fertiliser input
 100 (3)
where EF% is the emission factor reported as a percentage of N
fertiliser input (kg N haÀ1
seasonÀ1
) lost as N2O-N, N2O (Fert) and
N2O (Unfert) (kg N haÀ1
seasonÀ1
) are the cumulative N2O-N
emissions measured in the fertilised and unfertilised treatments
with the same cropping history, respectively.
Soil CO2 fluxes, considered a proxy data for estimating soil
respiration rates (inclusive of microbial and roots respiration),
were calculated using only the chambers placed in the inter-row.
Missing daily N2O and CO2 fluxes (due to rare occasional failures of
the measuring system) were estimated with the Amelia II multiple
imputation model (Honaker and King, 2010) using daily values of
soil water-filled pore space (WFPS) (0–10 cm, 10–20 cm and
20–30 cm) and mineral N content (0–30 cm).
2.5. Auxiliary measurements
Chamber air temperature and soil temperature were measured
every 5 min using RTD probes (Temperature Controls Pty Ltd.,
Australia) buried at 10 cm depth near to a chamber. Four Frequency
Domain Reflectometers (FDR, EnviroScan probes, Sentek Technol-
ogies, Australia) measured water dynamics of the soil profile
throughout the field trial. Before the beginning of the experiment
all FDR probes were calibrated for the local soil type following
producer recommendations (Sentek Technologies, 2011). The FDR
probes were deployed at planting and programmed to measure the
volumetric soil water content at three depths (0–10 cm, 10–20 cm,
20–30 cm) at 30 min intervals. Water filled pore space (WFPS) was
calculated using a particle density of 2.79 g cmÀ3
.
Soil chemical properties at the site were determined at
sorghum planting, with soil samples collected from every plot
with a manual open-faced bucket auger (10 cm diameter). Each
plot was sampled at three depths (0–10, 10–20, 20–30 cm) and
then analysed for texture (hydrometer method as described by
Carter and Gregorich, 2007), pH, NH4-N, NO3-N, dissolved organic
C and potentially mineralisable N. Routine soil sampling was then
conducted at regular intervals during the growing season and soil
Table 3
Seasonal N2O average fluxes, cumulative N2O fluxes, N2O intensities (mean Æ SE, n = 3), emission factors and cumulative CO2 fluxes as a function of the four treatments. Means
denoted by a different letter indicate significant differences between treatments (p 0.05).
Measurement Treatment
L0 L70 G0 G100
Average flux (g N2O-N haÀ1
dÀ1
) 0.85 Æ 0.08 a
2.41 Æ 0.82 a
0.94 Æ 0.18 a
5.07 Æ 0.58 b
Cumulative N2O flux (kg N2O-N haÀ1
seasonÀ1
) 0.24 Æ 0.02 a
0.68 Æ 0.23 a
0.27 Æ 0.05 a
1.43 Æ 0.16 b
N2O intensity (kg N2O-N t-yieldÀ1
haÀ1
) 0.09 Æ 0.0 a
0.13 Æ 0.04 a
0.28 Æ 0.05 b
0.28 Æ 0.03 b
Emission factor (%) – 0.63 – 1.17
Cumulative CO2 flux (kg CO2-C haÀ1
seasonÀ1
) 3340.33 3495.97 2922.56 3330.21
30 M. De Antoni Migliorati et al. / Agriculture, Ecosystems and Environment 204 (2015) 27–39
5. samples (0–10,10–20, 20–30 cm) were analysed for NH4-N, NO3-N.
Each soil sample consisted of three subsamples taken at 10 cm
intervals from the crop row of then mixed in order to ensure it
represented the banded and non-banded areas of the plot.
Soil NH4-N and NO3-N were extracted by shaking 20 g soil in
100 ml 1 M KC1 solution at room temperature for 60 min (Carter
and Gregorich, 2007). This solution was then filtered and stored in
a freezer until analysed colorimetrically for NH4-N and NO3-N
using an AQ2+ discrete analyser (SEAL Analytical WI, USA).
Dissolved organic C was extracted at room temperature by shaking
20 g soil in 100 ml of deionised water for 60 min. The suspension
was then centrifuged for 15 min at 10,000 rpm and the supernatant
filtered with a 0.45 mm pore diameter cellulose membrane filter
(based on Scaglia and Adani, 2009). The samples were analysed
using a supercritical water oxidation technique with the Seivers
InnoVox laboratory TOC analyser (General Electric, Boulder, CO,
USA).
Potentially mineralisable N was determined by incubating soil
samples at field capacity at 30
C for 0, 7 and 14 days (Bremner,
1965). The samples were taken on 12 December 2012 sampling
each plot at three depths (0–10, 10–20, 20–30 cm). Mineral-N
formed during the incubation was measured by 2 M KCl extraction
followed by automated colorimetric determination. For each
treatment, the amount of potentially mineralisable N was
calculated as the difference between the mineral N determined
at day 7 and 14 in order to avoid the Birch effect (Birch, 1958).
Total biomass was determined at physiological maturity by
collecting duplicate samples of 1 m of crop row in each plot.
Samples were oven dried at 60
C to determine dry weight before
being weighed and ground for total N content, which was
measured using a C-N analyser after Dumas combustion (LECO
TruMac LECO Corporation, St. Joseph, MI, USA). Grain yield was
measured in each plot by harvesting duplicate 1.8 m wide strips for
the plot length using a plot combine. Grain samples were also dried
at 60
C before quantification of yields on a dry weight basis, while
grain N was determined using a methodology similar to that in
biomass samples.
Fertiliser N recovery in the crop (REfN) was determined applying
15
N-labelled urea in micro-plots (0.9 m  1.5 m) located next to the
measuring chambers. The L70 and G100 treatments received 5%
excess 15
N enriched urea both at planting and at side dressing. The
15
N-labelled urea was dissolved in 1 L of deionised water and
applied as a liquid solution in a sub-surface band, minimising in
this way N losses via runoff and NH3 volatilisation. Plants in the
micro-plots were sampled at crop harvest by collecting above- and
below-ground material. The 15
N analysis was performed using a
20–22 isotope ratio mass spectrometer (Sercon Limited, UK). For
further information on experimental settings and main findings
see De Antoni Migliorati et al. (2014a).
2.6. Statistical analysis
Statistical analyses were performed within the MATLAB 2012a
environment (MathWorks Inc., Natick, MA, US), where the
temporal patterns of daily N2O emissions displayed by the four
treatments were compared using the autoregressive integrated
moving average (ARIMA) model (Box and Pierce, 1970). This model
was fitted to each time series using the following formula:
Dd
Yt ¼ f0 þ f1Dd
YðtÀ1Þ þ . . . þ fpDd
YðtÀpÞ þ at þ u1aðtÀ1Þ
þ . . . þ uqaðtÀqÞ; (4)
where D= (1 À B) are the backshift operators. The roots of the AR
and MA polynomials satisfied the stationarity and invertibility
conditions, respectively. The values of p, d and q were determined
by the Bayesian information criterion (BIC), and the unknown
parameters were estimated by least squares estimators. The
residuals ^at were computed by ^FðBÞ ^QÀ1ðBÞYt, where ^FðBÞ and
^QðBÞ denote the estimates of the autoregressive and moving
average parameters, respectively. The bootstrap residual resam-
pling method was used to evaluate the variation, while prediction
intervals were constructed using the percentile method.
A mixed-design analysis of variance (ANOVA) was performed to
determine the influence of fertilisation rate or cropping history on
N2O emissions and grain yields. The Bonferroni post hoc test was
used to compare average and cumulative N2O emissions, N2O
intensities, grain yields, above ground biomass productions and
harvest indexes.
As with the method used for the calculation of daily N2O fluxes,
standard errors of average and cumulative N2O emissions and N2O
intensities were calculated by assigning different weights to the
chamber in the inter-row (0.5) and over the rows (0.25).
[(Fig._1)TD$FIG]
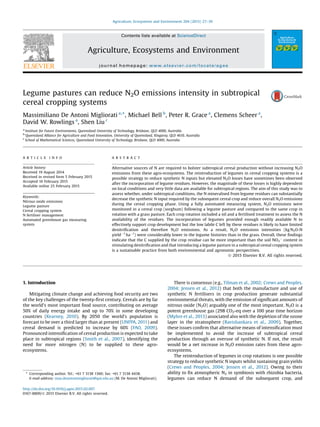
Fig. 1. Minimum and maximum daily air temperatures, soil temperatures (0–30 cm), rainfall and irrigation events at Kingaroy (Queensland, Australia) during the sorghum
season.
M. De Antoni Migliorati et al. / Agriculture, Ecosystems and Environment 204 (2015) 27–39 31
6. 3. Results
3.1. Environmental conditions
Over the study period (12 December 2012–19 September 2013)
a total of 827 mm of rain fell at the study site, including one heavy
rainfall event of 234 mm during a thunderstorm on 27 January
2013. While this total corresponded to 148% of the growing season
mean for the 108-year period between 1905 and 2013, it is
noteworthy that over 70% of the total rainfall was concentrated
between 25 January and 3 March (Fig.1). The mean air temperature
was 17.9
C, with the maximum (38.0
C) and minimum (À4.4
C)
hourly air temperatures recorded in January and August 2013,
respectively. Average soil (0–10 cm) temperatures ranged from a
maximum of 29.7
C (December 2012) to a minimum of 11.9
C
(May 2013).
3.2. Seasonal variability of soil conditions
The WFPS of the topsoil (0–30 cm) varied in response to rainfall,
irrigation events and crop growth. At the beginning of the season
WFPS values fluctuated between 36% and 47% due to the rapid crop
development and irrigation events (Fig. 2). WFPS ranged from 40%
to 66%, with highest values measured between late January and
mid-March as a consequence of the intense rainfall events that
occurred during this period. After March average WFPS values
started gradually to decrease as a result of the declined rainfall
regime.
In the 0–30 cm sampling zone, NH4
+
-N was the dominant form
of soil mineral N. With the possible exception of the sampling
event at sowing, no consistent response to history or fertiliser
application was observed (Fig. 3a). At sorghum planting, NH4
+
-N
contents in the top 30 cm averaged 40 kg N haÀ1
and then stabilised
between 16 and 33 kg N haÀ1
for the remainder of the season.
Limited response to history or N fertiliser application was observed
also in soil NO3
À
-N contents (Fig. 3b), with the exception of the
first month of the growing season. At this stage the legume
histories (L0 and L70) showed higher NO3
À
-N contents than the
grass history equivalents, although differences were lower than
20 kg N/ha.
At the beginning of the sorghum season dissolved organic
carbon contents in the grass history tended to be higher than in the
legume. Slightly higher potentially mineralisable N values were
observed in the legume history treatments compared to the grass
(Table 1).
3.3. N2 emissions
N2O emissions varied temporally and spatially in response to N
fertilisation rate and cropping history. In all treatments significant
N2O losses occurred between mid-December 2012 and mid-March
2013, when soil mineral N contents and WFPS values were higher
[(Fig._2)TD$FIG]
Fig. 2. Daily soil N2O fluxes and water-filled pore space (WFPS, 0–30 cm) for the four treatments during the sorghum season in Kingaroy (Queensland, Australia). Arrows
indicate the timing of N fertiliser applications.
[(Fig._3)TD$FIG]
Fig. 3. Soil ammonium (a) and nitrate (b) contents (0–30 cm) for the four
treatments during the sorghum seasons in Kingaroy (Queensland, Australia).
Arrows indicate the timing of N fertiliser applications.
32 M. De Antoni Migliorati et al. / Agriculture, Ecosystems and Environment 204 (2015) 27–39
7. than in the remainder of the study period (Fig. 2). During this
period N2O emissions increased shortly after rain or irrigation
events. This trend was particularly evident in the G0 and
G100 treatments, where N2O emission rates increased more
abruptly than in L0 and L70 (Fig. 2).
In all except G0 treatments, the highest emission pulse was
observed after the rainfall event on 27 January, when a total of
234 mm rainfall fell over 24 h. During this event N2O emissions in
treatments L70 and G100 were up to 4 and 6 fold those of the
unfertilised treatments, respectively. After this event, N2O
emission in all treatments progressively declined to background
levels, with the only exception being G100, where a substantial
N2O emission pulse was measured after another 260 mm rainfall
fell at the field site between 19 February and 3 March (Fig. 2). After
mid-March daily N2O fluxes in all treatments never exceeded 1 g N
haÀ1
dayÀ1
despite several rain events. Emissions did not increase
[(Fig._4)TD$FIG]
Fig. 4. 95% confidence intervals of N2O fluxes in the different treatments during the period of highest emissions (December 2012–March 2013) in Kingaroy (Queensland,
Australia). Confidence intervals are displayed using different scales. Arrows indicate the timing of N fertiliser applications.
M. De Antoni Migliorati et al. / Agriculture, Ecosystems and Environment 204 (2015) 27–39 33
8. even after the two irrigation events on 27 and 29 August 2013 or
the two cultivation events on 6 August and 19 September 2013.
During the period of highest emissions (December 2012 to
March 2013) the ARIMA model highlighted significant treat-
ment effects on the temporal pattern of N2O emissions. Before
side dressing, the two N2O emission pulses measured in
G100 and G0 significantly exceeded those in L70 and L0,
respectively (Fig. 4a and b). After side dressing the emission
pulse in G100 was significantly higher than that in L70, while
no substantial differences were observed between G0 and L0
(Fig. 4c and d).
The chamber placement highlighted two different patterns in
the spatial variability of N2O flux rates during the period of high
emissions. In the two unfertilised treatments and in G100, N2O
fluxes from the crop row (inclusive of the banded fertiliser) did not
differ significantly from those from the inter-row (Fig. 5b–d). In the
[(Fig._5)TD$FIG]
Fig. 5. Daily soil N2O fluxes measured in the row (R) and inter-row (IR) chambers for the L70 (a), L0 (b), G100 (c) and G0 (d) treatments during the period of highest emissions
(December 2012–March 2013) in Kingaroy (Queensland, Australia). Arrows indicate the timing of N fertiliser applications. Graphs are in different scales.
34 M. De Antoni Migliorati et al. / Agriculture, Ecosystems and Environment 204 (2015) 27–39
9. L70 treatment instead, average N2O emissions measured in the
crop row exceeded those in the inter-row by a factor of 6 (Fig. 5a).
Only the N2O cumulative losses measured in G100 were
significantly higher (p 0.05) than those of the other treatments.
Cumulative losses in L70 did not display significant differences
compared to the unfertilised treatments (Table 3).
The mixed-design ANOVA analysis indicated that the main
effect regulating N2O emissions was the N fertiliser rate, while the
cropping history per se had no significant effect on measured N2O
losses (Table 4).
3.4. CO2 emissions
Soil CO2 fluxes showed little variation between treatments and
exhibited a temporal pattern influenced by soil temperatures and
WFPS (Fig. 6). Average soil CO2 emissions peaked during the
warmest months (early January to late March 2013, average of
23 kg CO2-C haÀ1
dayÀ1
) before decreasing to 10 kg CO2-C
haÀ1
dayÀ1
during the colder and drier period from April to late
August 2013.During the fallow period CO2 fluxes remained below
5 kg CO2-C haÀ1
dayÀ1
. Emissions in all treatments did not increase
after the tillage event of 6 August 2013 but rose to an average of
17 kg CO2-C haÀ1
dayÀ1
after the two irrigation events of 27 and
29 August.
In contrast to N2O emissions, CO2 fluxes tended to not to rise
until several days after a rainfall/irrigation event. This was
particularly evident with the rainstorm on 27 January, when
CO2 emission did not start to increase until seven days after the
event. Overall, cumulative CO2 emissions measured in the inter-
rows showed little variations between treatments (Table 3) and no
significant differences in the pattern of daily CO2 emissions was
detected by the ARIMA model.
3.5. Crop biomass, grain production and N uptake
Sorghum biomass production and yield were substantially
affected by cropping history and N fertiliser rate. Both biomass and
yield in the unfertilised sorghum following the legume ley pasture
(L0) were significantly higher (p 0.05) than those in the
corresponding treatment following the grass ley pasture (G0).
Grain and biomass production in L70 were comparable to those in
G100 and both were significantly higher than those in the
unfertilised treatments (Table 5). The harvest index (kg grain
haÀ1
/kg total biomass haÀ1
) of L0 was significantly higher than in
G0, but comparable to that of both L70 and G100.
The mixed-design ANOVA analysis showed that both the N
fertiliser rate and the cropping history had significant effects on
grain yield. However, the cropping history F value was substantially
lower than that of the fertiliser rate, indicating that the fertiliser
rate had greater influence on yields (Table 4).
Soil N availability in the legume cropping history was higher
than in the grass one and N uptake values measured in L0 and
L70 exceeded those of G0 and G100, respectively. Though the N
fertiliser rate in G100 was 30 kg N haÀ1
higher than in L70, the
fraction of fertiliser N taken by the crop was greater in L70,
exhibiting a significantly higher REfN compared to G100 (Table 5).
4. Discussion
4.1. N2 emissions from cropped soils after termination of a pasture
phase
To date little research has been undertaken on N2O emissions
following the termination of ley pastures, specifically in terms of
how management, subtropical climatic conditions and chemical
composition of the residues influence N2O losses during
Table 4
Significance of treatment effect (applied fertiliser rate and cropping history) on N2O
emissions and grain yields during the sorghum season.
Measurement Factor p-value F statistics
N2O Fertiliser rate **
17.37
Cropping history NS 2.68
Grain yield Fertiliser rate ***
255.79
Cropping history **
14.41
NS: not significant.
**
Probability significant at 0.01 level.
***
Probability significant at 0.001 level.
[(Fig._6)TD$FIG]
Fig. 6. Daily soil CO2 fluxes and water-filled pore space (WFPS, 0–30 cm) for the four treatments during the sorghum season in Kingaroy (Queensland, Australia). Arrows
indicate the timing of N fertiliser applications.
M. De Antoni Migliorati et al. / Agriculture, Ecosystems and Environment 204 (2015) 27–39 35
10. subsequent cropping seasons. This is the first study to investigate
the role of these factors in two subtropical ley pasture–cereal crop
rotations using a fully automated measuring system providing high
temporal resolution data on N2O emissions.
In a review on the role of legumes in mitigating greenhouse gas
emissions from agriculture, Jensen et al. (2012) concluded there is
a risk of elevated N2O emissions after the incorporation of legume
residues. However, many of the cited studies referred to the
incorporation of grain legume residues, while little is reported
about incorporation of legume pasture residues. Legume pasture
residues have lower C:N ratio than the senesced vegetative stubble
that typically remains after grain harvest of legume crops (Kumar
and Goh, 1999; Fillery, 2001; Peoples et al., 2009). The decompo-
sition of legume pasture residues can therefore provide a source of
easily decomposable N, leading to higher N2O losses compared to
grain legume residues.
The outcomes of the few studies conducted on incorporation of
legume pasture residues are however contradictory. Extremely
high N2O emissions following the plough-down of an alfalfa
pasture were measured in winter and early spring in Canada by
Wagner-Riddle et al. (1997), who reported a total loss of 5.38 kg
N2O-N haÀ1
over a seven-month period. Significantly, in the same
experiment high emissions (2.84 kg N2O-N haÀ1
) were observed
also in the control treatment, where no incorporation of alfalfa
residues was implemented. Similar amounts of N2O emissions
were reported in another Canadian study by Wagner-Riddle and
Thurtell (1998), where 2.63 and 3.79 kg N2O-N haÀ1
were emitted
during freezing and thawing periods by a bare soil and a soil after
the incorporation of alfalfa residues, respectively. Substantial N2O
emission rates (up to 45 g N2O-N haÀ1
dayÀ1
) lasted for over two
months after the plough-down of a clover pasture in early spring in
Scotland (Pappa et al., 2011).
In contrast, limited N2O emissions following the incorporation
of legume pastures were reported in temperate climates by
Brozyna et al. (2013) (approximately 0.25 kg N2O-N haÀ1
) and
Baggs et al. (2000) (0.24 kg N2O-N haÀ1
) and, in a subtropical a
climate, by Gomes et al. (2009) (0.36 kg N2O-N haÀ1
). Under
Mediterranean climatic conditions Sanz-Cobena et al. (2014)
observed no significant differences in N2O emissions from maize
following a vetch pasture (Vicia villosa) or a fallow period.
In the present study, N2O losses from the unfertilised sorghum
following the legume ley pasture (L0) were similar to those reported
by Brozyna et al. (2013) and Baggs et al. (2000), and did not differ
significantly from those measured in the unfertilised sorghum
following the grass ley pasture (G0). These findings indicate that the
incorporation of legume residues per se is not sufficient to trigger
elevated N2O emissions. Conversely, enhanced N2O emissions
appear to be the product of several concurrent factors.
4.2. Factors influencing N2 emissions and yields
In this study cumulative N2O emissions were primarily a
function of the N fertiliser rate applied, while cropping history had
no significant effect. On the other hand, crop biomass and grain
production showed a clear response to increased N availability in
the legume history, irrespective of the N fertiliser input. While
incorporation of legume residues provided an additional 20–22 kg
N haÀ1
to the sorghum crop in both L0 and L70 compared to G0 and
G100, this additional N release did not significantly enhance the
nitrification or denitrification processed compared to the incorpo-
ration of grass residues. Moreover, the temporal pattern of daily
N2O emissions was substantially affected by the cropping history
and in the first 10 weeks after sorghum establishment N2O
emissions pulses in G0 and G100 were significantly higher than in
L0 and L70, respectively.
We propose that this apparent contradiction can be explained
by considering three interacting factors: the fertiliser N rate
applied, the cropping history and the synchrony between soil N
availability and crop N uptake.
4.2.1. Fertilisation rates
The application of synthetic N fertiliser was the main factor
responsible for enhanced N2O emissions and the highest cumulative
N2O losses were measured in the two fertilised treatments. In
L70 and G100 the highest N2O emission rates were observed after
side dressing, when the majority of the N fertiliser was applied and
WFPS exceeded 60% (Fig. 2). The abrupt emission pulses after
fertilisation can be explained by considering the release dynamics of
synthetic fertilisers (Crews and Peoples, 2005). Under humid soil
conditions urea is rapidly hydrolysed, leading to a fast release of high
amounts of mineral N in the soil. At side dressing sorghum plants
were still at an early stage of physiological development and were
able to take up only a fraction of the mineral N applied. Therefore
significantamountsofmineralNaccumulatedinthesoilandbecame
available to nitrifying and denitrifying microorganisms. Indeed,
sufficient surplus N must have still beenpresentin the highest N rate
treatment (G100), where a secondary emission pulse was observed
between mid-February and mid-March, one month after side
dressing.
Increased N2O emissions following the fertilisation events in
this study did not correspond to elevated soil mineral N contents in
the first 30 cm, due probably to the large rainfall event that fell over
the trial shortly after side dressing. After this rain event a large
fraction of the applied N is likely to have leached deeper into the
soil profile, leaving little mineral N in the first 30 cm to be detected
at the following sampling events (Fig. 3).
Overall, N2O emissions displayed a significant correlation with
N fertilisation, rising in nonlinear patterns at increasing N fertiliser
rates (0, 70 and 100 kg N haÀ1
). As observed by several authors
(McSwiney and Robertson, 2005; Hoben et al., 2011; Shcherbak
et al., 2014), the fast release of mineral N after fertilisation can
exceed the plant uptake capability when N fertiliser is applied at
high rates and the resulting temporary surplus of mineral N can
promote elevated nitrification and denitrification rates if the
appropriate soil water conditions are met. These findings indicate
that the best fertiliser management practices aimed at reducing
N2O losses coincide with those designed to achieve high levels of
agronomic efficiency. N rates and fertilisation techniques should
Table 5
Sorghum grain yield (expressed as dry weight), above ground biomass (expressed as dry weight), harvest index, total N uptake (mean Æ SE, n = 3) and recovery efficiency of
fertiliser N in the crop (REfN) as a function of the four treatments. Means denoted by a different letter indicate significant differences between treatments (p 0.05).
Measurement Treatment
L0 L70 G0 G100
Grain yield (t haÀ1
) 2.52 Æ 0.22 b
5.29 Æ 0.22 c
0.94 Æ 0.12 a
5.20 Æ 0.11 c
Above ground biomass (t haÀ1
) 8.38 Æ 0.78 b
14.96 Æ 0.73 c
4.48 Æ 0.34 a
13.68 Æ 0.53 c
Harvest index 0.31 Æ 0.02 b
0.36 Æ 0.01 bc
0.21 Æ 0.03 a
0.38 Æ 0.01 c
Total N uptake (kg N haÀ1
) 46.91 Æ 4.77 118.94 Æ 7.98 25.11 Æ 1.53 98.52 Æ 6.88
REfN (%) – 70.9 Æ 2.1 52.8 Æ 6.1*
*
Probability significant at 0.01 level.
36 M. De Antoni Migliorati et al. / Agriculture, Ecosystems and Environment 204 (2015) 27–39
11. therefore be aimed at maximizing the crop uptake of applied
synthetic N.
4.2.2. Cropping history
Although it did not have a statistically significant effect on
cumulative N2O emissions, the cropping history substantially
influenced the temporal and spatial patterns of N2O fluxes. In the
first part of the season for example, daily N2O fluxes in G100 and
G0 tended to rise immediately after rain events and on these
occasions emissions were consistently higher than in L70 and L0,
respectively (Fig. 4a, b). Moreover, the grass cropping history
treatments constituted a more diffused source of N2O emissions,
with G100 and G0 displaying high N2O losses also from the inter-
row, while N2O fluxes from the inter-row in L70 and L0 never
exceeded 12 g N haÀ1
dayÀ1
(Fig. 5).
It is here hypothesized that the sharp increases of N2O
emissions following increments in WFPS, as well as the high
fluxes measured across the whole field in G100 and G0, are to be
attributed to higher labile C in the soil of the grass cropping history.
Enhanced N2O emissions from soils with high DOC contents have
been reported by numerous studies (Elmi et al., 2003; Yao et al.,
2009; Barton et al., 2011). This positive correlation originates from
the coupled biogeochemical cycles of C and N. The degradation of
plant material provides soil microbes with substantial amounts of
C, which under anaerobic conditions is oxidized by denitrifying
microorganisms via reducing NO3
À
to N2O (Conrad, 1996).
The DOC values observed at the beginning of the sorghum season
tended to be higher in the treatments following the termination of
thegrasspasture,whereasubstantiallyhigheramountoffinefibrous
plant residues was present at sorghum planting. Whilst not
quantitatively documented, the presence of undecomposed roots
andcrownsinthegrasshistorywouldhavecontinuedtosupplement
the labile C pool. This would have provided a uniformly distributed C
source to support microbial activity and therefore the potential for
denitrification in both row and inter-row areas (Fig. 5). While this
enhanced potential microbial activity in G0 became increasingly N-
limited by the end of December, the provision of the N side dressing
in G100 allowed that activity to continue. When combined with the
verywetsoilconditions,thishighnutrientavailabilityresultedinthe
significant N2O emissions pulses observed in G100 from late January
(Fig. 4).
Conversely, the low C:N ratio of the sulla plants residues would
likely have contributed to a more rapid degradation of residues in
the L0 and L70 treatments, leaving less labile C to support
continued microbial activity. This may have changed during the
season in the vicinity of the sorghum rows, where increasing root
density would have contributed to labile C stores. The marked
contrast in N2O emissions between the rows and inter-rows in both
L0 and L70 (Fig. 5) are consistent with this hypothesis. Similar
results to this study were reported by Sanz-Cobena et al. (2014),
who observed higher N2O emissions from maize after the
incorporation of barley compared to the same crop after the
incorporation of a vetch pasture.
In contrast with N2O emissions and DOC values at the beginning
of the experiment, CO2 emissions did not show significant
differences between treatments in terms of cumulative emissions
or temporal patterns. The two reasons were probably the low soil
moisture content at the beginning of the sorghum season and the
relatively high respiration rate of sorghum roots in the later stages
of the experiment. The early stages of the sorghum season
(December 2012–mid-January 2013) experienced relatively dry
conditions, with dry surface soil probably limiting microbial
activity. From mid-January onward the trial received a substantial
amount of rain, but by that stage the roots of the sorghum plants
would have expanded into the inter-row, possibly overriding the
relatively low rates of background soil microbial respiration.
Although the relatively low labile C content of soils with the
legume cropping history would have limited the activity of the soil
microbial pool, the legumes were able to provide a significant
enhancement of the soil labile N pool. While the initial mineral N
contents in the top 30 cm of the profile were quantitatively similar
between the legume and grass histories (Fig. 3), there was a higher
proportion of that N in the form of NO3-N in the legume (33%) than
the grass (20%) histories. This data, combined with the increases in
PMN (Table 1), suggest greater mineralisable N reserves in the
legume histories which is also reflected in sorghum growth, grain
yield and N accumulation. Moreover, while the N supply from the
residue mineralisation was not substantial in G100 and G0, the
heavy rain events in January are likely to have promoted
substantial N2 losses (Schwenke et al., 2013), further reducing
the N supply to the plants of these treatments. The high N losses via
leaching would have severely limited the efficiency of the side
dressing, resulting therefore in the lower REfN values measured in
G100 compared to L70. As a consequence, crop biomass and grain
yields in L70 were comparable to those of G100 despite a 30%
reduction in fertiliser rate, while yields in L0 were approximately
double those in G0.
These findings highlight the importance of the soil labile C pool
in regulating N2O losses. Specifically, denitrifying microorganisms
can be more competitive than plants in using even small amounts
of NO3
À
when soil labile C content is sufficiently high to sustain
elevated microbial activity in anaerobic conditions. This was
evident in the unfertilised treatments, where dry matter and grain
yield in G0 were severely limited by N availability but N2O
emissions were almost identical. Under these circumstances the
amount and chemical availability of C supplied by the crop residue
can be more important than the soil NO3
À
content in stimulating
denitrification.
4.2.3. Synchrony of N supply
Synchrony is a critical aspect in reducing N2O losses after the
termination of a legume pasture (Crews and Peoples, 2005; Jensen
et al., 2012), which means matching the N release resulting from
the degradation of the legume residues with the N uptake of the
subsequent crop. The high emissions reported after the termina-
tion of a legume pasture are often measured when the field site has
been left fallow for long periods (Wagner-Riddle et al., 1997;
Wagner-Riddle and Thurtell, 1998; Pappa et al., 2011). Conditions
can be highly conducive for elevated N2O emissions when a soil is
left fallow after the incorporation of fresh legume residues since in
the absence of a crop following the pasture, all the readily
mineralisable C from the legume residues becomes available to
support the denitrification of large amounts of NO3
À
accumulated
in the soil.
In this study sorghum was planted 13 days after the termination
of the pasture phase. During the fallow prior to sorghum planting
only 6 mm of rainfall had fallen, limiting therefore the possibility of
organic matter decomposition, mineral N accumulation or
generation of significant N2O emissions. Typically, the highest N
mineralisation rates from legume residues are reported to occur
after about six weeks from the termination of the pasture (Fox
et al., 1990; Becker and Ladha, 1997; Robertson, 1997; Park et al.,
2010). In the present study this would have coincided with the
moment of maximum N uptake of sorghum, supplying in this way
approximately an extra 20–22 kg N haÀ1
to the plants in L70 and L0.
The good synchrony between N release from the legume residues
and N uptake of the sorghum plant is confirmed by the high REfN
measured in L70 (Table 5).
Overall, planting sorghum shortly after pasture termination
proved an effective strategy to reduce N2O losses due to the
decomposition of legume residues. This practice also resulted
successful in supplying an extra source of N to sorghum, increasing
M. De Antoni Migliorati et al. / Agriculture, Ecosystems and Environment 204 (2015) 27–39 37
12. significantly the yields in both the fertilised (L70) and unfertilised
(L0) treatments.
5. Implications for managing N2 emissions from a crop
following a legume pasture
Introducing a legume ley pasture in a cereal-based cropping
system enabled the reduction of the synthetic N fertiliser applied
to the following cereal crop and significantly reduced the N2O
emission factor for this crop compared to a grass ley pasture. The
emission factor of L70 (0.63%) was almost half of G100 (1.17%) and
was considerably lower than the 1% recommended by the IPCC
methodology for fertilised cropping systems (De Klein et al., 2006).
Both Tier 1 and Tier 2 approaches consider an emission factor of 1%
for N derived from the mineralisation of crop residues. According
to this method, in L70 the total N2O emissions resulting from the
mineralisation of approximately 30 kg N haÀ1
contained in the
legume residues and combined with the application of 70 kg
N haÀ1
would have amounted to about 1 kg N2O-N haÀ1
. Similarly,
N2O losses from the two unfertilised treatments should have
differed substantially, resulting in 0.3 and 0.1 kg N2O-N haÀ1
from
L0 and G0, respectively. However, the different dynamics observed
in this study suggest that the amount of N in the soil per se is not
sufficient to correctly estimate N2O emission factors, and that the
quantity and availability of soil C should also be considered.
The importance of soil labile C is reinforced when the N2O
emissions intensity (kg N2O-N yieldÀ1
haÀ1
) of the legume and
grass cropping histories are considered. This measure effectively
quantifies the efficiency of agronomic practices in maximizing
grain yields while minimizing N2O emissions. Despite the broad
range of grain yields, N2O emissions intensities were consistent
among treatments with the same cropping history, with intensities
significantly lower in the legume compared to the grass history
(Table 3).
The introduction of a legume pasture phase in a cereal-based
crop rotation seems to offer multiple environmental and
agronomic advantages. In the fertilised treatments it resulted in
a 50% reduction of the N2O-N emitted compared to introducing a
grass pasture, proving to be an effective mitigation strategy to
reduce the contribution of cereal cropping systems to greenhouse
gas emissions. A pasture phase can also contribute to increasing
the soil organic matter, aggregate stability, soil microbial pool and
organic N content (Giller and Cadisch,1995; Rochester et al., 2001),
benefiting the overall soil chemical and physical fertility. These
results overall indicate that introducing a legume pasture in a
subtropical cereal cropping system is a sustainable practice from
both the environmental and agronomic perspective.
Acknowledgements
The authors would like to thank Gary Harch for his valuable
support during the monitoring campaign and the Queensland
Department of Agriculture, Fisheries and Forestry (QDAFF) for
providing the field site, the machinery and the staff for the farming
operations. The authors also appreciate the contribution of Dr
Philip Moody and Mitchell De Bruyn for their assistance in the
chemical analyses. This research was conducted as part of the
National Agricultural Nitrous Oxide Research Program (NANORP)
funded by the Federal Department of Agriculture and the
Australian Grains Research and Development Corporation (GRDC).
References
Australian Bureau of Meteorology, http://www.bom.gov.au/ 2015.
Baggs, E.M., Rees, R.M., Smith, K.A., Vinten, A.J.A., 2000. Nitrous oxide emission from
soils after incorporating crop residues. Soil Use Manage. 16, 82–87.
Barton, L., Butterbach-Bahl, K., Kiese, R., Murphy, D.V., 2011. Nitrous oxide fluxes
from a grain–legume crop (narrow-leafed lupin) grown in a semiarid climate.
Global Change Biol. 17, 1153–1166.
Barton, L., Kiese, R., Gatter, D., Butterbach-Bahl Klaus, B., Renee Hinz, C., Murphy, D.
V., 2008. Nitrous oxide emissions from a cropped soil in a semi-arid climate.
Global Change Biol. 14, 177–192.
Becker, M., Ladha, J., 1997. Synchronizing residue N mineralization with rice N
demand in flooded conditions. Driven by nature: plant litter quality and
decomposition 1997.
Bell, M., Harch, G., Moody, P., 2012. Diversification from cropping into mixed crop-
livestock systems – the sustainability risks posed by hay removal from pasture
or forage blocks. Red 18, 75.
Birch, H.F., 1958. The effect of soil drying on humus decomposition and nitrogen
availability. Plant Soil 10, 9–31.
Boox, G.E.P., Pierce, D.A., 1970. Distribution of residual autocorrelations in
autoregressive-integrated moving average time series models. J. Am. Stat.
Assoc. 65, 1509–1526.
Bremner, J.M.,1965. Nitrogen availability indexes. In: Norman, A.G. (Ed.), Methods of
Soil Analysis. Part 2. Chemical and Microbiological Properties. American Society
of Agronomy, Soil Science Society of America, pp. 1324–1345.
Brozyna, M.A., Petersen, S.O., Chirinda, N., Olesen, J.E., 2013. Effects of grass-clover
management and cover crops on nitrogen cycling and nitrous oxide emissions
in a stockless organic crop rotation. Agric. Ecosyst. Environ. 181, 115–126.
Carter, M.R., Gregorich, E.G., 2007. Soil Sampling and Methods of Analysis, Second
ed. CRC Press.
Conrad, R., 1996. Soil microorganisms as controllers of atmospheric trace gases (H2,
CO, CH4, OCS, N2O, and NO). Microbiol. Rev. 60, 609–640.
Crews, T.E., Peoples, M.B., 2004. Legume versus fertilizer sources of nitrogen:
ecological tradeoffs and human needs. Agric. Ecosyst. Environ. 102, 279–297.
Crews, T.E., Peoples, M.B., 2005. Can the synchrony of nitrogen supply and crop
demand be improved in legume and fertilizer-based agroecosystems? A review.
Nutr. Cycl. Agroecosyst. 72, 101–120.
De Antoni Migliorati, M., Bell, M., Grace, P., Rowlings, D., Scheer, C., Strazzabosco, A.,
2014a. Assessing agronomic and environmental implications of different N
fertilisation strategies in subtropical grain cropping systems on Oxisols. Nutr.
Cycl. Agroecosyst. 100, 369–382.
De Antoni Migliorati, M., Scheer, C., Grace, P.R., Rowlings, D.W., Bell, M., McGree, J.,
2014b. Influence of different nitrogen rates and DMPP nitrification inhibitor on
annual N2O emissions from a subtropical wheat–maize cropping system.
Agriculture. Ecosyst. Environ. 186, 33–43.
De Klein, C., Novoa, R.S.A., Ogle, S., Smith, K.A., Rochette, P., Wirth, T.W., 2006. N2O
emissions from managed soils, and CO2 emissions from lime and urea
application. In: Eggleston, H.S., Buendia, L., Miwa, K., Ngara, T., Tanabe, K. (Eds.),
IPCC Guidelines for National Greenhouse Gas Inventories, Volume 4,
Agriculture, Forestry and Other Land Use. IGES, Japan.
Drury, C.F., Yang, X.M., Reynolds, W.D., McLaughlin, N.B., 2008. Nitrous oxide and
carbon dioxide emissions from monoculture and rotational cropping of corn,
soybean and winter wheat. Can. J. Soil Sci. 88, 163–174.
Elmi, A.A., Madramootoo, C., Hamel, C., Liu, A., 2003. Denitrification and nitrous
oxide to nitrous oxide plus dinitrogen ratios in the soil profile under three tillage
systems. Biol. Fertil. Soils 38, 340–348.
World reference base for soil resources. World soil resources reports 84, 21–22.
FAO, 2009. How to feed the World in 2050. Proceedings of the Expert Meeting on
How to Feed the World in 2050, 24–26 FAO Headquarters, Rome June 2009.
Fillery, I.R.P., 2001. The fate of biologically fixed nitrogen in legume-based dryland
farming systems: a review. Anim. Prod. Sci. 41, 361–381.
Fox, R.H., Myers, R.J.K., Vallis, I., 1990. The nitrogen mineralization rate of legume
residues in soil as influenced by their polyphenol, lignin, and nitrogen contents.
Plant Soil 129, 251–259.
Giller, K.E., Cadisch, G., 1995. Future benefits from biological nitrogen fixation: an
ecological approach to agriculture. Plant Soil 174, 255–277.
Gomes, J., Bayer, C., de Souza Costa, F., de Cássia Piccolo, M., Zanatta, J.A., Vieira, F.C.
B., Six, J., 2009. Soil nitrous oxide emissions in long-term cover crops-based
rotations under subtropical climate. Soil Till. Res. 106, 36–44.
Granli, T., Bøckman, O.C., 1995. Nitrous oxide (N2O) emissions from soils in warm
climates. Nutr. Cycl. Agroecosyst. 42, 159–163.
Halvorson, A.D., Del Grosso, S.J., Reule, C.A., 2008. Nitrogen, tillage, and crop rotation
effects on nitrous oxide emissions from irrigated cropping systems. J. Environ.
Qual. 37, 1337–1344.
Hoben, J.P., Gehl, R.J., Millar, N., Grace, P.R., Robertson, G.P., 2011. Nonlinear nitrous
oxide (N2O) response to nitrogen fertilizer in on-farm corn crops of the US
Midwest. Global Change Biol. 17, 1140–1152.
Honaker, J., King, G., 2010. What to do about missing values in time-series cross-
section data. Am. J. Political Sci. 54, 561–581.
Hu, X.-K., Su, F., Ju, X.-T., Gao, B., Oenema, O., Christie, P., Huang, B.-X., Jiang, R.-F.,
Zhang, F.-S., 2013. Greenhouse gas emissions from a wheat–maize double
cropping system with different nitrogen fertilization regimes. Environ. Pollut.
176, 198–207.
Jensen, E., Peoples, M., Boddey, R., Gresshoff, P., Hauggaard-Nielsen, H., Alves, B.,
Morrison, M., 2012. Legumes for mitigation of climate change and the provision
of feedstock for biofuels and biorefineries. A Rev. Agron. Sustain. Dev. 32,
329–364.
Kearney, J., 2010. Food consumption trends and drivers. Philos. Trans. R. Soc. B: Biol.
Sci. 365, 2793–2807.
Kroeze, C., Mosier, A.R., Nevison, C., Oenema, O., Seitzinger, S., van Cleemput, O.,
1997. Agriculture .
38 M. De Antoni Migliorati et al. / Agriculture, Ecosystems and Environment 204 (2015) 27–39
13. Kusa, K., Hu, R., Sawamoto, T., Hatano, R., 2006. Three years of nitrous oxide and
nitric oxide emissions from silandic andosols cultivated with maize in
Hokkaido, Japan. Soil Sci. Plant Nutr. 52, 103–113.
McSwiney, C.P., Robertson, G.P., 2005. Nonlinear response of N2O flux to incremental
fertilizer addition in a continuous maize (Zea mays L.) cropping system. Global
Change Biol. 11, 1712–1719.
Mosier, A.R., Wassmann, R., Verchot, L., King, J., Palm, C., 2004. Methane and
nitrogen oxide fluxes in tropical agricultural soils: sources sinks and
mechanisms. Environ. Dev. Sustain. 6, 11–49.
Myhre, G., Shindell, D., Bréon, F.-M., Collins, W., Fuglestvedt, J., Huang, J., Koch, D.,
Lamarque, J.-F., Lee, D., Mendoza, B., Nakajima, T., Robock, A., Stephens, G.T.T.,
Zhang, H., 2013. Anthropogenic and natural radiative forcing. Climate Change
2013. In: Stocker, T.F., Qin, T.F.D., Plattner, G.-K., Tignor, M., Allen, S.K., Boschung,
J., Nauels, A., Xia, Y., Bex, V., Midgley, P.M. (Eds.), The Physical Science Basis.
Contribution of Working Group I to the Fifth Assessment Report of the
Intergovernmental Panel on Climate Change. Cambridge University Press,
Cambridge, United Kingdom and New York, NY, USA.
Pappa, V.A., Rees, R.M., Walker, R.L., Baddeley, J.A., Watson, C.A., 2011. Nitrous oxide
emissions and nitrate leaching in an arable rotation resulting from the presence
of an intercrop. Agriculture. Ecosyst. Environ. 141, 153–161.
Park, S.E., Webster, T.J., Horan, H.L., James, A.T., Thorburn, P.J., 2010. A legume
rotation crop lessens the need for nitrogen fertiliser throughout the sugarcane
cropping cycle. Field Crops Res. 119, 331–341.
Parkin, T.B., Kaspar, T.C., 2006. Nitrous oxide emissions from corn–soybean systems
in the Midwest. J. Environ. Qual. 35, 1496–1506.
Parkin, T.B., Venterea, R.T., Hargreaves, S.K., 2012. Calculating the detection limits of
chamber-based soil greenhouse gas flux measurements. J. Environ. Qual. 41,
705–715.
Peoples, M.B., Hauggaard-Nielsen, H., Jensen, E.S., 2009. The potential
environmental benefits and risks derived from legumes in rotations. Agron.
Monogr. 52, 349–385.
Ravishankara, A., Daniel, J.S., Portmann, R.W., 2009. Nitrous oxide (N2O): the
dominant ozone-depleting substance emitted in the 21st century. Science 326,
123–125.
Robertson, G.P., 1997. Nitrogen use efficiency in row-crop agriculture: crop nitrogen
use and soil nitrogen loss. Ecol. Agric. 347–365.
Robertson, G.P., Paul, E.A., Harwood, R.R., 2000. Greenhouse gases in intensive
agriculture: contributions of individual gases to the radiative forcing of the
atmosphere. Science 289, 1922–1925.
Rochester, I.J., Peoples, M.B., Hulugalle, N.R., Gault, R.R., Constable, G.A., 2001. Using
legumes to enhance nitrogen fertility and improve soil condition in cotton
cropping systems. Field Crops Res. 70, 27–41.
Rochette, P., Angers, D.A., Bélanger, G., Chantigny, M.H., Prévost, D., Lévesque, G.,
2004. Emissions of N2O from alfalfa and soybean crops in Eastern Canada. Soil
Sci. Soc. Am. J. 68, 493–506.
Sanz-Cobena, A., García-Marco, S., Quemada, M., Gabriel, J.L., Almendros, P., Vallejo,
A., 2014. Do cover crops enhance N2O, CO2 or CH4 emissions from soil in
Mediterranean arable systems? Sci. Total Environ. 466-467, 164–174.
Scaglia, B., Adani, F., 2009. Biodegradability of soil water soluble organic carbon
extracted from seven different soils. J. Environ. Sci. 21, 641–646.
Scheer, C., Grace, P.R., Rowlings, D.W., Payero, J., 2013. Soil N2O and CO2 emissions
from cotton in Australia under varying irrigation management. Nutr. Cycl.
Agroecosyst. 95, 43–56.
Schwenke, G., Grace, P.R., Bell, M.J., 2013. Nitrogen Use Efficiency. Timing and
Application Method to Minimise Loss and Optimise N Use Efficiency. New
Research on Nitrous Oxide Emissions, Volatilisation and Denitrification.
Australian Grains Research Development Corporation Grower Grains
Research Update.
Schwenke, G., Haigh, B., McMullen, G., Herridge, D.F., 2010. Soil nitrous oxide
emissions under dryland N-fertilised canola and N2-fixing chickpea in the
northern grains region, Australia. Proc.19th World Congress of Soil Science, Soil
Solutions for a Changing World, Brisbane, Australia, pp. 228–231.
Sentek Technologies, 2011. Calibration manual for Sentek soil moisture sensors
Version 2.0.
Shcherbak, I., Millar, N., Robertson, G.P., 2014. Global metaanalysis of the nonlinear
response of soil nitrous oxide (N2O) emissions to fertilizer nitrogen. Proc. Natl.
Acad. Sci..
Skiba, U., Fowler, D., Smith, K.A., 1997. Nitric oxide emissions from agricultural soils
in temperate and tropical climates: Sources, controls and mitigation options.
Nutr. Cycl. Agroecosyst. 48, 139–153.
Smith, P., Martino, D., Cai, Z., Gwary, D., Janzen, H., Kumar, P., McCarl, B., Ogle, S.,
O'Mara, F., Rice, C., Scholes, B., Sirotenko, O., 2007. Agriculture. In: Metz, B.,
Davidson, O.R., Bosch, P.R., Dave, R., Meyer, L.A. (Eds.), Climate Change 2007:
Mitigation. Contribution of Working Group III to the Fourth Assessment Report
of the Intergovernmental Panel on Climate Change. Cambridge University Press,
Cambridge, United Kingdom and New York, NY, USA.
Tilman, D., Cassman, K.G., Matson, P.A., Naylor, R., Polasky, S., 2002. Agricultural
sustainability and intensive production practices. Nature 418, 671–677.
UNFPA, 2011. State of the World Population 2011. United Nations Population Fund,
New York, New York, USA.
Wagner-Riddle, C., Thurtell, G.W., 1998. Nitrous oxide emissions from agricultural
fields during winter and spring thaw as affected by management practices. Nutr.
Cycl. Agroecosyst. 52, 151–163.
Wagner-Riddle, C., Thurtell, G.W., Kidd, G.K., Beauchamp, E.G., Sweetman, R., 1997.
Estimates of nitrous oxide emissions from agricultural fields over 28 months.
Can. J. Soil Sci. 77, 135–144.
Yao, Z., Zheng, X., Xie, B., Mei, B., Wang, R., Butterbach-Bahl, K., Zhu, J., Yin, R., 2009.
Tillage and crop residue management significantly affects N-trace gas emissions
during the non-rice season of a subtropical rice–wheat rotation. Soil Biol.
Biochem. 41, 2131–2140.
M. De Antoni Migliorati et al. / Agriculture, Ecosystems and Environment 204 (2015) 27–39 39