SlideShare a Scribd company logo
1 of 18
What do you get?
Microsoft (MSFT) analysis
1
2
3
4
5
What‘s their vision and where are the coming from?
How is the business structured?
How do they generate revenue?
How they develop products and in which stage is the company in it‘s lifecycle
How does Microsoft invest?
6 Opinion: Discounted cashflow analysis
7 Opinion:Comparable valuation
7
2
5
3
Goal & mission
Microsoft (MSFT) analysis
„To achieve our vision, our research and development efforts focus on
three interconnected amibitions:
1. Reinvent productivity and business processes
2. Build the intelligent cloud and intelligent edge platform
3. Create more personal computing“
History
Microsoft (MSFT) analysis
CEO and Founder
Bill Gates
2000: CEO
Steve
Ballmer
2014: CEO Satya Nadella
1998: Launch
of Windows
98
2001: Xbox
launch
2003:
Windows
Server &
office
system
2011: Office 365
2014: Nokia
2016:
LinkedIn
2022: Blizzard
2022:
Nuance
Microsoft (MSFT) analysis
Business structure
Description
Productivity and
business processes
1
Products
• Productivity and Business Processes
segment consists of products and
services in our portfolio of
productivity, communication, and
information services, spanning a
variety of devices and platforms.
• Office Commercial Suite
• Office Consumer
• LinkedIn
• Dynamics business solutions
Intelligent cloud
2
Personal Computing
3
• Intelligent Cloud segment consists of
our public, private, and hybrid server
products and cloud services that can
power modern business and
developers.
• Server products: Azure, SQL Server,
Windows Server, Visual Studio,
System Centers and others
• Enterprise Services & Consulting
• Our More Personal Computing
segment consists of products and
services that put customers at the
center of the experience with our
technology.
• Windows licensing
• Devices including Surface &
accessories
• Gaming
• Search advertising
EBIT contribution $
+ 29 B
+ 32 B
+ 21 B
Revenue overview
Microsoft (MSFT) analysis
0%
10%
20%
30%
40%
50%
60%
70%
80%
90%
100%
2016A 2017A 2018A 2019A 2020A 2021A 2022A
Chart title: Revenue contribution in % per business segment Implications
Personal computing
• Contribution to total Revenue in 2022: 30 %
• Trend: Declining; contribution in 2016: 44 %
Intelligent cloud
• Contribution to total Revenue in 2022: 38 %
• Trend: Increasing; contribution in 2016: 27 %
• Growth last four years: 23.6 %
Productivity and business processes
• Contribution to total Revenue in 2022: 32 %
• Trend: Stable; contribution in 2016: 28 %
Average
Growth rate
7 %
20 %
16 %
Growth rates
Y16 to Y22
Operating profit in 2022
Microsoft (MSFT) analysis
EBIT margins per business segment (%):
Productivity: 46.9 %
Intelligengt cloud: 43.5 %
Personal computing: 35.2 %
Total EBIT: 42.1 %
EBIT per business segment ($B):
Productivity: 29.68
Intelligengt cloud: 32.72
Personal computing: 20.97
Total revenue: 83.83
35%
40%
25%
Contribution (%) of business segment to
total EBIT
Productivity Intelligent
Cloud
Personal
computing
Products by revenue 2022
Microsoft (MSFT) analysis
33,9 % 22.6 %
12.4 % 8.1 %
6.9 % 5.8 % 3.7 % 3.4 %
2.6 %
Products by revenue
Microsoft (MSFT) analysis
Performance history from 2016 to 2022
Description
• Revenue growth increases steadly
• Profit margin is constant and
ranges between 64 % and 69 %
• EBIT, Net income & OCF margins
increased signifcantly from 2016.
• EPS is also growing heavily
2016 2017 2018 2019 2020 2021 2022
Total revenue $ 91 154 96 571 110 360 125 843 143 015 168 088 198 270
Total revenue growth yoy % 5,9% 14,3% 14,0% 13,6% 17,5% 18,0%
PROFIT $ 58 374 62 310 72 007 82 933 96 937 115 856 135 620
Profit margin % 64,0% 64,5% 65,2% 65,9% 67,8% 68,9% 68,4%
Total operating profit $ 27 188 29 331 35 058 42 959 52 959 69 916 83 383
EBIT margin % 29,8% 30,4% 31,8% 34,1% 37,0% 41,6% 42,1%
EBT $ 25 639 30 207 36 474 43 688 53 036 71 102 83 716
EBT margin % 28,1% 31,3% 33,1% 34,7% 37,1% 42,3% 42,2%
Net income $ 20 539 25 795 16 571 39 240 44 281 61 271 72 738
Net income margin % 22,5% 26,7% 15,0% 31,2% 31,0% 36,5% 36,7%
Cash generated by operating activities $ 33 325 39 813 43 884 52 185 60 675 76 740 89 035
OCF margin % 36,6% 41,2% 39,8% 41,5% 42,4% 45,7% 44,9%
Free cashflow $ 24 982 31 684 32 252 38 260 45 234 56 118 65 149
FCF margin % 27,4% 32,8% 29,2% 30,4% 31,6% 33,4% 32,9%
diluted EPS $ 2,56 3,25 2,13 5,06 5,76 8,05 9,65
EPS growth % 27,0% -34,5% 137,6% 13,8% 39,8% 19,9%
Company life cycle
Stage
Details
Start-up Young Growth High growth Mature growth Decline
Mature stable
Have an idea for a
business that meets an
unmet need in the
market.
Create a business
model that converts
ideas into potential
revenues & earnings
Build the business,
converting potential
into revenues.
Grow your business,
shifting from losses to
profits
Defend your business
from new competitors
& find new markets
Scale down your
business as market
shrinks.
Amount $
Revenue
Earnings
Time
Assumed age of
Microsoft in
lifecycle
Microsoft (MSFT) analysis
How does Microsoft produce products and what are the assoicated risks? risks
Microsoft (MSFT) analysis
• Most products are developed internally
• Focus on cloud computing, AI, devices and operating systems
• Main product research center in Redmond
Product
development
• Platform based ecoystem (Network effect), Competition from marketplace,
product or content
Strategic risk
• Cloud based services are developing and changing (AWS, IBM, Google, Oracle…)
• Open Software
01
02
03
How does microsoft invest their money?
Microsoft (MSFT) analysis
01 02 03
Working capital Capital expenditure Business acquisitions
• Negative networking capital
contributes positively to free
cashflow
• Net working capital as percentage
of revenue: -16 % on average from
2016 to 2022
• Change in networking capital
ranges between -0.5 and -2.8 %
• 12 % of revenue is invested
through capital expenditure in
2022
• Deprecation to capex ratio in 2022
was 0.6x (<1.0x) = The assets of
microsoft grow faster than they
depreciate
• Microsoft regularly adds new
business to it‘s platform
• In 2022 Microsoft added four
business to it‘s portfolio
• Nuance (AI)
• Miburo (cyber security)
• Minit (Productivity)
• Oribi (Data Analytics)
• Blizzard (Gaming)
Scenario used for valuation
Microsoft (MSFT) analysis
Base Downside Upside
15 % 13 % 17 %
25 % 23 % 27 %
11 % 9 % 13 %
44 % 42 % 46 %
43 % 41 % 45 %
35 % 33 % 37 %
Revenue growth
EBIT margin
Valuation inputs
• WACC based on open position per country = 8,94 %
• Terminal growth rate  10y US bond yield – 0.025% = 2.55 %
• Credit Rating AAA = Default spread 0.67 %
• Beta = 0.93
Productivity
Intelligent cloud
Personal computing
Productivity
Intelligent cloud
Personal computing
Discounted cashflow analysis
Microsoft (MSFT) analysis
Discounted cashflow analysis
Microsoft (MSFT) analysis
DCF Valuation Implication
• The EXIT muliplte is the average EV /
EBIDTA multiple based on the EBIDTA in
2028
• EXIT multiple = 20.0x
• The base case is used for the DCF valuation
graph
• The DCF valuation ranges from $319.14
(upside) to $235.95 (downside)
Comparables - operations
Microsoft (MSFT) analysis
Operations for 2023 are based on average growth rate (revenue) and margin (EBIT & EBIDTA)
Blue color = hard coded in spreadsheet
2019 2020 2021 TTM 2023 2019 2020 2021 TTM 2023 2019 2020 2021 TTM 2023
Apple AAPL 260 174 274 515 365 817 387 542 445 299 63 930 66 288 108 949 118 329 121 383 76 477 77 344 120 233 129 557 137 894
Alphabet GOOG 161 857 182 527 257 637 278 139 335 508 34 231 41 224 78 714 82 463 87 177 46 012 54 921 91 155 96 887 107 977
Meta META 70 697 85 965 117 929 119 411 143 307 23 986 32 671 46 753 39 890 51 943 29 727 39 533 54 720 48 034 62 576
Amazon AMZN 280 522 386 064 469 822 485 902 587 523 14 541 22 899 24 879 15 298 28 728 36 330 48 150 59 175 52 620 71 747
Maximum 280 522 386 064 469 822 485 902 587 523 63 930 66 288 108 949 118 329 121 383 76 477 77 344 120 233 129 557 137 894
75th percentile 265 261 302 402 391 818 412 132 480 855 41 656 47 490 86 273 91 430 95 729 53 628 60 527 98 425 105 055 115 456
Median 211 016 228 521 311 727 332 841 390 404 29 109 36 948 62 734 61 177 69 560 41 171 51 536 75 165 74 754 89 862
25th percentile 139 067 158 387 222 710 238 457 287 458 21 625 30 228 41 285 33 742 46 139 34 679 45 996 58 061 51 474 69 455
Minimum 70 697 85 965 117 929 119 411 143 307 14 541 22 899 24 879 15 298 28 728 29 727 39 533 54 720 48 034 62 576
Microsoft MSFT 125 843 143 015 168 088 198 270 233 205 42 959 52 959 69 916 83 383 94 294 54 641 65 755 81 602 97 843 115 202
Revenue EBIT EBITDA
Ticker
Company
• Based on revenue Microsoft is at the low end of the period
• EBIT and EBIDTA are above median
Comparables – valuation multiples
Microsoft (MSFT) analysis
2019 2020 2021 TTM 2023 2019 2020 2021 TTM 2023 2019 2020 2021 TTM 2023
Apple AAPL 11,0x 10,5x 7,8x 7,4x 6,4x 44,9x 43,3x 26,3x 24,2x 23,6x 37,5x 37,1x 23,9x 22,1x 20,8x
Alphabet GOOG 10,7x 9,5x 6,7x 6,2x 5,1x 50,4x 41,9x 21,9x 20,9x 19,8x 37,5x 31,4x 18,9x 17,8x 16,0x
Meta META 6,7x 5,5x 4,0x 3,9x 3,3x 19,6x 14,4x 10,1x 11,8x 9,1x 15,8x 11,9x 8,6x 9,8x 7,5x
Amazon AMZN 5,2x 3,8x 3,1x 3,0x 2,5x 100,9x 64,1x 59,0x 95,9x 51,1x 40,4x 30,5x 24,8x 27,9x 20,4x
Maximum 11,0x 10,5x 7,8x 7,4x 6,4x 100,9x 64,1x 59,0x 95,9x 51,1x 40,4x 37,1x 24,8x 27,9x 20,8x
75th percentile 10,8x 9,7x 7,0x 6,5x 5,5x 63,0x 48,5x 34,5x 42,2x 30,5x 38,2x 32,8x 24,1x 23,6x 20,5x
Median 8,7x 7,5x 5,3x 5,1x 4,2x 47,7x 42,6x 24,1x 22,6x 21,7x 37,5x 30,9x 21,4x 20,0x 18,2x
25th percentile 6,3x 5,1x 3,8x 3,7x 3,1x 38,6x 35,0x 19,0x 18,6x 17,1x 32,1x 25,8x 16,4x 15,8x 13,9x
Minimum 5,2x 3,8x 3,1x 3,0x 2,5x 19,6x 14,4x 10,1x 11,8x 9,1x 15,8x 11,9x 8,6x 9,8x 7,5x
Microsoft MSFT 17,3x 15,3x 13,0x 11,0x 9,4x 50,8x 41,2x 31,2x 26,2x 22,6x 39,9x 33,2x 26,7x 22,3x 18,6x
Revenue EBIT EBITDA
Ticker
Company
Operations for 2023 are based on average growth rate (revenue) and margin (EBIT & EBIDTA)
• Microsoft is the most expensive stock based on EV/Revenue multiple
• EV/EBIT & EV/EBIDTA multiples are above median but much cheaper in comparison to Apple and Amazon
Comparables – valuation multiples
Microsoft (MSFT) analysis
EBITDA
Ticker
Company Debt / EBIDTA Net Debt / EBIDTA
2020 2021 TTM 2023 2021 TTM 2023 2021 TTM 2023
Apple AAPL 77 344 120 233 129 557 137 894 1,0x 1,0x 0,9x (0,5x) (0,5x) (0,5x)
Alphabet GOOG 54 921 91 155 96 887 107 977 0,2x 0,1x 0,1x (2,9x) (2,7x) (2,5x)
Meta META 39 533 54 720 48 034 62 576 0,0x 0,0x 0,0x (0,9x) (1,0x) (0,8x)
Amazon AMZN 48 150 59 175 52 620 71 747 0,8x 0,9x 0,7x (0,8x) (0,9x) (0,7x)
Maximum 77 344 120 233 129 557 137 894 1,0x 1,0x 0,9x (0,5x) (0,5x) (0,5x)
75th percentile 60 527 98 425 105 055 115 456 0,9x 0,9x 0,7x (0,7x) (0,8x) (0,6x)
Median 51 536 75 165 74 754 89 862 0,5x 0,5x 0,4x (0,8x) (0,9x) (0,7x)
25th percentile 45 996 58 061 51 474 69 455 0,1x 0,1x 0,1x (1,4x) (1,4x) (1,2x)
Minimum 39 533 54 720 48 034 62 576 0,0x 0,0x 0,0x (2,9x) (2,7x) (2,5x)
Microsoft MSFT 65 755 81 602 97 843 117 261 0,7x 0,6x 0,5x (0,9x) (1,0x) (0,8x)
• Microsoft and all peers have negative net debt
Operations for 2023 are based on average growth rate (revenue) and margin (EBIT & EBIDTA)
Comparables - valuation
Microsoft (MSFT) analysis
Comparable valuation Legend
25th percentile
to median
Median to 75th
percentile
Current share
price 266 $
$0 $50 $100 $150 $200 $250 $300 $350 $400 $450 $500
EV / revenue 2021
EV / revenue TTM
EV / revenue 2023
EV / EBIT 2021
EV / EBIT TTM
EV / EBIT 2023
EV / EBIDTA 2021
EV / EBIDTA TTM
EV / EBIDTA 2023
P/E ratio 2021
P/E ratio TTM
P/E ratio 2023
Description
• The debt used in the
calcuation for the
enterprise value excludes
leases (also for microsoft)
• In comparison to the
companies Microsoft seem
to be fairly priced based
on EBIDTA and EBIT
• The revenue of Microsoft
for TTM (2022) is very low
in comparison to the peer
group

More Related Content

Similar to Microsoft analysis.pptx

Software Outsourcing Market Trends, Survey & Analysis
Software Outsourcing Market Trends, Survey & AnalysisSoftware Outsourcing Market Trends, Survey & Analysis
Software Outsourcing Market Trends, Survey & AnalysisNexSoftsys
 
Salesforce SMIF FINAL Presntation
Salesforce SMIF FINAL PresntationSalesforce SMIF FINAL Presntation
Salesforce SMIF FINAL PresntationGabriel E. Garcia
 
IDC Manufacturing Research: Call to Action for High tech and Electronics Manu...
IDC Manufacturing Research: Call to Action for High tech and Electronics Manu...IDC Manufacturing Research: Call to Action for High tech and Electronics Manu...
IDC Manufacturing Research: Call to Action for High tech and Electronics Manu...Godlan, Inc
 
BeWise'i loeng: Ivo Vaks "Performance Management ja laienemine Microsofti näi...
BeWise'i loeng: Ivo Vaks "Performance Management ja laienemine Microsofti näi...BeWise'i loeng: Ivo Vaks "Performance Management ja laienemine Microsofti näi...
BeWise'i loeng: Ivo Vaks "Performance Management ja laienemine Microsofti näi...JCI Tallinn BeWise
 
SaaS - 2014 Market Review
SaaS - 2014 Market ReviewSaaS - 2014 Market Review
SaaS - 2014 Market Reviewresultsig
 
Principles of Modern Marketing at NetSuite - Rob Israch (TOPO Demand Generati...
Principles of Modern Marketing at NetSuite - Rob Israch (TOPO Demand Generati...Principles of Modern Marketing at NetSuite - Rob Israch (TOPO Demand Generati...
Principles of Modern Marketing at NetSuite - Rob Israch (TOPO Demand Generati...TOPO
 
KDD capabilities 2016 v1.0
KDD capabilities 2016 v1.0KDD capabilities 2016 v1.0
KDD capabilities 2016 v1.0KDDanalytics
 
Microsoft Office 365
Microsoft Office 365Microsoft Office 365
Microsoft Office 365Dipayan Das
 
L'évolution du métier du DAF induite par la transformation digitale
L'évolution du métier du DAF induite par la transformation digitale L'évolution du métier du DAF induite par la transformation digitale
L'évolution du métier du DAF induite par la transformation digitale Microsoft Ideas
 
Stateofthe cio 2022 sample slides
Stateofthe cio 2022 sample slides Stateofthe cio 2022 sample slides
Stateofthe cio 2022 sample slides IDG
 
Stateofthe cio 2022 sample slides
Stateofthe cio 2022 sample slides Stateofthe cio 2022 sample slides
Stateofthe cio 2022 sample slides IDG
 
Tools for Strategic Analysis
Tools for Strategic AnalysisTools for Strategic Analysis
Tools for Strategic AnalysisAndrew Blake
 

Similar to Microsoft analysis.pptx (20)

Software Outsourcing Market Trends, Survey & Analysis
Software Outsourcing Market Trends, Survey & AnalysisSoftware Outsourcing Market Trends, Survey & Analysis
Software Outsourcing Market Trends, Survey & Analysis
 
Salesforce SMIF FINAL Presntation
Salesforce SMIF FINAL PresntationSalesforce SMIF FINAL Presntation
Salesforce SMIF FINAL Presntation
 
Cognizant Valuation
Cognizant ValuationCognizant Valuation
Cognizant Valuation
 
IDC Manufacturing Research: Call to Action for High tech and Electronics Manu...
IDC Manufacturing Research: Call to Action for High tech and Electronics Manu...IDC Manufacturing Research: Call to Action for High tech and Electronics Manu...
IDC Manufacturing Research: Call to Action for High tech and Electronics Manu...
 
BeWise'i loeng: Ivo Vaks "Performance Management ja laienemine Microsofti näi...
BeWise'i loeng: Ivo Vaks "Performance Management ja laienemine Microsofti näi...BeWise'i loeng: Ivo Vaks "Performance Management ja laienemine Microsofti näi...
BeWise'i loeng: Ivo Vaks "Performance Management ja laienemine Microsofti näi...
 
Fixnix us vc_v3.0
Fixnix us vc_v3.0Fixnix us vc_v3.0
Fixnix us vc_v3.0
 
SaaS - 2014 Market Review
SaaS - 2014 Market ReviewSaaS - 2014 Market Review
SaaS - 2014 Market Review
 
Vc us v4.0
Vc us v4.0Vc us v4.0
Vc us v4.0
 
Francesco perniciaro517057fp
Francesco perniciaro517057fpFrancesco perniciaro517057fp
Francesco perniciaro517057fp
 
Naf power point
Naf power pointNaf power point
Naf power point
 
Pitch book
Pitch bookPitch book
Pitch book
 
Principles of Modern Marketing at NetSuite - Rob Israch (TOPO Demand Generati...
Principles of Modern Marketing at NetSuite - Rob Israch (TOPO Demand Generati...Principles of Modern Marketing at NetSuite - Rob Israch (TOPO Demand Generati...
Principles of Modern Marketing at NetSuite - Rob Israch (TOPO Demand Generati...
 
Spike - pitch deck
Spike - pitch deckSpike - pitch deck
Spike - pitch deck
 
KDD capabilities 2016 v1.0
KDD capabilities 2016 v1.0KDD capabilities 2016 v1.0
KDD capabilities 2016 v1.0
 
Microsoft Office 365
Microsoft Office 365Microsoft Office 365
Microsoft Office 365
 
L'évolution du métier du DAF induite par la transformation digitale
L'évolution du métier du DAF induite par la transformation digitale L'évolution du métier du DAF induite par la transformation digitale
L'évolution du métier du DAF induite par la transformation digitale
 
Stateofthe cio 2022 sample slides
Stateofthe cio 2022 sample slides Stateofthe cio 2022 sample slides
Stateofthe cio 2022 sample slides
 
SIIA & OPEXEngine: Let the Data Set You Free!
SIIA & OPEXEngine: Let the Data Set You Free!SIIA & OPEXEngine: Let the Data Set You Free!
SIIA & OPEXEngine: Let the Data Set You Free!
 
Stateofthe cio 2022 sample slides
Stateofthe cio 2022 sample slides Stateofthe cio 2022 sample slides
Stateofthe cio 2022 sample slides
 
Tools for Strategic Analysis
Tools for Strategic AnalysisTools for Strategic Analysis
Tools for Strategic Analysis
 

Recently uploaded

Sales & Marketing Alignment: How to Synergize for Success
Sales & Marketing Alignment: How to Synergize for SuccessSales & Marketing Alignment: How to Synergize for Success
Sales & Marketing Alignment: How to Synergize for SuccessAggregage
 
Call Girls Pune Just Call 9907093804 Top Class Call Girl Service Available
Call Girls Pune Just Call 9907093804 Top Class Call Girl Service AvailableCall Girls Pune Just Call 9907093804 Top Class Call Girl Service Available
Call Girls Pune Just Call 9907093804 Top Class Call Girl Service AvailableDipal Arora
 
GD Birla and his contribution in management
GD Birla and his contribution in managementGD Birla and his contribution in management
GD Birla and his contribution in managementchhavia330
 
Monthly Social Media Update April 2024 pptx.pptx
Monthly Social Media Update April 2024 pptx.pptxMonthly Social Media Update April 2024 pptx.pptx
Monthly Social Media Update April 2024 pptx.pptxAndy Lambert
 
Keppel Ltd. 1Q 2024 Business Update Presentation Slides
Keppel Ltd. 1Q 2024 Business Update  Presentation SlidesKeppel Ltd. 1Q 2024 Business Update  Presentation Slides
Keppel Ltd. 1Q 2024 Business Update Presentation SlidesKeppelCorporation
 
Call Girls In Panjim North Goa 9971646499 Genuine Service
Call Girls In Panjim North Goa 9971646499 Genuine ServiceCall Girls In Panjim North Goa 9971646499 Genuine Service
Call Girls In Panjim North Goa 9971646499 Genuine Serviceritikaroy0888
 
VIP Call Girls In Saharaganj ( Lucknow ) 🔝 8923113531 🔝 Cash Payment (COD) 👒
VIP Call Girls In Saharaganj ( Lucknow  ) 🔝 8923113531 🔝  Cash Payment (COD) 👒VIP Call Girls In Saharaganj ( Lucknow  ) 🔝 8923113531 🔝  Cash Payment (COD) 👒
VIP Call Girls In Saharaganj ( Lucknow ) 🔝 8923113531 🔝 Cash Payment (COD) 👒anilsa9823
 
Mysore Call Girls 8617370543 WhatsApp Number 24x7 Best Services
Mysore Call Girls 8617370543 WhatsApp Number 24x7 Best ServicesMysore Call Girls 8617370543 WhatsApp Number 24x7 Best Services
Mysore Call Girls 8617370543 WhatsApp Number 24x7 Best ServicesDipal Arora
 
Regression analysis: Simple Linear Regression Multiple Linear Regression
Regression analysis:  Simple Linear Regression Multiple Linear RegressionRegression analysis:  Simple Linear Regression Multiple Linear Regression
Regression analysis: Simple Linear Regression Multiple Linear RegressionRavindra Nath Shukla
 
Eni 2024 1Q Results - 24.04.24 business.
Eni 2024 1Q Results - 24.04.24 business.Eni 2024 1Q Results - 24.04.24 business.
Eni 2024 1Q Results - 24.04.24 business.Eni
 
Best VIP Call Girls Noida Sector 40 Call Me: 8448380779
Best VIP Call Girls Noida Sector 40 Call Me: 8448380779Best VIP Call Girls Noida Sector 40 Call Me: 8448380779
Best VIP Call Girls Noida Sector 40 Call Me: 8448380779Delhi Call girls
 
Yaroslav Rozhankivskyy: Три складові і три передумови максимальної продуктивн...
Yaroslav Rozhankivskyy: Три складові і три передумови максимальної продуктивн...Yaroslav Rozhankivskyy: Три складові і три передумови максимальної продуктивн...
Yaroslav Rozhankivskyy: Три складові і три передумови максимальної продуктивн...Lviv Startup Club
 
Grateful 7 speech thanking everyone that has helped.pdf
Grateful 7 speech thanking everyone that has helped.pdfGrateful 7 speech thanking everyone that has helped.pdf
Grateful 7 speech thanking everyone that has helped.pdfPaul Menig
 
Socio-economic-Impact-of-business-consumers-suppliers-and.pptx
Socio-economic-Impact-of-business-consumers-suppliers-and.pptxSocio-economic-Impact-of-business-consumers-suppliers-and.pptx
Socio-economic-Impact-of-business-consumers-suppliers-and.pptxtrishalcan8
 
Vip Dewas Call Girls #9907093804 Contact Number Escorts Service Dewas
Vip Dewas Call Girls #9907093804 Contact Number Escorts Service DewasVip Dewas Call Girls #9907093804 Contact Number Escorts Service Dewas
Vip Dewas Call Girls #9907093804 Contact Number Escorts Service Dewasmakika9823
 
Catalogue ONG NUOC PPR DE NHAT .pdf
Catalogue ONG NUOC PPR DE NHAT      .pdfCatalogue ONG NUOC PPR DE NHAT      .pdf
Catalogue ONG NUOC PPR DE NHAT .pdfOrient Homes
 
Creating Low-Code Loan Applications using the Trisotech Mortgage Feature Set
Creating Low-Code Loan Applications using the Trisotech Mortgage Feature SetCreating Low-Code Loan Applications using the Trisotech Mortgage Feature Set
Creating Low-Code Loan Applications using the Trisotech Mortgage Feature SetDenis Gagné
 
Enhancing and Restoring Safety & Quality Cultures - Dave Litwiller - May 2024...
Enhancing and Restoring Safety & Quality Cultures - Dave Litwiller - May 2024...Enhancing and Restoring Safety & Quality Cultures - Dave Litwiller - May 2024...
Enhancing and Restoring Safety & Quality Cultures - Dave Litwiller - May 2024...Dave Litwiller
 

Recently uploaded (20)

Sales & Marketing Alignment: How to Synergize for Success
Sales & Marketing Alignment: How to Synergize for SuccessSales & Marketing Alignment: How to Synergize for Success
Sales & Marketing Alignment: How to Synergize for Success
 
Call Girls Pune Just Call 9907093804 Top Class Call Girl Service Available
Call Girls Pune Just Call 9907093804 Top Class Call Girl Service AvailableCall Girls Pune Just Call 9907093804 Top Class Call Girl Service Available
Call Girls Pune Just Call 9907093804 Top Class Call Girl Service Available
 
GD Birla and his contribution in management
GD Birla and his contribution in managementGD Birla and his contribution in management
GD Birla and his contribution in management
 
Monthly Social Media Update April 2024 pptx.pptx
Monthly Social Media Update April 2024 pptx.pptxMonthly Social Media Update April 2024 pptx.pptx
Monthly Social Media Update April 2024 pptx.pptx
 
Keppel Ltd. 1Q 2024 Business Update Presentation Slides
Keppel Ltd. 1Q 2024 Business Update  Presentation SlidesKeppel Ltd. 1Q 2024 Business Update  Presentation Slides
Keppel Ltd. 1Q 2024 Business Update Presentation Slides
 
Call Girls In Panjim North Goa 9971646499 Genuine Service
Call Girls In Panjim North Goa 9971646499 Genuine ServiceCall Girls In Panjim North Goa 9971646499 Genuine Service
Call Girls In Panjim North Goa 9971646499 Genuine Service
 
Forklift Operations: Safety through Cartoons
Forklift Operations: Safety through CartoonsForklift Operations: Safety through Cartoons
Forklift Operations: Safety through Cartoons
 
VIP Call Girls In Saharaganj ( Lucknow ) 🔝 8923113531 🔝 Cash Payment (COD) 👒
VIP Call Girls In Saharaganj ( Lucknow  ) 🔝 8923113531 🔝  Cash Payment (COD) 👒VIP Call Girls In Saharaganj ( Lucknow  ) 🔝 8923113531 🔝  Cash Payment (COD) 👒
VIP Call Girls In Saharaganj ( Lucknow ) 🔝 8923113531 🔝 Cash Payment (COD) 👒
 
Mysore Call Girls 8617370543 WhatsApp Number 24x7 Best Services
Mysore Call Girls 8617370543 WhatsApp Number 24x7 Best ServicesMysore Call Girls 8617370543 WhatsApp Number 24x7 Best Services
Mysore Call Girls 8617370543 WhatsApp Number 24x7 Best Services
 
Regression analysis: Simple Linear Regression Multiple Linear Regression
Regression analysis:  Simple Linear Regression Multiple Linear RegressionRegression analysis:  Simple Linear Regression Multiple Linear Regression
Regression analysis: Simple Linear Regression Multiple Linear Regression
 
Eni 2024 1Q Results - 24.04.24 business.
Eni 2024 1Q Results - 24.04.24 business.Eni 2024 1Q Results - 24.04.24 business.
Eni 2024 1Q Results - 24.04.24 business.
 
Best VIP Call Girls Noida Sector 40 Call Me: 8448380779
Best VIP Call Girls Noida Sector 40 Call Me: 8448380779Best VIP Call Girls Noida Sector 40 Call Me: 8448380779
Best VIP Call Girls Noida Sector 40 Call Me: 8448380779
 
Yaroslav Rozhankivskyy: Три складові і три передумови максимальної продуктивн...
Yaroslav Rozhankivskyy: Три складові і три передумови максимальної продуктивн...Yaroslav Rozhankivskyy: Три складові і три передумови максимальної продуктивн...
Yaroslav Rozhankivskyy: Три складові і три передумови максимальної продуктивн...
 
Grateful 7 speech thanking everyone that has helped.pdf
Grateful 7 speech thanking everyone that has helped.pdfGrateful 7 speech thanking everyone that has helped.pdf
Grateful 7 speech thanking everyone that has helped.pdf
 
Socio-economic-Impact-of-business-consumers-suppliers-and.pptx
Socio-economic-Impact-of-business-consumers-suppliers-and.pptxSocio-economic-Impact-of-business-consumers-suppliers-and.pptx
Socio-economic-Impact-of-business-consumers-suppliers-and.pptx
 
Vip Dewas Call Girls #9907093804 Contact Number Escorts Service Dewas
Vip Dewas Call Girls #9907093804 Contact Number Escorts Service DewasVip Dewas Call Girls #9907093804 Contact Number Escorts Service Dewas
Vip Dewas Call Girls #9907093804 Contact Number Escorts Service Dewas
 
Catalogue ONG NUOC PPR DE NHAT .pdf
Catalogue ONG NUOC PPR DE NHAT      .pdfCatalogue ONG NUOC PPR DE NHAT      .pdf
Catalogue ONG NUOC PPR DE NHAT .pdf
 
Creating Low-Code Loan Applications using the Trisotech Mortgage Feature Set
Creating Low-Code Loan Applications using the Trisotech Mortgage Feature SetCreating Low-Code Loan Applications using the Trisotech Mortgage Feature Set
Creating Low-Code Loan Applications using the Trisotech Mortgage Feature Set
 
Enhancing and Restoring Safety & Quality Cultures - Dave Litwiller - May 2024...
Enhancing and Restoring Safety & Quality Cultures - Dave Litwiller - May 2024...Enhancing and Restoring Safety & Quality Cultures - Dave Litwiller - May 2024...
Enhancing and Restoring Safety & Quality Cultures - Dave Litwiller - May 2024...
 
Nepali Escort Girl Kakori \ 9548273370 Indian Call Girls Service Lucknow ₹,9517
Nepali Escort Girl Kakori \ 9548273370 Indian Call Girls Service Lucknow ₹,9517Nepali Escort Girl Kakori \ 9548273370 Indian Call Girls Service Lucknow ₹,9517
Nepali Escort Girl Kakori \ 9548273370 Indian Call Girls Service Lucknow ₹,9517
 

Microsoft analysis.pptx

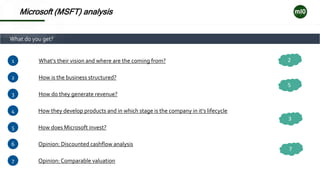
  • 1. What do you get? Microsoft (MSFT) analysis 1 2 3 4 5 What‘s their vision and where are the coming from? How is the business structured? How do they generate revenue? How they develop products and in which stage is the company in it‘s lifecycle How does Microsoft invest? 6 Opinion: Discounted cashflow analysis 7 Opinion:Comparable valuation 7 2 5 3
  • 2. Goal & mission Microsoft (MSFT) analysis „To achieve our vision, our research and development efforts focus on three interconnected amibitions: 1. Reinvent productivity and business processes 2. Build the intelligent cloud and intelligent edge platform 3. Create more personal computing“
  • 3. History Microsoft (MSFT) analysis CEO and Founder Bill Gates 2000: CEO Steve Ballmer 2014: CEO Satya Nadella 1998: Launch of Windows 98 2001: Xbox launch 2003: Windows Server & office system 2011: Office 365 2014: Nokia 2016: LinkedIn 2022: Blizzard 2022: Nuance
  • 4. Microsoft (MSFT) analysis Business structure Description Productivity and business processes 1 Products • Productivity and Business Processes segment consists of products and services in our portfolio of productivity, communication, and information services, spanning a variety of devices and platforms. • Office Commercial Suite • Office Consumer • LinkedIn • Dynamics business solutions Intelligent cloud 2 Personal Computing 3 • Intelligent Cloud segment consists of our public, private, and hybrid server products and cloud services that can power modern business and developers. • Server products: Azure, SQL Server, Windows Server, Visual Studio, System Centers and others • Enterprise Services & Consulting • Our More Personal Computing segment consists of products and services that put customers at the center of the experience with our technology. • Windows licensing • Devices including Surface & accessories • Gaming • Search advertising EBIT contribution $ + 29 B + 32 B + 21 B
  • 5. Revenue overview Microsoft (MSFT) analysis 0% 10% 20% 30% 40% 50% 60% 70% 80% 90% 100% 2016A 2017A 2018A 2019A 2020A 2021A 2022A Chart title: Revenue contribution in % per business segment Implications Personal computing • Contribution to total Revenue in 2022: 30 % • Trend: Declining; contribution in 2016: 44 % Intelligent cloud • Contribution to total Revenue in 2022: 38 % • Trend: Increasing; contribution in 2016: 27 % • Growth last four years: 23.6 % Productivity and business processes • Contribution to total Revenue in 2022: 32 % • Trend: Stable; contribution in 2016: 28 % Average Growth rate 7 % 20 % 16 % Growth rates Y16 to Y22
  • 6. Operating profit in 2022 Microsoft (MSFT) analysis EBIT margins per business segment (%): Productivity: 46.9 % Intelligengt cloud: 43.5 % Personal computing: 35.2 % Total EBIT: 42.1 % EBIT per business segment ($B): Productivity: 29.68 Intelligengt cloud: 32.72 Personal computing: 20.97 Total revenue: 83.83 35% 40% 25% Contribution (%) of business segment to total EBIT Productivity Intelligent Cloud Personal computing
  • 7. Products by revenue 2022 Microsoft (MSFT) analysis 33,9 % 22.6 % 12.4 % 8.1 % 6.9 % 5.8 % 3.7 % 3.4 % 2.6 %
  • 8. Products by revenue Microsoft (MSFT) analysis Performance history from 2016 to 2022 Description • Revenue growth increases steadly • Profit margin is constant and ranges between 64 % and 69 % • EBIT, Net income & OCF margins increased signifcantly from 2016. • EPS is also growing heavily 2016 2017 2018 2019 2020 2021 2022 Total revenue $ 91 154 96 571 110 360 125 843 143 015 168 088 198 270 Total revenue growth yoy % 5,9% 14,3% 14,0% 13,6% 17,5% 18,0% PROFIT $ 58 374 62 310 72 007 82 933 96 937 115 856 135 620 Profit margin % 64,0% 64,5% 65,2% 65,9% 67,8% 68,9% 68,4% Total operating profit $ 27 188 29 331 35 058 42 959 52 959 69 916 83 383 EBIT margin % 29,8% 30,4% 31,8% 34,1% 37,0% 41,6% 42,1% EBT $ 25 639 30 207 36 474 43 688 53 036 71 102 83 716 EBT margin % 28,1% 31,3% 33,1% 34,7% 37,1% 42,3% 42,2% Net income $ 20 539 25 795 16 571 39 240 44 281 61 271 72 738 Net income margin % 22,5% 26,7% 15,0% 31,2% 31,0% 36,5% 36,7% Cash generated by operating activities $ 33 325 39 813 43 884 52 185 60 675 76 740 89 035 OCF margin % 36,6% 41,2% 39,8% 41,5% 42,4% 45,7% 44,9% Free cashflow $ 24 982 31 684 32 252 38 260 45 234 56 118 65 149 FCF margin % 27,4% 32,8% 29,2% 30,4% 31,6% 33,4% 32,9% diluted EPS $ 2,56 3,25 2,13 5,06 5,76 8,05 9,65 EPS growth % 27,0% -34,5% 137,6% 13,8% 39,8% 19,9%
  • 9. Company life cycle Stage Details Start-up Young Growth High growth Mature growth Decline Mature stable Have an idea for a business that meets an unmet need in the market. Create a business model that converts ideas into potential revenues & earnings Build the business, converting potential into revenues. Grow your business, shifting from losses to profits Defend your business from new competitors & find new markets Scale down your business as market shrinks. Amount $ Revenue Earnings Time Assumed age of Microsoft in lifecycle Microsoft (MSFT) analysis
  • 10. How does Microsoft produce products and what are the assoicated risks? risks Microsoft (MSFT) analysis • Most products are developed internally • Focus on cloud computing, AI, devices and operating systems • Main product research center in Redmond Product development • Platform based ecoystem (Network effect), Competition from marketplace, product or content Strategic risk • Cloud based services are developing and changing (AWS, IBM, Google, Oracle…) • Open Software 01 02 03
  • 11. How does microsoft invest their money? Microsoft (MSFT) analysis 01 02 03 Working capital Capital expenditure Business acquisitions • Negative networking capital contributes positively to free cashflow • Net working capital as percentage of revenue: -16 % on average from 2016 to 2022 • Change in networking capital ranges between -0.5 and -2.8 % • 12 % of revenue is invested through capital expenditure in 2022 • Deprecation to capex ratio in 2022 was 0.6x (<1.0x) = The assets of microsoft grow faster than they depreciate • Microsoft regularly adds new business to it‘s platform • In 2022 Microsoft added four business to it‘s portfolio • Nuance (AI) • Miburo (cyber security) • Minit (Productivity) • Oribi (Data Analytics) • Blizzard (Gaming)
  • 12. Scenario used for valuation Microsoft (MSFT) analysis Base Downside Upside 15 % 13 % 17 % 25 % 23 % 27 % 11 % 9 % 13 % 44 % 42 % 46 % 43 % 41 % 45 % 35 % 33 % 37 % Revenue growth EBIT margin Valuation inputs • WACC based on open position per country = 8,94 % • Terminal growth rate  10y US bond yield – 0.025% = 2.55 % • Credit Rating AAA = Default spread 0.67 % • Beta = 0.93 Productivity Intelligent cloud Personal computing Productivity Intelligent cloud Personal computing
  • 14. Discounted cashflow analysis Microsoft (MSFT) analysis DCF Valuation Implication • The EXIT muliplte is the average EV / EBIDTA multiple based on the EBIDTA in 2028 • EXIT multiple = 20.0x • The base case is used for the DCF valuation graph • The DCF valuation ranges from $319.14 (upside) to $235.95 (downside)
  • 15. Comparables - operations Microsoft (MSFT) analysis Operations for 2023 are based on average growth rate (revenue) and margin (EBIT & EBIDTA) Blue color = hard coded in spreadsheet 2019 2020 2021 TTM 2023 2019 2020 2021 TTM 2023 2019 2020 2021 TTM 2023 Apple AAPL 260 174 274 515 365 817 387 542 445 299 63 930 66 288 108 949 118 329 121 383 76 477 77 344 120 233 129 557 137 894 Alphabet GOOG 161 857 182 527 257 637 278 139 335 508 34 231 41 224 78 714 82 463 87 177 46 012 54 921 91 155 96 887 107 977 Meta META 70 697 85 965 117 929 119 411 143 307 23 986 32 671 46 753 39 890 51 943 29 727 39 533 54 720 48 034 62 576 Amazon AMZN 280 522 386 064 469 822 485 902 587 523 14 541 22 899 24 879 15 298 28 728 36 330 48 150 59 175 52 620 71 747 Maximum 280 522 386 064 469 822 485 902 587 523 63 930 66 288 108 949 118 329 121 383 76 477 77 344 120 233 129 557 137 894 75th percentile 265 261 302 402 391 818 412 132 480 855 41 656 47 490 86 273 91 430 95 729 53 628 60 527 98 425 105 055 115 456 Median 211 016 228 521 311 727 332 841 390 404 29 109 36 948 62 734 61 177 69 560 41 171 51 536 75 165 74 754 89 862 25th percentile 139 067 158 387 222 710 238 457 287 458 21 625 30 228 41 285 33 742 46 139 34 679 45 996 58 061 51 474 69 455 Minimum 70 697 85 965 117 929 119 411 143 307 14 541 22 899 24 879 15 298 28 728 29 727 39 533 54 720 48 034 62 576 Microsoft MSFT 125 843 143 015 168 088 198 270 233 205 42 959 52 959 69 916 83 383 94 294 54 641 65 755 81 602 97 843 115 202 Revenue EBIT EBITDA Ticker Company • Based on revenue Microsoft is at the low end of the period • EBIT and EBIDTA are above median
  • 16. Comparables – valuation multiples Microsoft (MSFT) analysis 2019 2020 2021 TTM 2023 2019 2020 2021 TTM 2023 2019 2020 2021 TTM 2023 Apple AAPL 11,0x 10,5x 7,8x 7,4x 6,4x 44,9x 43,3x 26,3x 24,2x 23,6x 37,5x 37,1x 23,9x 22,1x 20,8x Alphabet GOOG 10,7x 9,5x 6,7x 6,2x 5,1x 50,4x 41,9x 21,9x 20,9x 19,8x 37,5x 31,4x 18,9x 17,8x 16,0x Meta META 6,7x 5,5x 4,0x 3,9x 3,3x 19,6x 14,4x 10,1x 11,8x 9,1x 15,8x 11,9x 8,6x 9,8x 7,5x Amazon AMZN 5,2x 3,8x 3,1x 3,0x 2,5x 100,9x 64,1x 59,0x 95,9x 51,1x 40,4x 30,5x 24,8x 27,9x 20,4x Maximum 11,0x 10,5x 7,8x 7,4x 6,4x 100,9x 64,1x 59,0x 95,9x 51,1x 40,4x 37,1x 24,8x 27,9x 20,8x 75th percentile 10,8x 9,7x 7,0x 6,5x 5,5x 63,0x 48,5x 34,5x 42,2x 30,5x 38,2x 32,8x 24,1x 23,6x 20,5x Median 8,7x 7,5x 5,3x 5,1x 4,2x 47,7x 42,6x 24,1x 22,6x 21,7x 37,5x 30,9x 21,4x 20,0x 18,2x 25th percentile 6,3x 5,1x 3,8x 3,7x 3,1x 38,6x 35,0x 19,0x 18,6x 17,1x 32,1x 25,8x 16,4x 15,8x 13,9x Minimum 5,2x 3,8x 3,1x 3,0x 2,5x 19,6x 14,4x 10,1x 11,8x 9,1x 15,8x 11,9x 8,6x 9,8x 7,5x Microsoft MSFT 17,3x 15,3x 13,0x 11,0x 9,4x 50,8x 41,2x 31,2x 26,2x 22,6x 39,9x 33,2x 26,7x 22,3x 18,6x Revenue EBIT EBITDA Ticker Company Operations for 2023 are based on average growth rate (revenue) and margin (EBIT & EBIDTA) • Microsoft is the most expensive stock based on EV/Revenue multiple • EV/EBIT & EV/EBIDTA multiples are above median but much cheaper in comparison to Apple and Amazon
  • 17. Comparables – valuation multiples Microsoft (MSFT) analysis EBITDA Ticker Company Debt / EBIDTA Net Debt / EBIDTA 2020 2021 TTM 2023 2021 TTM 2023 2021 TTM 2023 Apple AAPL 77 344 120 233 129 557 137 894 1,0x 1,0x 0,9x (0,5x) (0,5x) (0,5x) Alphabet GOOG 54 921 91 155 96 887 107 977 0,2x 0,1x 0,1x (2,9x) (2,7x) (2,5x) Meta META 39 533 54 720 48 034 62 576 0,0x 0,0x 0,0x (0,9x) (1,0x) (0,8x) Amazon AMZN 48 150 59 175 52 620 71 747 0,8x 0,9x 0,7x (0,8x) (0,9x) (0,7x) Maximum 77 344 120 233 129 557 137 894 1,0x 1,0x 0,9x (0,5x) (0,5x) (0,5x) 75th percentile 60 527 98 425 105 055 115 456 0,9x 0,9x 0,7x (0,7x) (0,8x) (0,6x) Median 51 536 75 165 74 754 89 862 0,5x 0,5x 0,4x (0,8x) (0,9x) (0,7x) 25th percentile 45 996 58 061 51 474 69 455 0,1x 0,1x 0,1x (1,4x) (1,4x) (1,2x) Minimum 39 533 54 720 48 034 62 576 0,0x 0,0x 0,0x (2,9x) (2,7x) (2,5x) Microsoft MSFT 65 755 81 602 97 843 117 261 0,7x 0,6x 0,5x (0,9x) (1,0x) (0,8x) • Microsoft and all peers have negative net debt Operations for 2023 are based on average growth rate (revenue) and margin (EBIT & EBIDTA)
  • 18. Comparables - valuation Microsoft (MSFT) analysis Comparable valuation Legend 25th percentile to median Median to 75th percentile Current share price 266 $ $0 $50 $100 $150 $200 $250 $300 $350 $400 $450 $500 EV / revenue 2021 EV / revenue TTM EV / revenue 2023 EV / EBIT 2021 EV / EBIT TTM EV / EBIT 2023 EV / EBIDTA 2021 EV / EBIDTA TTM EV / EBIDTA 2023 P/E ratio 2021 P/E ratio TTM P/E ratio 2023 Description • The debt used in the calcuation for the enterprise value excludes leases (also for microsoft) • In comparison to the companies Microsoft seem to be fairly priced based on EBIDTA and EBIT • The revenue of Microsoft for TTM (2022) is very low in comparison to the peer group

Editor's Notes

  1. Top down Very volatile, 5% and 5.5% can make a huge difference
  2. Top down Very volatile, 5% and 5.5% can make a huge difference
  3. Top down Very volatile, 5% and 5.5% can make a huge difference
  4. Top down Very volatile, 5% and 5.5% can make a huge difference
  5. Top down Very volatile, 5% and 5.5% can make a huge difference
  6. Top down Very volatile, 5% and 5.5% can make a huge difference
  7. Top down Very volatile, 5% and 5.5% can make a huge difference
  8. Top down Very volatile, 5% and 5.5% can make a huge difference
  9. Top down Very volatile, 5% and 5.5% can make a huge difference
  10. Top down Very volatile, 5% and 5.5% can make a huge difference
  11. Top down Very volatile, 5% and 5.5% can make a huge difference