More Related Content
Similar to denison consulting overview
Similar to denison consulting overview (20)
denison consulting overview
- 1. researchnotes
Volume 1, Issue 4, 2011
All content © 2005-2011 Denison Consulting. All rights reserved. l www.denisonconsulting.com l Page 1
Beliefs and
Flexible Assumptions Stable
External Focus
Internal Focus
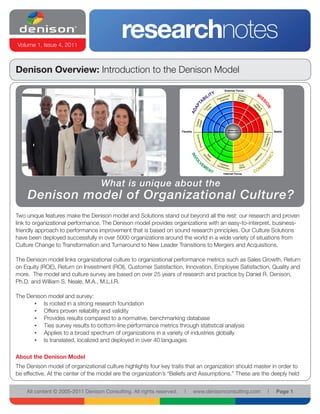
Denison Overview: Introduction to the Denison Model
Two unique features make the Denison model and Solutions stand out beyond all the rest: our research and proven
link to organizational performance. The Denison model provides organizations with an easy-to-interpret, business-friendly
approach to performance improvement that is based on sound research principles. Our Culture Solutions
have been deployed successfully in over 5000 organizations around the world in a wide variety of situations from
Culture Change to Transformation and Turnaround to New Leader Transitions to Mergers and Acquisitions.
The Denison model links organizational culture to organizational performance metrics such as Sales Growth, Return
on Equity (ROE), Return on Investment (ROI), Customer Satisfaction, Innovation, Employee Satisfaction, Quality and
more. The model and culture survey are based on over 25 years of research and practice by Daniel R. Denison,
Ph.D. and William S. Neale, M.A., M.L.I.R.
The Denison model and survey:
• Is rooted in a strong research foundation
• Offers proven reliability and validity
• Provides results compared to a normative, benchmarking database
• Ties survey results to bottom-line performance metrics through statistical analysis
• Applies to a broad spectrum of organizations in a variety of industries globally
• Is translated, localized and deployed in over 40 languages
About the Denison Model
The Denison model of organizational culture highlights four key traits that an organization should master in order to
be effective. At the center of the model are the organization’s “Beliefs and Assumptions.” These are the deeply held
What is unique about the
Denison model of Organizational Culture?
- 2. All content © 2005-2011 Denison Consulting, LLC. All rights reserved. l www.denisonconsulting.com l Page 2
Beliefs and
Flexible Assumptions Stable
External Focus
Internal Focus
The Denison Model
Mission
Defining a meaningful
long-term direction for
the organization.
“Do we know where
we are going?”
Consistency
Defining the values
and systems that
are the basis of
a strong culture.
“Does our system
create leverage?”
Adaptability
Translating the
demands of the
business environment
into action.
“Are we listening to
the marketplace?”
Involvement
Building human
capability, ownership
and responsibility.
“Are our people
aligned and
engaged?”
aspects of an organization’s identity that are often hard to access. The four traits of the Denison Model, Mission,
Adaptability, Involvement and Consistency, measure the behaviors driven by these beliefs and assumptions that
create an organization’s culture. These traits are organized by color and are designed to help you answer key
questions about your organization.
• Mission: Do we know where we are going?
• Adaptability: Are we responding to the marketplace/external environment?
• Involvement: Are our people aligned and engaged?
• Consistency: Do we have the values, systems and processes in place to create leverage?
Each trait breaks down into three indexes. For example, Adaptability breaks down into Creating Change, Customer
Focus and Organizational Learning. Each index is made up of five questions, for a total of 60 questions, on the
survey. Each of the four traits is represented by a color on the circumplex model. This color coding helps to group
the related constructs into the four traits and also helps provide visual and intuitive feedback in the reports.
Denison’s research has demonstrated that effective organizations have high culture scores in all four traits. Thus,
effective organizations are likely to have cultures that are adaptive, yet highly consistent and predictable, and that
foster high involvement, but do so within the context of a shared sense of mission. This robust model also splits into
hemispheres: Internal/External and Flexible/Stable.
External Focus (Adaptability + Mission): An organization with a strong external focus is committed to adapting
and changing in response to the external environment. It has a constant eye on the marketplace and a strong sense
of where it is headed. A strong external focus typically impacts revenue, sales growth, and market share.
Internal Focus (Involvement + Consistency): An organization with a strong internal focus is committed to the
dynamics of the internal integration of systems, structures, and processes. It values its people and prides itself on the
- 3. All content © 2005-2011 Denison Consulting, LLC. All rights reserved. l www.denisonconsulting.com l Page 3
quality of its products or services. A strong internal focus has been linked to higher levels of quality and
employee satisfaction.
Flexibility (Adaptability + Involvement): A flexible organization has the capability to change in response to the
environment. Its focus is on its customers and its people. A flexible organization is typically linked to higher levels of
product and service innovation, creativity, and a fast response to the changing needs of customers and employees.
Stability (Mission + Consistency): A stable organization has the capacity to remain focused and predictable
over time. A stable organization is typically linked to high return on assets, investments and sales growth, as well as
strong business operations.
There are also two significant dynamic tensions that a successful organization must negotiate. The tension between
Top-Down and Bottom-Up Management, represented by the Mission and Involvement traits, is important for
organizations to understand. To be successful, an organization must be able to link the mission, purpose and goals
of the organization to create a shared sense of ownership, commitment and responsibility for its employees.
The second important dynamic tension is the link between Adaptability (Stimulate Progress) and Consistency
(Preserve the Core). Successful organizations learn how to balance the dual challenges of external adaptation and
internal integration and consistency. In all cases, it is not
an either/or proposition. Our experience tells us that the
most successful organizations have a balanced profile.
Interpreting Survey Results
When an organization takes the DOCS, the individual
results are aggregated and reported back in a
circumplex report. The circumplex report shows a
numerical percentile score for each of the 12 indices.
The percentile score is calculated based on our global
normative database.
In this example:
• The sample organization received a percentile score
of 58 in the Vision index of the Mission trait. This
means that 58% of the organizations in the norma-tive
database scored lower than this organization.
• The Vision score has three segments of color, indicating that the percentile result falls into the third quartile. The
Goals and Objectives index has two segments of color, because the 46th percentile falls into the second quartile.
Normative Database and Percentiles
Denison Consulting generates your organization’s results by comparing them to those of over 1000 other
organizations in our global normative database. The percentile scores indicate how well your organization ranks
in comparison to the other organizations in the database. For example, if your organization has a percentile score
of 94 in the Customer Focus index, that means that you scored higher than 94 percent of the organizations in the
database -- making the results easy to understand and interpret.
Using percentiles helps give meaning to the results and helps organizations to answer the question: “Is that
good?” For example, a raw mean score of 2.5 on an index does not convey much information. However, if that
mean translates to a percentile of 34, it tells the organization that this is a vulnerable area that deserves attention.
35
49 25
48
47
61
40
54 47
56
46
Beliefs and
Flexible Assumptions Stable
External Focus
Internal Focus
58
- 4. All content © 2005-2011 Denison Consulting, LLC. All rights reserved. l www.denisonconsulting.com l Page 4
Percentiles provide meaning and context to the results.
Organizations represented in the normative database
come from a wide variety of industries and geographical
locations. Through our ongoing research, we have found
that different industries, from finance to pharmaceuticals,
and even different countries have very similar results to
the global database.
Customization and Reporting
The Denison Organizational Culture Survey can be
customized to meet your organization’s specific needs.
Additional questions can be added in the form of
scaled questions, open-ended questions or drop-down
questions. The most common customization is adding
drop-down demographic questions which we can use
to create report segments for your organization. Based
on your demographic variables, Denison can create
reports broken out for groups such as functional areas,
locations, management levels and more. A number of
additional reports are available and custom reports can
be created to meet your organization’s specific needs.
Our team of Account Managers, Ph.D.-level Researchers
and Consultants can help you create a survey that
will give you the information you need to help your
organization perform to its fullest.
Reliability and Validity: Measuring Performance
Our research makes the difference! The scales of the
Denison Organizational Culture Survey have been
examined using reliability analysis, confirmatory factor
analysis and predictive validity measures. These
analyses indicate scientifically acceptable levels of
consistency within scales. They also offer support for
the psychometric integrity of the survey and the survey’s
link to organizational effectiveness. We do this because
we want to make sure our results are valid. Our research
consistently demonstrates that organizations that score
well on the culture survey also score well on other
performance metrics.
We are a research-based organization and pride
ourselves on the strength of our model and survey.
Ongoing Denison research projects are examining the
correlation between culture and such organizational
effectiveness measures as customer satisfaction, sales
growth, return on investment, gross margin and more.
The results show that an organization’s culture, as
measured by the Denison Organizational Culture Survey,
is directly related to its performance.
Related Resources
Denison Consulting. (2005, April). Overview of the Reliability
and Validity of the Denison Organizational Culture Survey. Ann
Arbor, MI: Author.
Denison Consulting. (2009). Overview of the 2009 DOCS Nor-mative
Database. Ann Arbor, MI: Author.
Denison, D. R. (1984). Bringing corporate culture to the bot-tom
line. Organizational Dynamics, 13(2), 4-22.
Denison, D. R. (1990). Corporate culture and organizational
effectiveness. New York: John Wiley & Sons.
Denison, D. R, Janovics, J. E., & Young, J. L. (2004).
Diagnosing Organizational Cultures: Validating a Model and
Method. Ann Arbor: Denison Consulting.
Denison, D. R. and Mishra, A. K. (1995). Toward a theory of
organizational culture and effectiveness. Organization Sci-ence,
6(2), 204-223.
Contact Information
Denison Consulting, LLC
121 West Washington, Suite 201
Ann Arbor Michigan 48104
Phone: (734) 302-4002
Fax: (734) 302-4023
Email: TalkToUs@denisonconsulting.com
Copyright Information
Copyright 2005-2011 Denison Consulting, LLC.
All Rights Reserved.
Unauthorized reproduction, in any manner, is prohibited.
The Denison model, circumplex and survey are trademarks of
Denison Consulting, LLC.
Version 1.4, May 2011