This study assessed undergraduates' ability to identify independent and dependent variables in acid-base titration experiments. The researcher measured students' ability to identify the independent variable as an acid or base before and after a guided lab experiment. Students scored higher in identifying an acid as the independent variable after the lab. However, their ability to identify a base as independent decreased compared to an acid. Students also scored lower in describing the direct relationship between variables when the independent variable was a base instead of an acid. The results suggest students are more familiar with acids as independent variables in titration experiments.
Chi-Square Test Non Parametric Test Categorical Variable
Nakhla_S15_Draft_Final copy (1)
1. An Analysis of Undergraduates’ Ability to Identify an Independent Variable
in an Acid/Base Titration Inquiry Laboratory Experiment
Mark Nakhla
Barbara L. Gonzalez Ph.D., Advisor
Department of Chemistry and Biochemistry, California State University Fullerton
An Analysis of Undergraduates’ Ability to Identify an Independent Variable
in an Acid/Base Titration Inquiry Laboratory Experiment
Mark Nakhla
Barbara L. Gonzalez Ph.D., Advisor
Department of Chemistry and Biochemistry, California State University Fullerton
ABSTRACT
ACKNOWLEDGMENTS
THEORETICAL FRAMEWORK
RESEARCH QUESTIONS
•Is there a statistically significant difference in the average total mean scores in
identifying an independent variable as an acid in a titration experiment prior to and
after completing a guided inquiry laboratory experiment?
•Is there a statistically significant difference in the average total mean scores in
identifying an independent variable when we reverse the roles of an independent
variable from an acid to a base?
•Is there a statistically significant difference in the average total mean scores in
identifying a direct relation between an independent variable and a dependent
variable when we reverse the roles from an acid to a base?
METHODOLOGY
• Cognitive Learning TheoryCognitive Learning Theory
• Dual Coding(Allan Paivio, 2006)Dual Coding(Allan Paivio, 2006)
• Representational CompetenceRepresentational Competence
• Development of Mental Representation (Sigel, 1999), (Kozma, 2000)Development of Mental Representation (Sigel, 1999), (Kozma, 2000)
• Visualization and ModellingVisualization and Modelling
• Models and Modelling (Gilbert, 2004)Models and Modelling (Gilbert, 2004)
• Role of Laboratory in Learning ScienceRole of Laboratory in Learning Science
• American’s Lab Report (Singer, 2005)American’s Lab Report (Singer, 2005)
The purpose of this study is to assess undergraduates” ability to distinguish an
independent variable from a dependent variable in the context of a neutralization
reaction. The study further investigates the ability of undergraduates to indicate a
clear, direct relationship between these two variables. The mean scores of students
(n=254) ability to identify an independent variable as an acid and base on a pre and
post laboratory activity were measured. The results indicate that after completion of
a guided inquiry laboratory experiment, the undergraduates’ ability to identify an
independent variable as an acid increased significantly compared to a pre laboratory
activity (t=8.15, df = 298, p≥0.05). However, when analyzing undergraduates’
laboratory reports, there was a decrease in their ability to identify an independent
variable as a base compared to an acid (t=3.40, df = 504, p≤0.05). Furthermore, their
ability to indicate a direct relation between the two variables decreased when
changing the independent variable from an acid to a base (t=2.62, df = 443, p≤0.01).
The results of this study suggest that students may have difficulty in recognizing that
a base may be an independent variable in an experimental design involving titration.
National Science Foundation
• DUE1044049
•DUE 1044031
CONCLUSIONS
STUDY DESIGN
REPRESENTATIONAL MODELS USED
RESULTS: MEAN TOTAL SCORE OF RELATION COMPARING ACTIVITIES
EXPERIMENTAL PROMPT
IMPLICATIONS
•General Chemistry students were more likely to identify an independent variable correctly
after completion of an acid/base titration experiment.
•General Chemistry students were less likely to identify a base as an independent variable
correctly in a titration.
•General Chemistry students were less likely to describe the relationship between an
independent variable and a dependent variable as directly proportional in a titration when a
base is the independent variable.
•Students may be more familiar with an acid as an independent variable in a titration
experiment.
•This study suggests the importance of more explicit experiences with a base as an
independent variable in an experimental design involving titration in general chemistry
curriculum.
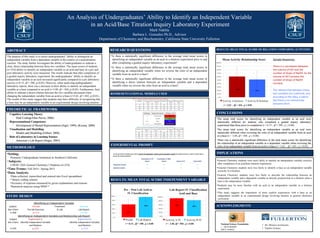
RESULTS: MEAN TOTAL SCORE INDEPENDENT VARIABLE
•The mean total scores for identifying an independent variable as an acid wereThe mean total scores for identifying an independent variable as an acid were
statistically different for students who completed a guided inquiry laboratorystatistically different for students who completed a guided inquiry laboratory
experiment than those prior to completion (experiment than those prior to completion (t = 8.15 , df = 298 , p ≥ 0.00).
•The mean total scores for identifying an independent variable as an acid wereThe mean total scores for identifying an independent variable as an acid were
statistically different when reversing the roles of an independent variable from an acidstatistically different when reversing the roles of an independent variable from an acid
to a base (to a base (t = 3.40, df = 504 , p ≤ 0.00).
•There was a statistically significant difference in the total mean scores for identifyingThere was a statistically significant difference in the total mean scores for identifying
the relationship of an independent variable to a dependent variable when reversing thethe relationship of an independent variable to a dependent variable when reversing the
roles of an independent variable from an acid to a base (roles of an independent variable from an acid to a base (t = 2.62 , df = 443 , p ≤ 0.01)..
t = 8.15 , df = 298 , p ≥ 0.00 t = 3.40, df = 504 , p ≤ 0.00
t = 2.62 , df = 443 , p ≤ 0.01
Identifying an Independent Variable
Subject Pre-lab Treatment Post Lab
Gen Chem Pre-lab Exercises SI Lab Lab Report
n=300 n=151 n=149
Identifying an Independent Variable and Relationship Lab Report
Subject Experiment A Experiment B
Gen Chem Identify Independent Variable
and Relation
Identify Independent Variable
and Relation
n=235 n=235 n=210
•Setting:
Primarily Undergraduate Institution in Southern California
• Subjects:
CHEM 120A General Chemistry I Students (n=254)
•Time Frame: Fall 2014 - Spring 2015
•Data Analysis:
•Data collected, transcribed and entered into Excel spreadsheet
• Binary coding scheme
•Accuracy of response measured by given explanations and reasons
•Statistical analyses using SPSSTM
Sample Responses:
There is a correlation between
the volume of HCl and the
number of drops of NaOH. As the
volume of HCl increase the
number of drops of NaOH
increase.
The relationship between these
two variables are scattered, and
according to the data, it seems
like there is no relationship
between them.
93%
60%