SlideShare a Scribd company logo
1 of 20
Download to read offline
 
 
1 
Antonia Warner 
Robyn Lesh 
Margaret Coad 
2.002 Lab M3­5 
Due: 5/9/2014 
 
Directionality and Strength in 3D Printed Specimens 
 
I. Introduction: 
3D Printing is a manufacturing technology that has gained much popularity in the past 25 
years.  Since its invention in the late 1980’s, it was primarily used as an industrial tool, but 
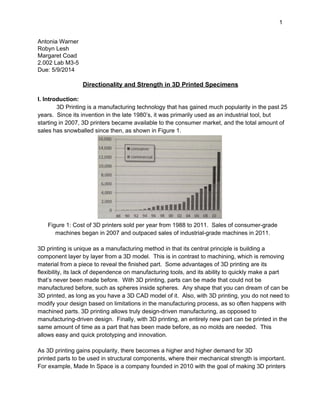
starting in 2007, 3D printers became available to the consumer market, and the total amount of 
sales has snowballed since then, as shown in Figure 1. 
 
Figure 1: Cost of 3D printers sold per year from 1988 to 2011.  Sales of consumer­grade 
machines began in 2007 and outpaced sales of industrial­grade machines in 2011. 
 
3D printing is unique as a manufacturing method in that its central principle is building a 
component layer by layer from a 3D model.  This is in contrast to machining, which is removing 
material from a piece to reveal the finished part.  Some advantages of 3D printing are its 
flexibility, its lack of dependence on manufacturing tools, and its ability to quickly make a part 
that’s never been made before.  With 3D printing, parts can be made that could not be 
manufactured before, such as spheres inside spheres.  Any shape that you can dream of can be 
3D printed, as long as you have a 3D CAD model of it.  Also, with 3D printing, you do not need to 
modify your design based on limitations in the manufacturing process, as so often happens with 
machined parts. 3D printing allows truly design­driven manufacturing, as opposed to 
manufacturing­driven design.  Finally, with 3D printing, an entirely new part can be printed in the 
same amount of time as a part that has been made before, as no molds are needed.  This 
allows easy and quick prototyping and innovation. 
 
As 3D printing gains popularity, there becomes a higher and higher demand for 3D 
printed parts to be used in structural components, where their mechanical strength is important. 
For example, Made In Space is a company founded in 2010 with the goal of making 3D printers 
 
 
2 
capable of printing in a zero­gravity environment so that they can be brought aboard spaceships 
and space stations.  These 3D printers in space could be used to print emergency repair parts 
for any structural component that might fail in space.  In applications like this, understanding the 
strength properties of 3D printed parts is crucial, and that is what we hoped to accomplish in this 
project. 
 
Our goal was to measure the strength of 3D printed parts, in both bending and tension tests, 
with a focus on comparing strengths of parts printed in different print layer orientations.  The fact 
that 3D printed parts are made in layers was the most interesting variable to us, and the one that 
we expected would most affect the mechanical properties of 3D printed parts. 
 
 
II. Background: 
 
Fused Deposition Modeling 
3D printed parts are made in four common ways: Stereolithography (SLA), Selective Laser 
Sintering (SLS), 3D Printing, and Fused Deposition Modeling (FDM).  SLA works by converting 
liquid resins into solids layer­by­layer using light.  SLS fuses powdered material together using a 
laser or electron beam.  3D Printing cures powdered material by local deposition of a binder. 
FDM extrudes heated thermoplastic material and deposits it directly on on the previous layer, 
where it solidifies immediately. 
 
Fused deposition modeling is the most commonly used method of 3D printing.  In contrast to the 
other methods, it uses production­grade thermoplastics, which makes its parts chemical and 
thermal change resistant, and mechanically strong.  Thermoplastic, most commonly ABS, is 
heated above its melting temperature and extruded through a small hole in the printhead.  The 
printhead moves in x and y to create the pattern required in each horizontal layer, and once the 
layer is complete, the table holding the part moves down one level so that a new layer can be 
printed directly on top of the other layers.  The entire chamber is kept at a temperature of 
approximately 200°F, just below the melting temperature of the plastic.  This temperature is high 
enough so that the layers don’t cool too quickly to be able to stick together, but low enough so 
that the whole piece does not melt. together 
 
Three Point Bending Tests 
In this experiment, we used three­point bending tests to determine the mechanical strength 
properties of our 3D printed samples.  A typical three­point bending test uses a small beam with 
a square cross­section, whose length is at least eight times its width, so that beam bending 
equations apply.  Figure 2 shows a diagram of the typical setup. 
 
 
3 
 
Figure 2: Typical three­point bending test setup.  A force is applied in the center of the beam, 
which is supported at its two ends.  The applied force and the deflection at the center of the 
beam are measured. 
 
The force and displacement at the center of the beam are typically measured and plotted against 
each other, as shown in Figure 3. 
 
Figure 3: Force versus displacement at the center of the beam in three point bending.  The 
structural stiffness K and the yield force Fe can be read from the graph. 
 
From the force versus displacement curve, the values of structural stiffness K (the slope of the 
linear region) and yield force Fe (the force at which the curve ceases to be linear) can be taken. 
Using beam bending equations, these numbers can used to calculate the beam material’s 
Young’s modulus E and yield stress σy, from the following equations. 
σy =Fe*L*h/(8I), and E = K*L^3/(48I). 
 
Tension Tests 
 
We also used tension tests to determine the mechanical properties of our specimens.  In a 
typical tension test, a dog bone­shaped specimen is made out of the desired material, and the 
specimen is gripped in the thick region on both ends and pulled apart.  The dog bone shape is 
typically used because the grips create extra stress in the material, which would cause failure at 
the grips almost every time if the specimen were of uniform cross section.  The cross section is 
 
 
4 
made larger at the grip location so that the stress at that location is less than the stress in the 
middle of the piece.  Typically, cross sectional areas should be at least four times larger at the 
grip location than in the center of the piece.  Figure 4 shows a typical tension test setup. 
 
Figure 4: Typical tension test setup.  Specimen is gripped at both ends and pulled apart.  Force 
and displacement between the two grips are measured. 
 
Force and displacement between the two grips is measured and used to create an engineering 
stress versus engineering strain graph, as shown in Figure 5. 
 
 
Figure 5: Typical stress versus strain graph for a tension test. 
 
From the stress versus strain graph, the values of yield stress σy (the stress at which the curve 
ceases to be linear) and Young’s Modulus E (the slope of the curve in the elastic region) can be 
taken. 


5 
III. Experimental Design: 
 
Our Printer 
Figure 6 shows the 3D printer that we used to print all of our specimens.  It is a Dimension BST 
1200es printer made by Stratasys, the company that holds the patent for Fused Deposition 
Modeling. 
 
Figure 6: The Dimension BST 1200es printer. 
 
The options available on the printer were two different layer resolutions and three different 
internal fill patterns.  We chose the finest layer resolution, which meant that the height of each 
layer in the z­direction was 0.01 in. 
 
The three different internal fill patterns available were solid, high density, and low density.  For 
most of our samples, we chose the low density fill pattern in order to save printing time, material, 
and cost.  For one sample for bending and one sample for tension, we chose the solid fill density 
so as to provide a control.  Figure 7 shows examples of what the two fill densities that we chose 
look like side by side. 
 
 
Figure 7: Upper sample is a cross­section of a beam printed with low density fill.  Lower sample 
is a cross­section of a beam printed with solid fill. 
 
 
6 
 
Our Test Apparatus 
Figures 8 and 9 show our test apparatuses for the bending and tension tests.  For bending, the 
deflection at the center of each beam was increased at a rate of 0.05 mm/s, and the resulting 
force was measured using the computer attached to the Instron machine.  For tension, the 
displacement between the two grips was increased at a rate of 5 mm/min for first few 
specimens and 2.5 mm/min for the rest of the specimens. 
 
 
Figure 8: Bending test apparatus. 
 
Figure 9: Tension test apparatus. 
 
Orientations of Our Samples 
Our bending specimens were square beams ⅜” x ⅜” x 3.5” long, and our tension specimens 
were dog bones with a thin middle section of diameter ⅜” and height 1.25”, and thick sections on 
the end of height 0.5” and diameter 1” cut off to a thickness of ½” so that they could be gripped 
by the jaws in the tension test machine. 
 
We chose to test three different printing orientations for each type of test.  We printed both our 
bending beams and our tension dog bones lying down, standing up, and at a 45 degree angle. 
Figure 10 shows some of our specimens as they came out of the printer.   
 
 
7 
 
Figure 10: Specimens on the printer tray freshly out of the printer.  Some are printed vertically, 
some are printed horizontally, and the rest are at a 45 degree angle with support material holding 
them up. 
 
Figures 11 and 12 show our naming conventions for our specimens.  For the bending 
specimens, in addition to the three print orientations, there were two ways to orient the 
horizontally printed specimens and the angled printed specimens in the test machine.  This gave 
us a total of five different orientations for the bending specimens and three for the tension 
specimens. 
 
Figure 11: Our naming conventions for the five bending specimens.  The “vertical” and 
“horizontal” specimens are printed the same way but oriented differently in the test machine. 
The “angled top” and “angled side” specimens have the same relationship. 
 
 
Figure 12: Our naming conventions for the three tension specimens. 


8 
Internal Fills of Our Samples 
Although in printing our samples, we specified a single internal structure for our parts, we found 
that the internal structure of the pieces depended on the direction that the parts were printed.  In 
general, if the cross­sectional area of the layer was large, the cross­hatching was large (typically 
squares of side length 4 mm), and if the cross­sectional area of the layer was small, the 
cross­hatching was small (typically squares of side length 1 mm).  This was not something that 
we expected or that the printer allowed us to control. 
 
For our bending specimens, the beams labeled “horizontal” and “vertical” had the large 
cross­hatching shown in Figure 13, which we called “sparse”.  The low density of these parts 
was evident in the fact that their weight was very low: 4.87 grams compared to the 8.06 grams of 
the solid control beam. 
 
 
Figure 13: “Sparse” fill density, which consists of squares of side length 4 mm.  “Horizontal” and 
“vertical” bending specimens had this fill. 
 
The bending beams labeled “square” had the small cross­hatching shown in Figure 14, which 
we called “dense” fill.  The higher density of these parts showed in their weight: 7.06 g. 
 
 
Figure 14: “Dense” fill density, which consists of squares of side length 1 mm. The “square” 
bending specimens had this fill. 
 
Finally, when we cut one of the bending beams labeled “angled top” or “angled side” open, the 
cross­section appeared solid, as shown in Figure 15.  This was reflected by the heavy weight of 
these pieces, 7.96 g, which was only 0.1 grams less than the solid horizontally printed piece.  As 
a result, for the sake of simplicity, we chose to approximate the angled specimens as “solid”. 


9 
Figure 15: “Solid” fill density.  The solid control specimen had this fill, as well as the “angled top” 
and “angled side” specimens. 
 
The variations in fill densities of our tension test specimens were even more unexpected.  Not 
only did the fill patterns vary between pieces printed in different orientations, but they also varied 
within single pieces.  For the “horizontal” tension piece, the entire sample had the “sparse” fill 
density shown in Figure 13 above, giving it a weight of 6.42 grams.  However, for the “vertical” 
and “angled” tension pieces, the large­diameter end sections had the large, 4mm square, 
crosshatching, while the small­diameter middle sections had the small, 1mm square, 
crosshatching.  This gave the “angled” specimens a weight of 6.88 grams, and the “vertical” 
specimens a weight of 7.45 grams.  This change within the piece is shown from various angles 
in Figure 16. 
 
 
Figure 16: Fill patterns for the “vertical” tension piece.  LEFT: fill pattern in the small diameter 
section, MIDDLE: transition between the two sections, RIGHT: fill in the large diameter section.   
 
 
IV. Hypothesis: 
 
Our hypothesis was that 3D printed pieces would be weaker between printed layers and 
stronger within the layers.  In other words, for our bending pieces, the more perpendicular the 
layers were to the applied bending moment, the stronger the pieces would be.  Thus, we 
expected that the sigma_y and E values for the bending pieces would be, in order from greatest 
to least: 
 Vertical = Horizontal > Angled Side = Angled Top > Square. 
 
For the tension pieces, we expected that, the more parallel the layers were to the direction of the 
force, the stronger the pieces.  Thus, we expected that the sigma_y and E values for the tension 
pieces would be, in order from greatest to least: 
 Horizontal > Angled > Vertical. 
 
There are two reasons that we expected 3D printed pieces to be weaker between the printed 
layers than within the layers.  The first is that we expected that two strands of plastic would stick 
together better if they were both warm than if one was cool and one was warm.  Thus, since the 
part was printed layer by layer, we expected that the extrusions within each layer would stick to 
 
 
10 
each other better than they would stick to the previous layer below them, since the previous layer 
had more time to cool. 
 
The second reason that we expected weakness between layers was that the extrusions were 
cylindrical, so at best, the area of contact for extrusions between layers was a single line along 
the length of two cylinders.  Instead, within layers, the extrusion itself held areas together, giving 
a much larger area of contact. 
 
 
V. Bending Test Results:  
 
Below are the various applied force vs. displacement graphs generated from our eleven tests of 
bending specimens in various orientations. For these specimens, we were only able to directly 
compare the yield forces and spring constants for those pieces with the same internal density. 
This was due to the fact that while all the parts had the same dimensions, only a couple had the 
same moments of inertia.  
 
Dense Specimen: The bending test results for the square specimens are shown in Figure 17. 
Due to the fact that we only had one type of specimen that had dense fill, we were unable to 
directly compare it to any other pieces.   
 
Figure 17: Bending test results of two specimens printed vertically, termed “square” due to their 
square layers. No plasticity was observed in these specimens; they were loaded elastically to an 
average yield force of 271.7 N before failure. The average spring constant found in these tests 
was 167.36 kN/m.  
 
Sparse Specimens: The data from the “vertical” and “horizontal” specimens, those termed 
“sparse” are shown in Figures 18 and 19.  From this data, we observe that orienting layers 
 
 
11 
vertically results in a higher spring constant and yield load than orienting layers horizontally. This 
makes sense intuitively due to the relative ease in bending a beam with a larger cross sectional 
area perpendicular to the direction of force application.  
 
 
Figure 18: One vertical specimen was tested, instead of the intended two due to experimental 
error. This test yielded a spring constant of 160.14 kN/m and a yield force of 366 N. This material 
was observed to not be very hard due to the fact that it was not very resistant to plastic 
deformation.  
 
 
Figure 19: Three tests of horizontally printed specimens yielded an average spring constant of 
140.42 kN/m and an average yield force of 273.03 N.  


12 
Solid Specimens: The data from the solid beam and the angled pieces are shown in Figures 20, 
21, and 22.  For the angled pieces, we found that the spring constants and yield forces were 
close to identical, showing that the orientation of a 45 degree angled plane has negligible effect 
on the performance of the piece in bending. The solid horizontal piece had a much greater spring 
constant and yield force than either of the angled pieces.   
 
 
Figure 20: Due to the price of the solid parts, we printed only one solid beam horizontally. This 
tests resulted in a spring constant of 214.19 kN/m and a yield force of 394.6 N. 
 
   
Figure 21: Two tests of specimens printed at a 45 degree angle yielded an average spring 
constant of 171.34 kN/m and an average yield force of 318.75 N. These angled pieces were 
placed with the angle in the x­z plane with the angle visible on the side of the piece.  
 
 
13 
 
 
Figure 22: Two tests of specimens printed at a 45 degree angle yielded an average spring 
constant of 172.16 kN/m and an average yield force of 328.2 N. These angled pieces were 
placed with the angle in the x­y plane so that the angle was visible on the top of the piece.  
 
 
VI. Bending Test Analysis:  
 
In order to be able to directly compare the behavior of all of the specimens subjected to 
three­point bending, we had to find their material properties ­ specifically the Young’s modulus 
(E) and the yield stress (σy). This was accomplished using the following equations:  
 
 
By substituting in the spring constant (K) and yield force (Fe) found graphically, and the moment 
of inertia (I) value for each specimen, we could obtain E and σy.  
 
In order to find the moment of inertia for each specimen, we made a number of approximations. 
For the sparsely filled pieces, we chose to approximate them as a shell with a certain wall 
thickness, as shown in Figure 23. 


14 
   
Figure 23: The cross section shown at the left depicts the cross­section chosen to approximate 
the structure of the sparse specimens. The thickness of the top and bottom parts of the shell 
was 0.0445 inches and the thickness of the left and right walls was 0.0615 inches. The cross 
section at the right shows the cross section of the solid test specimens. Both cross sections 
have outer dimensions of ⅜ in. by ⅛ in.  
 
Using these cross sections and dimensions, we were able to find the moments of inertia of the 
solid and sparse pieces as follows:  
Ishell = (1/12) [b*h3 
­ (b ­ t1)*(h ­ t2)3
] 
  t1 = 0.0615 in 
   t2 = 0.0445 in 
Ishell = 4.8156 x 10­10 
 m4 
 
Isolid = (1/12) b*h3 
Isolid = 6.8593 x 10­10 
 m4 
 
Due to the fact that the dense test piece was an irregular shape, we were unable to find an 
equation to describe its moment of inertia. In order to approximate it however, we chose to use a 
linear interpolation between the shell and solid moments of inertia, scaling by the masses of the 
test pieces. 
  
mshell  = 4.87 g (msolid ­  mdense )/(msolid ­  mshell ) = .29 
  msolid = 7.96 g .29 * (Isolid ­ Ishell) = .595252 x 10­10 
 m4 
  mdense  = 7.06 g  Idense = Isolid ­ (.595252 x 10­10 
) 
Idense = 6.26405 x 10­10 
 m4
 
 
Having acquired these approximate moments of inertia, we were able to use the equations 
shown above to generate the following table:  
 
Beam Orientation   E (GPa)  σy (MPa) 
Angled Top (solid)  2.3025  42.16 
Angled Side (solid)  2.3135  43.41 
Horizontal (solid)  2.8783  52.19 
 
 
15 
Horizontal (shell)  2.6878  51.44 
Vertical (shell)  3.0653  68.95 
Square (dense)  2.4627  39.35 
 
Our experimentally determined value for the Young’s Modulus (E) ranged from 2.3025 GPa to 
3.0653 GPa (with an average of 2.618 GPa), while our yield stress value ranged from 39.35 MPa 
to 68.95 MPa (with an average of 53 MPa). The given values for the Flexural Modulus and 
Flexural Strength of the plastic we used were 2.25 GPa, and 53 MPa respectively. These values 
were close to the range of values we found for our specimens, thereby validating the accuracy of 
our test results.  
From these various tests, several trends in our data became apparent. First of all, our 
hypothesis for the bending yield stress was shown to be true, in that the more perpendicular the 
printed layers were to the direction of force application the stronger the beam. In addition, we 
found that for the horizontally printed specimens, the vertically oriented layers were stronger than 
those with layers placed horizontally. From highest to lowest yield stress, the strongest 
specimens were: Vertical, Horizontal, Angled, Square.  
In regards to our bending elastic modulus, we found our hypothesis to be mostly validated. The 
vertical layers were once again stronger than the horizontal layers, and both of these were 
stronger than the square and angled layers. However, the data suggests that the square 
specimens had a greater elastic modulus than the angled pieces. This is contrary to what we 
had expected due to the fact that the angled specimens were more perpendicular to the direction 
of force application than the square specimens. We are unsure what could have caused this 
result. There is a possibility that it could be valid and be due to some characteristic of 3D printed 
specimens, but based upon a force analysis it seems improbable, as the square cross­sections 
would shear more easily than the angled layers.  
As a result, in the future we would like to perform further bending tests on various specimens to 
determine their elastic moduli, focusing on the pieces with square cross­sections. One of the 
key methods of finding more accurate results in this area would be to create specimens with a 
uniform cross­section, rather than the three different types used in these experiments. For the 
test results above, the square specimen was the only one for which we used the linear 
interpolation of the moment of inertia, and so this method would have been the source of this 
discrepancy between the results and our hypothesis. Using specimens with the same cross 
section would remove the need for scaling by moment of inertia, and so would yield a more 
accurate value of the elastic modulus and yield stress for the square pieces. The other two 
moment of inertia calculations required less approximate than the linear interpolation, and so we 
considered them to be more valid results, but removing the need for moment of inertia 
approximation would also improve those values as well.  


16 
VII. Tension Test Results:  
 
Our tension tests yielded graphs relating force and head displacement of the jaws, as shown in 
Figure 24.  
Figure 24: Force vs displacement data graphs. 
Note: In this figure, each type of specimen responded to loading in the same way. The 
vertical specimens both had a linear initial loading region and then the graphs bent at 
around 500N of loading to another linear region. The angled specimens responded fairly 
linearly to loading and the horizontal specimens both had a curved loading response. 
Also note that these displacements are measured by the movement of the grips and so 
includes stretching of the larger top and bottom region of the pieces or slipping of the 
gripps. For future calculations we use the extensometer displacement because this 
measured the elongation of the uniform cross­section in middle area of the pieces. 
 
To analyze our data we looked at the force data and corresponding extensometer readings. 
Since our tension specimens varied in fill density, the area by which we divided the force to get 
stress varied between the pieces. For the young’s modulus, we approximated the 
cross­sectional area of the thin center area as Adense (45mm2
) for the vertical pieces, Ashell 
(39mm2
) for the horizontal pieces and Amedium (43mm2
) for the angled pieces, where Amedium was 
a linear interpolation between the two other areas using the masses. These areas were chosen 
because they corresponded to the cross sectional area of the center region ­ whose elongation 
was measured using the extensometer.  
 
 
17 
However, an additional problem with the tension specimens became apparent during testing. 
Since the ends of the tension pieces were close to hollow (due to the lattice structure) it was 
possible to crunch them too tight in the grips of the tension testing machine. This damaged the 
structure of the piece, weakening it at that location, and creating a stress concentration at that 
location. Thus, the pieces did not fail at the intended location, ie. in the middle of the part with 
uniform cross­sectional area.  
 
As a result, for the yield stress, we chose areas that reflected the cross sectional area at the 
point of failure, where the yield began to occur, as shown in Figure 25. These areas were 
approximated as Avertical = 89mm2
 and Ahorizontal = Aangled = 89mm2
.  
 
 
Figure 25: Break surfaces. Dashed red lines indicate initial failure plane 
Print orientation: a) Horizontal, b) Vertical, c) Angled 
 
Using these areas we found the stress from the force measurements and plotted Stress vs. 
Strain curves to find the young’s modulus, as shown in Figure 26. 


18 
   
Figure 26: Linear Regions of Stress vs. Strain plots. 
Note: We assume the extensometer slipped for one for one of the vertical pieces because the 
extensometer read negative values for most of the test and is therefore not included on the 
vertical specimens graph. 
 
The young’s modulus acquired from these graphs and the yield stress found from the three yield 
“planes” of our three different specimen orientations are as follows: 
 
Beam Orientation   E (GPa)  σy (MPa) 
Horizontal  2.84  25.7 
Angled  2.97  9.9 
Vertical  3.16  5.45 
 
 
VIII. Tension Test Analysis: 
 
As we hypothesized, the horizontally printed pieces were the strongest of the tension specimens 
in terms of the yield stress, with the angled samples being the second strongest and the vertical 
pieces being the weakest. 
 
Initially, we found it odd that the elastic modulus was the greatest for the vertical piece but on 
further consideration this fits with the properties that arise from the process of 3D printing. This 
result implies that for the same force the vertical pieces will elongate less, and therefore that the 
interface between the layers is stiffer than the layers of printed material. Ultimately, though the 
interface between the layers is not as able to withstand stresses as the printed material (is less 
tough), and so exhibits a lower yield stress.  
  
The results of our tension tests must be taken with a grain of salt however. Unanticipated fill 
density complications made our specimens into structures significantly more complex than our 
 
 
19 
intended sample structures. This necessitated that we scale the values achieved directly, by the 
cross­sectional areas of the specimens in order to achieve the values of yield stress and 
young’s modulus tabulated above. These areas were gross approximations and could have 
severely affected the values found for the young’s modulus and yield stress of our specimens, 
and therefore our interpretations of which specimens appeared stronger than others.  
 
VII. Future tests: 
 
The key direction in which we would like to extend our experimentation in this field is by removing 
the need for much of the data processing that we performed. The key difficulty that we 
experienced in both our bending and tension tests, primarily with our tension tests, was the fact 
that the printed pieces had a variety of internal structures, as opposed to a single type. This 
required us to perform a series of approximations of moments of inertia for bending and areas 
for tension tests, which in the case of our tension tests was often a gross approximation. 
Additionally, the variety of internal densities in the tension specimens resulted in the pieces failing 
at the transitional point between the part of the piece gripped by the jaws and the region in which 
it was supposed to fail.  
 
There are a number of ways in which we can rectify the problems that we experienced with the 
varying internal densities of the specimens. One method would be to specify the parts to be 
printed as shells, with no internal lattice­work so that the only difference between the specimens 
would arise from the print orientations. If the print orientations resulted in a different wall 
thickness, scaling by this area is much more predictable, and therefore accurate, than 
estimating the cross­sectional area of a lattice or the moment of inertia of a specimen containing 
a lattice.  
 
A second method of testing that would ameliorate this problem would be to print solid 
specimens, which would have a similar effect to printing hollow specimens. Printing solid 
specimens of the same dimensions as the samples used in these tests would not be 
economical, due to the high price of 3D printing, and so we could instead use flat specimens that 
are rectangular in shape. A further advantage of the solid specimens would be that they would 
remove the problem of the jaws crushing the tension specimens and creating a stress 
concentration factor at the point of contact, which was the likely cause of the pieces failing along 
the jaws.  
 
Yet another way that we could potentially generate more accurate values for the material 
properties of the parts by performing a compression test rather than a tension test. The 
compression specimens would not require parts able to be gripped by the vise, and so would 
prevent a change in the internal density of the specimen. Both a young’s modulus and a 
compressive yield stress could be generated for these tests as well. Additionally, the 
compression samples would have the benefit of being less expensive and faster to print due to 
the less complicated geometry.  


20 
One final test that we would like to perform in the future is to vary the angle of the angled bending 
specimens from 45 degrees. We would expect that varying the angle of both the specimens with 
the angle visible on the top of the piece and on the side would cause them to approach the 
behavior of either the horizontal, vertical, or square specimens. Varying the angle of the angled 
side specimens, would equate to progressing from the horizontal specimen to the square 
specimen, and varying the angle of the angled top specimens would equate to progressing from 
the vertical specimens to the square specimens. It would be interesting to discover if the 
specimens do exhibit this behavior, and then to graphically relate the angle between the layers 
with the yield force and young’s modulus for this variety of angles.  
  
 
VIII. Conclusion: 
Samples created using Fused Deposition Modeling contain different internal geometries based 
upon the direction in which the layers of plastic were constructed. Each of the tests that we 
performed was designed to give us insight into how these 3D printed specimens behaved when 
subjected to tension or bending forces when they were oriented differently. For each test, we 
found the yield stress and the young’s modulus, and used these material properties to compare 
the performance of each type of orientation. Overall, we found that the bending tests validated 
our hypothesis that the more perpendicular the layers are to the direction of force application, the 
higher the yield stress was. The relative values of the young’s also followed this trend, with the 
exception of the specimens we termed “square”. This exception is not one we can satisfactorily 
explain, and so would be one of the subjects of future testing. For the tension specimens, 
several problems arose as a result of unanticipated variations in internal density caused by the 
deposition machine. However, the relative values of the yield stress validated what we expected 
in that the parallel the layers were to the direction of force application, the higher the yield stress. 
In the case of the young’s modulus on the other hand, we found that the more perpendicular the 
layers were to the direction of force application the higher the young’s modulus was. Future 
experimentation in this field would likely focus on testing specimens with uniform internal 
structure in order to yield more accurate results for both bending and tension tests by removing 
the need for approximations in the processing of the data.   


More Related Content

What's hot

White paper 3d_printer_buyers_guide_09.21.16_usen_web
White paper 3d_printer_buyers_guide_09.21.16_usen_webWhite paper 3d_printer_buyers_guide_09.21.16_usen_web
White paper 3d_printer_buyers_guide_09.21.16_usen_webYugandhar Nambala
 
MODERN RAPID 3D PRINTER - A DESIGN REVIEW
MODERN RAPID 3D PRINTER - A DESIGN REVIEWMODERN RAPID 3D PRINTER - A DESIGN REVIEW
MODERN RAPID 3D PRINTER - A DESIGN REVIEWIAEME Publication
 
The Moon Shot Project Business Plan
The Moon Shot Project Business PlanThe Moon Shot Project Business Plan
The Moon Shot Project Business PlanJuliet John
 
Pre-Print Check Your 3D Models
Pre-Print Check Your 3D ModelsPre-Print Check Your 3D Models
Pre-Print Check Your 3D ModelsRedProto
 
CAD and VIRTUAL REALITY
CAD  and VIRTUAL REALITYCAD  and VIRTUAL REALITY
CAD and VIRTUAL REALITYDeepak Rotti
 
Z Corp Z650 And Family
Z Corp Z650 And FamilyZ Corp Z650 And Family
Z Corp Z650 And FamilyIan_Scribner
 
Fashion Design & The Computer
Fashion  Design &  The  ComputerFashion  Design &  The  Computer
Fashion Design & The Computerdglsdn23
 
Disruptive technologies project
Disruptive technologies projectDisruptive technologies project
Disruptive technologies projectsabrena moore
 
IRJET- Analysis and Review of Rapid Prototyping Technology, & Study of Materi...
IRJET- Analysis and Review of Rapid Prototyping Technology, & Study of Materi...IRJET- Analysis and Review of Rapid Prototyping Technology, & Study of Materi...
IRJET- Analysis and Review of Rapid Prototyping Technology, & Study of Materi...IRJET Journal
 
3D Systems White Paper 3D printer buyer guide
3D Systems White Paper 3D printer buyer guide3D Systems White Paper 3D printer buyer guide
3D Systems White Paper 3D printer buyer guideQuoc Tuan Duong, ing.
 
Marketing Plan: Cube and CubeX 3D Printers
Marketing Plan: Cube and CubeX 3D PrintersMarketing Plan: Cube and CubeX 3D Printers
Marketing Plan: Cube and CubeX 3D PrintersMartina Ascoli
 
New - 3D Printing World Think board - Architecture -Construction Design even...
New - 3D Printing World Think board - Architecture -Construction  Design even...New - 3D Printing World Think board - Architecture -Construction  Design even...
New - 3D Printing World Think board - Architecture -Construction Design even...Vijay Krishnan
 
3d printed building technology
3d printed building technology3d printed building technology
3d printed building technologyvarun km
 
3-D PRINTING AS A CONSTRUCTION TECHNIQUE
3-D PRINTING AS A CONSTRUCTION TECHNIQUE3-D PRINTING AS A CONSTRUCTION TECHNIQUE
3-D PRINTING AS A CONSTRUCTION TECHNIQUESwaraj Srivastava
 
3D Printing: Preview the Endless Possibilities
3D Printing: Preview the Endless Possibilities3D Printing: Preview the Endless Possibilities
3D Printing: Preview the Endless PossibilitiesCrowdsourcing Week
 

What's hot (19)

White paper 3d_printer_buyers_guide_09.21.16_usen_web
White paper 3d_printer_buyers_guide_09.21.16_usen_webWhite paper 3d_printer_buyers_guide_09.21.16_usen_web
White paper 3d_printer_buyers_guide_09.21.16_usen_web
 
MODERN RAPID 3D PRINTER - A DESIGN REVIEW
MODERN RAPID 3D PRINTER - A DESIGN REVIEWMODERN RAPID 3D PRINTER - A DESIGN REVIEW
MODERN RAPID 3D PRINTER - A DESIGN REVIEW
 
The Moon Shot Project Business Plan
The Moon Shot Project Business PlanThe Moon Shot Project Business Plan
The Moon Shot Project Business Plan
 
Pre-Print Check Your 3D Models
Pre-Print Check Your 3D ModelsPre-Print Check Your 3D Models
Pre-Print Check Your 3D Models
 
CAD and VIRTUAL REALITY
CAD  and VIRTUAL REALITYCAD  and VIRTUAL REALITY
CAD and VIRTUAL REALITY
 
Z Corp Z650 And Family
Z Corp Z650 And FamilyZ Corp Z650 And Family
Z Corp Z650 And Family
 
THURMER 27 IDA notes
THURMER 27 IDA notesTHURMER 27 IDA notes
THURMER 27 IDA notes
 
Fashion Design & The Computer
Fashion  Design &  The  ComputerFashion  Design &  The  Computer
Fashion Design & The Computer
 
Disruptive technologies project
Disruptive technologies projectDisruptive technologies project
Disruptive technologies project
 
3 d printing revised
3 d printing revised3 d printing revised
3 d printing revised
 
IRJET- Analysis and Review of Rapid Prototyping Technology, & Study of Materi...
IRJET- Analysis and Review of Rapid Prototyping Technology, & Study of Materi...IRJET- Analysis and Review of Rapid Prototyping Technology, & Study of Materi...
IRJET- Analysis and Review of Rapid Prototyping Technology, & Study of Materi...
 
3D Systems White Paper 3D printer buyer guide
3D Systems White Paper 3D printer buyer guide3D Systems White Paper 3D printer buyer guide
3D Systems White Paper 3D printer buyer guide
 
Computer graphics
Computer graphicsComputer graphics
Computer graphics
 
Marketing Plan: Cube and CubeX 3D Printers
Marketing Plan: Cube and CubeX 3D PrintersMarketing Plan: Cube and CubeX 3D Printers
Marketing Plan: Cube and CubeX 3D Printers
 
New - 3D Printing World Think board - Architecture -Construction Design even...
New - 3D Printing World Think board - Architecture -Construction  Design even...New - 3D Printing World Think board - Architecture -Construction  Design even...
New - 3D Printing World Think board - Architecture -Construction Design even...
 
3d printed building technology
3d printed building technology3d printed building technology
3d printed building technology
 
3-D PRINTING AS A CONSTRUCTION TECHNIQUE
3-D PRINTING AS A CONSTRUCTION TECHNIQUE3-D PRINTING AS A CONSTRUCTION TECHNIQUE
3-D PRINTING AS A CONSTRUCTION TECHNIQUE
 
3D printer construction
3D printer construction3D printer construction
3D printer construction
 
3D Printing: Preview the Endless Possibilities
3D Printing: Preview the Endless Possibilities3D Printing: Preview the Endless Possibilities
3D Printing: Preview the Endless Possibilities
 

Similar to Final2.002Report

3d prinitng presentation
3d prinitng presentation3d prinitng presentation
3d prinitng presentationAkshitGupta124
 
[Project] Study of current initiatives of additive manufacturing in India and...
[Project] Study of current initiatives of additive manufacturing in India and...[Project] Study of current initiatives of additive manufacturing in India and...
[Project] Study of current initiatives of additive manufacturing in India and...Biswadeep Ghosh Hazra
 
Marvelous 3D Printing Trends Of 2019
Marvelous 3D Printing Trends Of 2019Marvelous 3D Printing Trends Of 2019
Marvelous 3D Printing Trends Of 2019Animation Kolkata
 
BA 453 Business Strategy & Planning Spring 2014 1 .docx
BA 453 Business Strategy & Planning  Spring 2014 1   .docxBA 453 Business Strategy & Planning  Spring 2014 1   .docx
BA 453 Business Strategy & Planning Spring 2014 1 .docxikirkton
 
3D PRINTER Seminar fair report (pdf)
3D PRINTER Seminar fair report (pdf)3D PRINTER Seminar fair report (pdf)
3D PRINTER Seminar fair report (pdf)Arjun Raveendran
 
What is 3D Printer?
What is 3D Printer?What is 3D Printer?
What is 3D Printer?Umur ÖZ
 
IRJET- Comparative Study of 3D Printer
IRJET- Comparative Study of 3D PrinterIRJET- Comparative Study of 3D Printer
IRJET- Comparative Study of 3D PrinterIRJET Journal
 
Report on 3D printing , types, application, challenges
Report on 3D printing , types, application, challengesReport on 3D printing , types, application, challenges
Report on 3D printing , types, application, challengesRajat srivastav
 
Additive_Manufacturing
Additive_ManufacturingAdditive_Manufacturing
Additive_ManufacturingAnirbanDatta49
 
3D Printing Additive Manufacturing
3D Printing Additive Manufacturing3D Printing Additive Manufacturing
3D Printing Additive ManufacturingGaurav Bhut
 
3D Printing Additive Manufacturing
3D Printing Additive Manufacturing3D Printing Additive Manufacturing
3D Printing Additive ManufacturingGaurav Bhut
 
3D Printing Of Buildings in Construction Industry
3D Printing Of Buildings in Construction Industry3D Printing Of Buildings in Construction Industry
3D Printing Of Buildings in Construction IndustryIRJET Journal
 
3D Printing Technology In Paharmaceuticals
3D Printing Technology In Paharmaceuticals3D Printing Technology In Paharmaceuticals
3D Printing Technology In PaharmaceuticalsMalay Jivani
 
3D PRINTING MARKET  TO BOOM,WILL BE WORTH £8.6 BN BY 2020
3D PRINTING MARKET  TO BOOM,WILL BE  WORTH £8.6 BN BY 20203D PRINTING MARKET  TO BOOM,WILL BE  WORTH £8.6 BN BY 2020
3D PRINTING MARKET  TO BOOM,WILL BE WORTH £8.6 BN BY 2020Allied Market Research
 
3-D Printing_feb_13_2014
3-D Printing_feb_13_20143-D Printing_feb_13_2014
3-D Printing_feb_13_2014James Sutter
 
3d Printinng
3d Printinng3d Printinng
3d Printinngalive3
 

Similar to Final2.002Report (20)

3d prinitng presentation
3d prinitng presentation3d prinitng presentation
3d prinitng presentation
 
What is 3 d printing.docx
What is 3 d printing.docxWhat is 3 d printing.docx
What is 3 d printing.docx
 
[Project] Study of current initiatives of additive manufacturing in India and...
[Project] Study of current initiatives of additive manufacturing in India and...[Project] Study of current initiatives of additive manufacturing in India and...
[Project] Study of current initiatives of additive manufacturing in India and...
 
Marvelous 3D Printing Trends Of 2019
Marvelous 3D Printing Trends Of 2019Marvelous 3D Printing Trends Of 2019
Marvelous 3D Printing Trends Of 2019
 
BA 453 Business Strategy & Planning Spring 2014 1 .docx
BA 453 Business Strategy & Planning  Spring 2014 1   .docxBA 453 Business Strategy & Planning  Spring 2014 1   .docx
BA 453 Business Strategy & Planning Spring 2014 1 .docx
 
3D PRINTER Seminar fair report (pdf)
3D PRINTER Seminar fair report (pdf)3D PRINTER Seminar fair report (pdf)
3D PRINTER Seminar fair report (pdf)
 
What is 3D Printer?
What is 3D Printer?What is 3D Printer?
What is 3D Printer?
 
3 D Printing Documentation
3 D Printing Documentation3 D Printing Documentation
3 D Printing Documentation
 
IRJET- Comparative Study of 3D Printer
IRJET- Comparative Study of 3D PrinterIRJET- Comparative Study of 3D Printer
IRJET- Comparative Study of 3D Printer
 
3 d printing
3 d printing3 d printing
3 d printing
 
Report on 3D printing , types, application, challenges
Report on 3D printing , types, application, challengesReport on 3D printing , types, application, challenges
Report on 3D printing , types, application, challenges
 
Additive_Manufacturing
Additive_ManufacturingAdditive_Manufacturing
Additive_Manufacturing
 
3 d printing uk
3 d printing uk3 d printing uk
3 d printing uk
 
3D Printing Additive Manufacturing
3D Printing Additive Manufacturing3D Printing Additive Manufacturing
3D Printing Additive Manufacturing
 
3D Printing Additive Manufacturing
3D Printing Additive Manufacturing3D Printing Additive Manufacturing
3D Printing Additive Manufacturing
 
3D Printing Of Buildings in Construction Industry
3D Printing Of Buildings in Construction Industry3D Printing Of Buildings in Construction Industry
3D Printing Of Buildings in Construction Industry
 
3D Printing Technology In Paharmaceuticals
3D Printing Technology In Paharmaceuticals3D Printing Technology In Paharmaceuticals
3D Printing Technology In Paharmaceuticals
 
3D PRINTING MARKET  TO BOOM,WILL BE WORTH £8.6 BN BY 2020
3D PRINTING MARKET  TO BOOM,WILL BE  WORTH £8.6 BN BY 20203D PRINTING MARKET  TO BOOM,WILL BE  WORTH £8.6 BN BY 2020
3D PRINTING MARKET  TO BOOM,WILL BE WORTH £8.6 BN BY 2020
 
3-D Printing_feb_13_2014
3-D Printing_feb_13_20143-D Printing_feb_13_2014
3-D Printing_feb_13_2014
 
3d Printinng
3d Printinng3d Printinng
3d Printinng
 

Final2.002Report