SlideShare a Scribd company logo
1 of 11
Download to read offline
2013
http://informahealthcare.com/phd
ISSN: 1083-7450 (print), 1097-9867 (electronic)
Pharm Dev Technol, Early Online: 1–11
! 2013 Informa Healthcare USA, Inc. DOI: 10.3109/10837450.2013.795169
ORIGINAL ARTICLE
Preparation, in vitro evaluation and statistical optimization of
carvedilol-loaded solid lipid nanoparticles for lymphatic absorption
via oral administration
Mansi K. Shah, Parshotam Madan, and Senshang Lin
College of Pharmacy and Health Sciences, St. John’s University, Queens, NY, USA
Abstract
Carvedilol-loaded solid lipid nanoparticles (SLNs) were prepared using solubility parameter ()
to select the lipid, and hot homogenization to fabricate SLNs. The effect of concentration of
Compritol 888 ATO (COMP) and Poloxamer 188 (P-188) on the particle size of blank SLNs was
studied using the design of experiments. Further narrow concentration range of COMP and P-
188 was selected and carvedilol-loaded SLNs were prepared to obtain an optimized formulation
which was lyophilized (L-SLNs), transformed into enteric compression-coated tablet and
evaluated for drug release, X-ray diffraction and cellular uptake mechanism. COMP was chosen
as lipid due to its least value of D with carvedilol. The optimized formulation (7.5% COMP,
5.0% P-188 and 1.11% carvedilol) had 161 nm particle size and 94.8% entrapment efficiency.
The enteric-coated carvedilol-loaded SLNs tablet protected carvedilol from acidic environment
and similar prolonged release profiles were obtained from L-SLNs, core tablet and enteric-
coated tablet. Absence of crystalline carvedilol XRD peak indicated the presence of amorphous
carvedilol in SLNs. Higher carvedilol uptake from SLNs compared to drug solution in the Caco-2
cell line exhibited a potential prolonged drug release. Moreover, upon cellular uptake, SLNs
could then enter the lymphatic system which will avoid first pass metabolism and hence higher
oral bioavailability.
Keywords
Caco-2 cells, carvedilol, cellular uptake
mechanism, design of experiments, oral
drug delivery, solid lipid nanoparticles
History
Received 22 January 2013
Revised 7 April 2013
Accepted 9 April 2013
Published online 22 May 2013
Introduction
The past few decades have seen significant advances in drug
delivery technologies. Oral drug delivery is not only the largest
and the oldest segment of the entire drug delivery market; it is
also the fastest growing and the most preferred route for drug
administration. Because a large number of recently developed
chemical entities have poor aqueous solubility, many formulation
approaches, such as salt formation, co-solvent, size reduction,
complexation and lipid-based drug delivery systems have been
evaluated to increase their bioavailability1
. Lipophile delivery
through oral route is extremely challenging because upon
introduction into the aqueous biological environments, lipophilic
molecules exhibit instability, precipitation, food interactions, non-
specific targeting and toxic effects2
. According to
Biopharmaceutical Drug Disposition Classification System
(BDDCS), based upon the prediction of drug disposition by
interplay of transport, absorption and elimination, majority of the
BCS Class II drugs not only have poor aqueous solubility but also
have extensive first pass metabolism causing additional factor for
poor bioavailability3,4
. Therefore, the development of a delivery
system, which not only regulates the release of the drug but also
avoids the first pass metabolism, is needed to enhance the overall
therapeutic outcomes.
Utilization of solid lipid nanoparticles (SLNs) to regulate the
release of drug has been evaluated in oral administration route5
.
It has been reported that oral bioavailability can be increased
by encapsulating drug into SLNs where uptake of drug occurs
through the lymphatic system6,7
. SLNs generally are spherical
in shape and are comprised of a solid lipid core stabilized by
a surfactant interfacial region which combines the advantages
of lipid emulsion systems and polymeric nanoparticle systems
while overcoming the temporal and in vivo stability issues that
are exhibited by other drug delivery approaches8–10
. SLNs are
biocompatible and biodegradable and can be produced easily
without the use of organic solvents. In addition, due to solid
nature of the lipid matrix, SLNs can be lyophilized and
transformed into the conventional oral solid dosage forms such
as tablets and capsules, thereby enhancing stability and patient
compliance8–10
.
In order to evaluate the features of regulating the release of
drug and avoiding the first pass metabolism through lymphatic
uptake offered by SLNs6,7
, carvedilol was selected as the model
drug. The properties of carvedilol, e.g. high first pass metabolism
and low dose as well as its need for long-term treatment and
repetitive dosing, make this drug an interesting candidate for oral
administration where the release of the drug should be controlled
and the first pass metabolism could be avoided to increase overall
bioavailability by promoting lymphatic uptake of carvedilol-
loaded SLNs. Carvedilol (log P ¼ 4.2) is practically insoluble in
water, in gastric fluids (pH 1.1) and in intestinal fluids (pH 7.5).
Although carvedilol is completely absorbed from the gastrointes-
tinal tract after ingestion of the conventional tablets, the systemic
Address for correspondence: Senshang Lin, PhD, College of Pharmacy
and Health Sciences, St. John’s University, Queens, NY, USA. Tel: (718)
990 5344. Fax: (718) 990 1877. E-mail: linse@stjohns.edu
PharmaceuticalDevelopmentandTechnologyDownloadedfrominformahealthcare.comby24.185.57.10on05/23/13
Forpersonaluseonly.
availability is about 25% due to its metabolism in liver. Therefore,
carvedilol-loaded SLNs using solid safe lipid materials, low
amount of surfactant and its feasibility of being transformed into
tablets as a dosage form were evaluated in this investigation.
Various lipids were screened and selected based upon the
solubility parameter and then high-shear homogenization was
employed to fabricate blank SLNs for evaluation of such
formulation variables as concentrations of lipid and surfactant
on the size of the nanoparticles. Based upon the results of particle
size obtained from blank SLNs, narrow range of lipid and
surfactant concentrations were further selected to produce
targeted nanoparticles (less than 200 nm) and carvedilol-loaded
SLNs were prepared using the design of experimental approach.
Physicochemical properties of carvedilol-loaded SLNs, such as
particle size, drug entrapment efficiency and in vitro drug release
kinetic were evaluated and used to obtain an optimized formu-
lation. The optimized formulation was then enteric compression
coated and the powder XRD study was performed to evaluate the
nature of the drug present in the prepared SLNs. In vitro cellular
uptake studies of carvedilol from SLNs as well as from carvedilol
solution and physical mixture of components of SLNs as controls
were performed using Caco-2 cell line as an indirect indication of
lymphatic absorption.
Materials and methods
Materials
Carvedilol was obtained as a free sample from Caraco
Pharmaceuticals (Detroit, MI). Compritol 888 ATO (COMP)
was obtained as a gift sample from Gattafosse (Paramus, NJ).
Monobasic potassium phosphate, dibasic potassium phosphate,
Poloxamer 188 (P-188), polyethylene glycol 400 (PEG) and
HPLC grade methanol were purchased from VWR International
(West Chester, PA). Starch 1500 and Eudragit L100-55 were kind
gifts from Colorcon (Harleysville, PA) and Evonik Industries
(Piscataway, NJ), respectively. Dialysis membrane (spectra/Por
dialysis memberane MWCO: 6–8000) was obtained from
Spectrum Labs (Rancho Dominguez, CA). The human umbilical
vein endothelial cell (HUVEC) line was obtained from American
Type Culture Collection (ATCC, Manassas, VA). Dulbecco’s
Modified Eagle’s Medium (DMEM/F12) with L-glutamine and
15 mM HEPES, fetal bovine serum, 1% streptomycin and trypsin
were obtained from Sigma-Aldrich (St. Louis, MO). All chem-
icals were of analytical or technical grade and were used without
further treatment.
Selection of lipid using solubility parameter
Group contribution method was used to calculate Hildebrand
solubility parameter which requires energy of vaporization and
the molar volume. The molar volume of the lipid was determined
using group contribution method and energy of vaporization was
calculated using Van Krevelen–Hoftyzer11,12
. According to this
method, the total solubility parameter () is given by Equation (1).
Van Krevelen–Hoftyzer method was employed to calculate the
solubility parameter of carvedilol and various lipids and con-
firmed with the published literature values. Various lipids used in
this investigation are outlined in Table 1.
2
¼ 2
d þ 2
p þ 2
h ð1Þ
where
 ¼ total solubility parameter,
d ¼ contribution from dispersion forces d ¼
P
Fdi
V
 
,
p ¼ contribution from polar force p ¼
ffiffiffiffiffiffiffiffiffiffiP
F2
pi
p
V
 
,
h ¼ contribution of hydrogen bonding h ¼
ffiffiffiffiffiffiffiffiffiffiP
Ehi
p
V
 
,
Fdi ¼ molar attraction constant due to dispersion component,
Fpi ¼ molar attraction constant due to polar component,
Ehi ¼ hydrogen bonding energy,
V ¼ molar volume.
Preparation of blank SLNs
Blank SLNs were prepared by the hot homogenization method.
The lipid was melted at about 5–10 
C above its melting point.
The aqueous surfactant solution was heated separately at the
same temperature and added to the melted lipid. The mixture
was homogenized at 25,000 rpm for 10 min using a high-shear
homogenizer (Sentry Microprocessor, Kent City, MI). The
resultant dispersion was diluted with water and allowed to cool
at room temperature with constant stirring.
Design of experiments for blank SLNs
A series of blank SLN formulations using the design of
experiment approach were prepared to evaluate the suitable
range of lipid concentration and surfactant concentration that
could produce the targeted particle size (less than 200 nm) of
blank SLNs. This is the size of particles reported to be absorbed
by means of lymphatic route following oral administration6,7
. A
fractional factorial design using Fusion Pro software (S-matrix
Corporation, Eureka, CA) was applied and the concentrations of
COMP and P-188 were set from 0.625% to 15.0% and from 0.25%
to 5.0%, respectively. A total of 13 formulations were derived and
shown in Table 2. Following the fabrication of blank SLNs,
particle size was determined and used as response parameter for
the correlation analysis with the COMP and P-188 concentration
as independent parameters. In the obtained quadratic equation,
only the coefficients that were statistically significant (p50.05)
were retained. From the correlation obtained, concentration range
values of COMP and P-188 were calculated in order to obtain the
targeted particle size before loading the drug. Thereafter, a further
narrow range could be selected for lipid (e.g. 5.0%–7.5%) and
surfactant (e.g. 1.5%–5.0%), and concentration of an additional
third formulation variable (i.e. drug concentration) for a full
factorial design studies. This design of experiment approach
offers many advantages, e.g. reduction in the total number of
formulations containing three formulation variables, identification
of interaction between formulation variables and detection of the
Table 1. Solubility parameter of carvedilol and various lipids together
with their differences.
Drug/lipid name
Solubility parameter
(MPa)1/2
Difference with
carvedilol (D)
Carvedilol 25.38
Myristic acid 17.64 7.73
Palmitic acid 17.54 7.83
Stearic acid 17.46 7.91
Behenic acid 17.34 8.03
Trilaurin 17.63 7.74
Trimyrisin 17.52 7.85
Tripalmitiin 17.44 7.93
Tristearin 17.36 8.01
Tribehenin 17.26 8.11
Mono-glyceryl behenate 20.15 5.22
Di-glyceryl behenate 18.08 7.29
Compritol ATO 888 21.42 3.96
Glyceryl monostearate
(Imwitor 900 K)
20.37 5.00
2 M. K. Shah et al. Pharm Dev Technol, Early Online: 1–11
PharmaceuticalDevelopmentandTechnologyDownloadedfrominformahealthcare.comby24.185.57.10on05/23/13
Forpersonaluseonly.
optimal response such as minimum particle size with maximum
drug entrapment.
Preparation of carvedilol-loaded SLNs
Carvedilol-loaded SLNs were prepared using the same procedure
that was adopted for the preparation of blank SLNs except that
carvedilol was added to the lipid and allowed to dissolve in the
lipid melt. After carvedilol dissolved in the lipid melt, the hot
aqueous surfactant solution was added to it and the mixture was
homogenized at 25 000 rpm for 10 min. The resulting dispersion
was diluted with 10.0 mL of water (final preparation, 20.0 mL)
and was allowed to cool at room temperature with constant
stirring.
Design of experiments for carvedilol-loaded SLNs
A full factorial design using Fusion Pro software was employed to
derive predictive model for carvedilol-loaded SLNs fabricated
from COMP concentration, P-188 concentration and carvedilol
concentration as formulation variables. A total of 27 formulations
(Table 3) were derived. The concentrations of COMP and P-188
were selected based on the outcomes obtained from experiments
performed using blank SLNs. Carvedilol concentrations were
selected based on the preliminary experiments (data not shown).
Lipid concentration was ranged from 5.0% to 7.5%, the concen-
tration of P-188 was used from 1.5% to 5.0%, and carvedilol
concentration was ranged from 0.25% to 1.5%. Particle size and
entrapment efficiency were determined and used as the response
parameters for correlation with the formulation variables. Based
on the results obtained after the completion of experimental
design, a mathematical model could be established and used for
optimization, validation and prediction of carvedilol-loaded
SLNs. This mathematical model involved a dependent variable
Y and three independent variables A, B and C, and could be
expressed as Y ¼ f(A, B, C) which was used for regression
analysis. The three independent variables selected were lipid
concentration, P-188 concentration and carvedilol concentration
while the dependent variables included particle size and entrap-
ment efficiency.
Regression analysis of design of experiment
The contribution of the three formulation variables was compared
using analysis of variance (ANOVA) at p ¼ 0.5 significance level.
Table 2. Composition of blank SLN formulations obtained from the
fractional factorial design and their respective particle size (data shown as
mean Æ standard deviation, n ¼ 3).
Formulation
Formulation variables Particle size
code COMP (% w/v) P-188 (% w/v) Mean (nm) PI
P1 0.625 0.25 116 Æ 4 0.162
P2 0.625 5.0 1224 Æ 433 0.737
P3 0.625 5.0 1224 Æ 433 0.737
P4 2.5 5.0 110 Æ 15 0.167
P5 5.0 2.5 113 Æ 10 0.228
P6 5.0 5.0 101 Æ 14 0.222
P7 7.5 0.25 5918 Æ 2917 0.286
P8 7.5 2.5 199 Æ 7 0.200
P9 12.5 1.5 2442 Æ 1118 0.249
P10 12.5 2.5 1034 Æ 283 0.217
P11 15.0 0.25 9013 Æ 4322 1.000
P12 15.0 5.0 331 Æ 23 0.372
P13 15.0 5.0 331 Æ 23 0.372
COMP: Compritol 888 ATO, P-188: Poloxamer 188, PI: polydispersity
index
Table 3. Composition of carvedilol-loaded SLNs formulations obtained from the full factorial design and their respective particle
size and entrapment efficiency (data shown as mean Æ standard deviation, n ¼ 3).
Formulation variables Particle size
EE
Formulation code COMP (% w/v) P-188 (% w/v) Carvedilol (% w/v) Mean (nm) PI (%)
F1 5.0 1.5 0.25 146 Æ 9 0.207 68.5 Æ 0.9
F2 5.0 1.5 0.88 285 Æ 24 0.195 90.3 Æ 2.6
F3 5.0 1.5 1.5 1319 Æ 46 0.412 93.5 Æ 0.2
F4 5.0 3.3 0.25 101 Æ 6 0.243 69.9 Æ 3.2
F5 5.0 3.3 0.88 130 Æ 8 0.183 89.5 Æ 3.8
F6 5.0 3.3 1.5 2486 Æ 83 0.601 94.6 Æ 2.2
F7 5.0 5.0 0.25 97 Æ 16 0.231 60.8 Æ 2.9
F8 5.0 5.0 0.88 124 Æ 3 0.128 86.4 Æ 6.4
F9 5.0 5.0 1.5 414 Æ 19 0.191 88.9 Æ 2.0
F10 6.3 1.5 0.25 218 Æ 27 0.241 71.5 Æ 4.3
F11 6.3 1.5 0.88 279 Æ 43 0.285 92.0 Æ 3.8
F12 6.3 1.5 1.5 667 Æ 12 0.289 93.6 Æ 2.1
F13 6.3 3.3 0.25 124 Æ 17 0.218 69.6 Æ 2.9
F14 6.3 3.3 0.88 227 Æ 66 0.232 86.8 Æ 0.8
F15 6.3 3.3 1.5 406 Æ 6 0.154 95.6 Æ 2.3
F16 6.3 5.0 0.25 98 Æ 7 0.233 67.3 Æ 9.8
F17 6.3 5.0 0.88 110 Æ 13 0.237 87.1 Æ 4.2
F18 6.3 5.0 1.5 327 Æ 42 0.154 93.3 Æ 1.2
F19 7.5 1.5 0.25 289 Æ 22 0.283 56.7 Æ 6.9
F20 7.5 1.5 0.88 470 Æ 10 0.209 87.3 Æ 6.2
F21 7.5 1.5 1.5 1125 Æ 290 0.324 95.0 Æ 2.7
F22 7.5 3.3 0.25 189 Æ 9 0.231 52.1 Æ 4.1
F23 7.5 3.3 0.88 216 Æ 39 0.22 88.0 Æ 4.8
F24 7.5 3.3 1.5 263 Æ 73 0.206 92.5 Æ 3.1
F25 7.5 5.0 0.25 109 Æ 8 0.236 62.7 Æ 2.1
F26 7.5 5.0 0.88 153 Æ 28 0.211 94.8 Æ 2.3
F27 7.5 5.0 1.5 217 Æ 144 0.209 93.7 Æ 3.5
COMP: Compritol 888 ATO, P-188: Poloxamer 188, PI: polydispersity index, EE: entrapment efficiency.
DOI: 10.3109/10837450.2013.795169 Absorption of carvedilol-loaded solid lipid nanoparticles 3
PharmaceuticalDevelopmentandTechnologyDownloadedfrominformahealthcare.comby24.185.57.10on05/23/13
Forpersonaluseonly.
A regression analysis was carried out to obtain a quadratic model
in the form of:
Y ¼ b0 þ b1A þ b2B þ b3C þ b4ðA Ã CÞ þ b5ðC Ã BÞ
þ b6ðA Ã BÞ þ b7ðcurvatureÞ
ð2Þ
where
 Y is the response parameter associated with each factorial level
combination,
 b0 is an intercept (constant),
 bi is the regression coefficient computed from obtained
experimental values of Y,
 A, B and C stand for the formulation variables,
 A*C, C*B and A*B are for the interaction between the
formulation variables,
 (curvature) is the quadratic term of the independent variables
which was used to simulate the curvature of the designed
sample space. A backward elimination procedure was used to
fit the data to the quadratic model.
Characterization of carvedilol-loaded SLNs
Particle size
Photon correlation spectroscopy was employed to measure
particle size distributions of carvedilol-loaded SLNs, which
were diluted 10 times using distilled water before the determin-
ation. DelsaÔ Nano Series Zeta Potential and Submicron Particle
Size Analyzer (Brea, CA) were used at a scattering angle of 90
at
room temperature.
Entrapment efficiency
Entrapment efficiency was determined using the dialysis bag
method which separates un-entrapped drug from the carvedilol-
loaded SLN dispersions13
. Briefly, to determine un-entrapped
drug, 1.0 mL of the 20.0 mL prepared formulation was placed in
the dialysis bag (spectra/Por dialysis membrane MWCO: 6–8000)
at 4 
C in a beaker containing 20.0 mL of pH 6.8 phosphate buffer
with 30% PEG 400. At predetermined time intervals, samples
(1.0 mL each) were withdrawn for 8 h and immediately replaced
with the fresh medium. The collected samples were diluted with
1.0 mL of methanol and analyzed by the HPLC method described
previously14
. The following equation was used to calculate
entrapment efficiency.
EE ¼
Dt À Dm
Dt
 100 ð3Þ
where
EE ¼ entrapment efficiency,
Dt ¼ total amount of drug initially added,
Dm ¼ amount of drug in medium (un-entrapped).
The carvedilol-loaded SLN dispersion (without un-entrapped
drug) obtained at the end of the above-mentioned procedure were
also measured for entrapment efficiency and mass balance was
studied.
Constrained optimization of carvedilol-loaded SLNs
To further identify an optimal formulation, a constrained
optimization technique was used to generate the optimum setting
for the carvedilol-loaded SLNs. Therefore, two main constraints
were used to optimize the carvedilol-loaded SLNs: (i) minimiza-
tion of the particle size below 200 nm to promote lymphatic
uptake and (ii) greater than 90% entrapment efficiency. The
optimized formulation was subjected to particle size analysis,
entrapment efficiency determination and in vitro drug release
study. The proposed higher oral bioavailability of carvedilol from
SLNs is mainly due to desired particle size leading to higher
cellular uptake for lymphatic delivery. To minimize the potential
passive absorption of premature released carvedilol from SLNs,
in vitro drug release study was performed to ensure the retarded
release of carvedilol in the upper gastrointestinal tract before the
cellular uptake of SLNs by Peyer’s patches located in the distal
ileum of the gastrointestinal tract. For the comparison of
carvedilol release profile among formulations studied, in vitro
drug release study was also performed in the environment of
jejunum and ileum to minimize the release of carvedilol before
the cellular uptake of SLNs. In addition, the release of carvedilol
from SLNs, upon their uptake in the body, is a complex
mechanism which was not well understood. Therefore, the
parameters to be obtained from the carvedilol release profiles
were not used for the constrained optimization of carvedilol-
loaded SLNs.
Lyophilization and tableting of carvedilol-loaded SLNs
In order to obtain SLNs in a solid form, selected carvedilol-loaded
SLNs dispersions were lyophilized using freeze dry/shell freeze
system (Labconco, Kansas city, MO). Carvedilol-loaded SLN
dispersions were diluted with 15% trehalose as a cryoprotectant at
1:1 ratio, frozen and lyophilized for 24 h to obtain formulation
L-SLN15
. Core tablets of optimized formulation were prepared on
a Carver Press (model C, Fred S. Carver Inc., Menomonee Falls,
WI) using a 7.0 mm concave punch and 0.5 ton compression
pressure. Being directly compressible binder, diluent and disin-
tegrant Starch 1500 was used at 1:1 ratio. The core tablets were
compression coated with 30 mg of Eudragit L100-55 to resist
release of carvedilol in the acidic environment. An 8 mm punch at
a compression pressure of 1.5 ton was used to provide a thin
coating on the lateral sides as well as on the upper and lower sides
of the core tablet.
In vitro drug release study of carvedilol-loaded SLNs
The in vitro release profiles of carvedilol from selected formu-
lations of carvedilol-loaded SLNs (Table 3) and the optimized
formulation were determined using dialysis bag technique. In
addition, the in vitro release profiles obtained from the dispersion
of the optimized formulation were compared with lyophilized
powder (formulation L-SLNs), compress core tablet and enteric
coated tablet having the same formulation components as
optimized formulation.
In order to confirm that the dialysis bags used (same as used
previously for entrapment efficiency determination) acted as a
filter only and allowed to separate the drug released from SLNs
during the release medium sampling step, the distribution of
carvedilol solution from the inside to the outside of the bags was
also studied. The dialysis bags were soaked in distilled water for
12 h before use. The selected formulations of carvedilol-loaded
SLNs (0.5 mL) were added to the dialysis bag and both ends of the
bag were tied with clamps. In the case of solid dosage forms,
40 mg of accurately weighed lyophilized powders or each tablet
containing 40 mg of lyophilized powders were added into the
dialysis bag with 1.0 mL of dissolution medium. The bags were
placed in a beaker containing 30.0 mL of dissolution medium, and
the beakers were placed in a thermostatic shaker (VWR, Shell lab,
Cornelius, OR) and then shaken horizontally 100 rpm at 37 
C.
To simulate the acidic conditions of the stomach and the gastric
emptying time, 0.1 N HCl (pH 1.2) was used as release medium
and samples were withdrawn at 15 min intervals for 2 h. In
addition, to simulate the environment of jejunum and ileum,
phosphate buffer solution (pH 6.8) containing 1% v/v of Tween 80
was used. Aliquots (0.5 mL) were withdrawn at predetermined
4 M. K. Shah et al. Pharm Dev Technol, Early Online: 1–11
PharmaceuticalDevelopmentandTechnologyDownloadedfrominformahealthcare.comby24.185.57.10on05/23/13
Forpersonaluseonly.
time intervals and same volume was replaced with the fresh
medium. The samples were analyzed by HPLC method to
determine the drug content. All the studies were carried out in
triplicate.
Powder X-ray diffraction studies
To study change in the degree of crystallinity of carvedilol when
formulated as SLNs, pure materials and SLN formulations
together with their physical mixture were characterized using
Shimadzu X-Ray Diffractometer 6000 (Shimadzu, Columbia,
MD). Samples were irradiated using a Cu target tube. A
monochromator was used to select Ka 1 line. The scanning
angle ranged from 10
to 50
of 2, steps were 0.02
of 2 and the
counting time was 1 s/step. The scanning rate was 2
per min.
The current used was 30 mA and the voltage was 40 kV.
Cellular uptake of carvedilol-loaded SLNs
Due to the limitation of in vitro methods available to evaluate the
lymphatic absorption of carvedilol-loaded SLNs, cellular uptake
studies of carvedilol from SLNs as compared to from carvedilol
solution and physical mixture of components of SLNs were
performed using Caco-2 cell line, which has been reported to
be an indirect indication of lymphatic absorption16,17
. Human
excised Caco-2 cell monolayer (HUVECs) was seeded in 48-well
plates with complete fresh growth medium until cells were
confluence. A stock dispersion of the optimized SLN formulation
(FOPT) in DMEM (without serum and antibiotics) was prepared
and various dilutions from this stock dispersion were used to
study the effect of nanoparticles on uptake by the cells in the
DMEM medium. To initiate the experiment, the medium in the
wells was replaced with the various concentrations of nanopar-
ticles and incubated for predetermined time. Since it was difficult
to measure the number of nanoparticles, carvedilol concentration
was used as an indication of nanoparticles uptake by the cells.
This is based on the assumption that dilution of the stock
dispersion resulted in various concentrations of nanoparticles as
well as resulted in various concentrations of carvedilol accord-
ingly. In addition, in order to differentiate the passive absorption
of carvedilol from the active uptake of nanoparticles, several
control experiments are needed. Therefore, drug solutions and
components of optimized formulation as physical mixture (FOPT-
PM) with same carvedilol concentrations of that from each
respective concentration of nanoparticles in a DMEM media were
prepared and evaluated. At the end of the incubation period, the
nanoparticle dispersions or solutions containing media were
removed from the wells and the cell monolayers were rinsed three
times with PBS to remove un-uptaken cells, drug solutions and
nanoparticles. For the cell lysate and solubilization, 0.1 mL of 1%
triton-X 100 and 0.2 N NaOH in a 1:1 ratio was added to each
well. To this, 0.4 mL of methanol was added, centrifuged and
samples were analyzed using the previously described HPLC
method for carvedilol concentration.
Results and discussion
Selection of lipid using solubility parameter
The value of solubility parameter for the carvedilol was compared
with the solubility parameter of various lipid carriers (Table 1).
The solubility parameter for carvedilol was found to be
25.38 MPa1/2
while for a number of lipids evaluated in this
investigation the values ranged between 17.26 MPa1/2
(tribehenin)
and 21.42 MPa1/2
(Compritol ATO 888). It has been reported that
miscibility between the drug and carrier increases when the
difference in solubility parameters (D) between the drug and
carrier11,12
is less than 7 MPa1/2
. The solubility of the drug in the
lipid and hence the entrapment and physical stability of the drug
in the SLNs is likely to increase with decrease in D. Therefore,
Compritol ATO 888 (COMP) having the least value of D
(3.96 MPa1/2
) with carvedilol was chosen as the suitable lipid for
further studies.
Design of experiments for blank SLNs
The particle size obtained from 13 blank SLNs formulations
(based on fractional factorial design) ranged between 101 Æ 14 nm
and 9013 Æ 4322 nm (Table 2). At 0.625% level of COMP
concentration, increasing P-188 concentration from 0.25% (for-
mulation P1) to 5.0% (formulation P2) lead to increase in particle
size from 116 Æ 4 nm to 1224 Æ 433 nm with polymodal distribu-
tion in the later case. When the concentration of COMP was
increased to 5.0% level (formulations P5 and P6), the desired size
range of SLNs (i.e. less than 200 nm) were obtained with both
2.5% and 5.0% concentration of P-188. Further increase in COMP
concentration to 7.5%, 12.5% and 15.0% levels (formulations P7
through P13) lead to significant increase in particle size (except
formulation P8 containing 7.5% COMP and 2.5% P-188) and did
not produce SLNs of desired range irrespective of P-188
concentration used.
To better understand the comparative effect of COMP and
P-188 on particle size of SLNs, a surface response curve was
plotted (Figure 1). SLNs with larger size were observed when
either COMP or P-188 concentrations were at the higher levels.
In addition, with suitable concentration combination of COMP
and P-188, SLNs having particle size less than 200 nm could be
obtained. To further evaluate the quantitative effect of COMP and
P-188 as well as their interactions on the particle size of SLNs, an
analysis of quadratic model (p50.0001) was performed and an
equation having r2
value of 0.9989 was derived as below:
Particle size ¼ 13:8 þ 8:37ðCOMPÞ À 4:52ðP-188Þ
þ 14:05ðCOMPÞ2
þ 4:62ðP-188Þ2
À 18:38ðCOMP Ã P-188Þ
ð4Þ
The positive coefficients of COMP (p50.0001) and negative
coefficient of P-188 (p50.0001) indicate that increase in COMP
concentration increased particle size whereas increasing P-188
concentration helped to decrease the particle size. Moreover, the
curvature (higher order, COMP (p ¼ 0.0004) and P-188
(p ¼ 0.0407) terms) indicates that increasing P-188 concentration
up to a certain level helped to decrease the particle size whereas
beyond a certain level, multiple layers started to form followed by
increase in particle size. Furthermore, increasing COMP concen-
tration up to a certain level was able to form SLNs with desired
size of less than 200 nm whereas beyond a certain concentration,
larger particles were obtained. Thus, the combination of COMP
and P-188 concentrations (p50.0001) appears to play a crucial
role on the particles size of SLNs produced.
Design of experiments for carvedilol-loaded SLNs
The results obtained from the particle size analysis of blank SLNs
helped to understand the effects of COMP and P-188 on the
particle size of SLNs. To predict the particle size for selecting the
suitable concentration ranges of COMP and P-188 before
incorporating the drug, Equation (4) was applied and the results
are tabulated in Table 4. It can be seen from Table 4 that below
the 2.5% level of COMP, the predicted particle size would be less
than 200 nm as long as the concentration of P-188 was less than
1.5%. However, at low concentration of COMP, the drug loading
would be expected to be less. Further increase in COMP
concentration (above 7.5%) predicted particle size was larger
DOI: 10.3109/10837450.2013.795169 Absorption of carvedilol-loaded solid lipid nanoparticles 5
PharmaceuticalDevelopmentandTechnologyDownloadedfrominformahealthcare.comby24.185.57.10on05/23/13
Forpersonaluseonly.
than 200 nm in all the cases. Thus, the concentration range of
COMP was selected from 5.0% to 7.5%. At this selected
concentration range of COMP, the size of SLNs was predicted
to be above 200 nm when concentration of P-188 was at low levels
(i.e. 0.25% and 1.0%). Based on the approach of predicted particle
size, selected concentration ranges for COMP and P-188 were
5.0% to 7.5% and 1.5% to 5.0%, respectively, in order to obtain the
desired size of SLNs. However, after the loading of the drug onto
the SLNs, the particle size of drug-loaded SLNs might increase
further. Thus, the concentration range was selected such that, in
the absence of drug, SLNs would be predicted to be less than
200 nm. During the loading of drug onto the SLNs, drug
concentration would be the only factor affecting the particle
size and entrapment efficiency of drug.
Based on the application of Equation (4) and the predicted
values of the particle size obtained, the selected concentration
ranges of COMP and P-188 were able to minimize the number of
formulations when an additional formulation variable (carvedilol
concentration) was included for the fabrication of carvedilol-
loaded SLNs. Therefore, a total of 27 formulations were derived
and shown in Table 3 and subjected to the characterization of
particle size and entrapment efficiency.
Characterization of carvedilol-loaded SLNs
Carvedilol-loaded SLNs were characterized by particle size,
polydispersity index and entrapment efficiency.
Particle size
Particle size and polydispersity index (PI) of the 27 formulations
obtained from the full factorial design are shown in Table 3. The
magnitude of effect of the variables in the form of response
surface curve is shown in Figure 2. The results indicate that the
particle sizes of prepared formulations ranged from as low as
97 Æ 16 nm (formulation F7) to as high as 2486 Æ 83 nm
0
200
400
600
800
1000
1200
1400
1600
1800
2
4
6
8
10
12
14
1
2
3
4
Particlesize(nm)
COM
P
concentration
(%
)
P-188 concentration (%)
400
600
800
1000
1200
1400
1600
1800
Figure 1. Response surface curve illustrating the effects of COMP and P-
188 concentrations on particle size of blank SLNs.
Table 4. The selected concentration ranges of Compritol 888 ATO
(COMP) and Poloxamer 188 (P-188) for the fabrication of carvedilol-
loaded SLNs and their respective predicted particle size determined from
the equation obtained in design of experiments for blank solid lipid
nanoparticles.
COMP (% w/v) P-188 (% w/v) Predicted particle size (nm)
1.25 0.25 105
1.25 1.0 136
1.25 1.5 172
1.25 5.0 1207
2.5 0.25 118
2.5 1.0 126
2.5 1.5 145
2.5 5.0 295
5.0 0.25 214
5.0 1.0 169
5.0 1.5 155
5.0 5.0 154
5.0 7.5 1414
7.5 0.25 475
7.5 1.0 330
7.5 1.5 264
7.5 5.0 206
7.5 7.5 638
7.5 10.0 2155
12.5 0.25 2149
12.5 1.0 1497
12.5 1.5 1162
12.5 5.0 279
15.0 0.25 4062
15.0 1.0 2921
15.0 1.5 1162
15.0 5.0 322
0
200
400
600
800
1000
1200
1400
5.0
5.5
6.0
6.5
7.0
7.5
0.4
0.6
0.8
1.0
1.2
1.4
Particlesize(nm)
COM
P
concentration
(%
)
Carvedilol concentration (%)
0
200
400
600
800
1000
1200
1400
0
200
400
600
800
1000
1200
1400
1600
1.5
2.0
2.5
3.0
3.5
4.0
4.5
5.0
0.4
0.6
0.8
1.0
1.2
1.4
Particlesize(nm)
P-188
concentration
(%
)
Carvedilol concentration (%)
0
200
400
600
800
1000
1200
1400
1600
Figure 2. Response surface curve demonstrating the effects of COMP,
P-188 and carvedilol concentrations on particle size of carvedilol-loaded
SLNs.
6 M. K. Shah et al. Pharm Dev Technol, Early Online: 1–11
PharmaceuticalDevelopmentandTechnologyDownloadedfrominformahealthcare.comby24.185.57.10on05/23/13
Forpersonaluseonly.
(formulation F6). It was observed that when COMP and P-188
concentrations were kept constant, increasing carvedilol
concentration from 0.25% to 1.5% lead to significant increase in
particle size.
Following the same approach of analyzing the particle size of
blank SLNs, the quantitative effect of COMP, P-188, and
carvedilol concentrations as well as their interactions on the
particle size of carvedilol-loaded SLNs by means of a quadratic
model (p50.0001) was evaluated and an equation having an r2
value of 0.8985 was derived as below:
ðParticle sizeÞ ¼ 5:32 À 0:48ðP-188Þ
þ 0:64ðCarvedilolÞ þ 0:26ðCarvedilolÞ2
À 0:26ðCOMP Ã CarvedilolÞ
ð5Þ
The absence of the COMP term in Equation (5) confirms that
the selected concentration range of COMP was appropriate. It also
indicates that COMP did not affect directly the size of the
carvedilol-loaded SLNs and the selected concentration range of
COMP was able to produce desired size range of carvedilol-
loaded SLNs. In addition, the negative coefficient value for P-188
variable (p50.0001) suggests that increase in surfactant concen-
tration lead to decrease in particle size, which is also in agreement
with the previous results obtained. For the carvedilol variable
included in Equation (5), as the concentration of carvedilol
increases, the particle size of carvedilol-loaded SLNs was
observed to increase as the positive and highest coefficient
value of carvedilol variable (p50.0001) obtained. This type of
phenomenon has also been observed by several other researchers
which could be because of increased entrapment of the
carvedilol18
. For instance, at 5% of COMP and 1.5% of P-188,
increasing carvedilol concentration from 0.25% to 1.5% increased
the particles size from 146 Æ 9 nm to 1319 Æ 46 nm (formulations
F1, F2 and F3). The same trend was observed for the 6.3% and
7.5% COMP (formulations F10 to F27). At 0.25% of the
carvedilol concentration, all the formulations were able to
produce carvedilol-loaded SLNs below 200 nm except formula-
tions F10 and F19 where P-188 concentration was insufficient to
stabilize and fully cover the particles. In case of formulations F2,
F11, F14, F20 and F23 where carvedilol concentration is 0.88%,
the obtained carvedilol-loaded SLNs were larger than 200 nm
due to insufficient surfactant concentration with respect to the
lipid concentration. A further increase in carvedilol concentration
to 1.5% level lead to carvedilol-loaded SLNs larger than 200 nm
in all the cases. Apparently, higher carvedilol concentration
resulted in greater entrapment which resulted in increased
particle size.
Entrapment efficiency
The results of the entrapment efficiency of the 27 formulations
obtained from the full factorial design are shown in Table 3. The
magnitude of the effect of the variables was plotted using
response surface curve and is shown in Figure 3. The entrapment
efficiency of carvedilol-loaded SLNs ranged between 52.1 Æ 4.1%
(formulation F22) and 95.6 Æ 2.3% (formulation F15). Keeping P-
188 and carvedilol concentrations constant, increase in COMP
concentration led to increase in entrapment efficiency due to
lipophilic nature of the COMP. For example, at 5% P-188 level,
increase in COMP concentration from 5% to 7.5% lead to increase
in entrapment efficiency from 86.4 Æ 6.4% (formulation F8) to
94.8 Æ 2.3% (formulation F26). Entrapment efficiency also
increased when carvedilol concentration was increased from
0.25% to 1.5%. On the other hand, entrapment efficiency
decreased with increase in P-188 concentration due to increased
solubility of carvedilol in hot aqueous surfactant (i.e. P-188)
solution, thus resulting in the loss of entrapment during fabrica-
tion of SLNs stage.
Following the same approach of analyzing the particle size of
carvedilol-loaded SLNs, the quantitative effect of COMP, P-188,
and carvedilol concentrations as well as their interactions on the
entrapment efficiency of carvedilol-loaded SLNs using a quad-
ratic model (p50.0001) was evaluated and the following equation
having an r2
value of 0.9557 was derived:
ðEntrapment efficiencyÞ ¼ 7796:1 þ 2321:17ðCarvedilolÞ
À 1485:06ðCarvedilolÞ2
þ 352:67ðCOMP Ã P-188Þ
þ 350:83ðCOMP Ã CarvedilolÞ
ð6Þ
Based on the results from Equation (6), at the selected
concentration ranges of COMP, P-188, and carvedilol, carvedilol
(p50.0001) as well as the interaction of COMP with P-188
(p ¼ 0.014) and carvedilol (p ¼ 0.0151), respectively, were the
formulation variables affecting the entrapment efficiency of
carvedilol-loaded SLNs. The positive coefficient value of
carvedilol variable confirmed the assumption that incorporation
of more drug leads to more entrapment because of lipophilic
50
60
70
80
90
100
5.0
5.5
6.0
6.5
7.0
7.5
0.4
0.6
0.8
1.0
1.2
1.4
Entrapmentefficiency(%)
COM
P
concentration
(%
)
Carvedilol concentration (%)
50
60
70
80
90
100
50
60
70
80
90
100
1.5
2.0
2.5
3.0
3.5
4.0
4.5
5.0
0.4
0.6
0.8
1.0
1.2
1.4
Entrapmentefficiency(%)
P-188
concentration
(%
)
Carvedilol concentration (%)
50
60
70
80
90
100
Figure 3. Response surface curve demonstrating the effects of COMP, P-
188 and carvedilol concentrations on entrapment efficiency of carvedilol-
loaded SLNs.
DOI: 10.3109/10837450.2013.795169 Absorption of carvedilol-loaded solid lipid nanoparticles 7
PharmaceuticalDevelopmentandTechnologyDownloadedfrominformahealthcare.comby24.185.57.10on05/23/13
Forpersonaluseonly.
nature of carrier (i.e. COMP) which can accommodate more drug.
It was expected that increase in lipid concentration will lead to
increase in entrapment due to decreased tendency of the drug
migration into the aqueous phase. At higher lipid concentration, it
will provide more space to accommodate the drug19
. However, the
off trend was observed in the case of 1.5% of P-188 where
increasing lipid concentration did not increase entrapment
efficiency. This may have been due to insufficient surfactant
concentration which may not have been able to form a stable
nanoparticulate system causing poor entrapment.
Constrained optimization of carvedilol-loaded SLNs
From the selected concentration ranges of COMP, P-188 and
carvedilol, many of the 27 formulations generated from the full
factorial design showed particle size of carvedilol-loaded SLNs
below 200 nm. However, to further identify an optimal formula-
tion, a constrained optimization technique was applied to generate
the optimum setting for the carvedilol-loaded SLNs. From the
constrained optimization, an optimized formulation (FOPT) with
the composition of 7.5%, 5.0% and 1.11% of COMP, P-188 and
carvedilol, respectively, was obtained. Based on the optimization
approach, the theoretically predicted values for particle size and
entrapment efficiency of optimized formulation were expected to
be 151 nm and 94.6%, respectively. The experimentally obtained
values of response parameters for this optimized formulation were
161 nm and 94.8% of entrapment efficiency which are in close
agreement with the predicted values, suggesting the feasibility of
this optimization approach.
In vitro release study of carvedilol-loaded SLNs
The in vitro release profiles of the selected carvedilol-loaded
SLN formulations (Table 3) as well as the optimized formulation
and carvedilol solution in phosphate buffer solution (pH 6.8) are
shown in Figure 4. Carvedilol solution showed rapid and
complete distribution from inside to outside of the dialysis bag
within 1 h confirming that the dialysis bag functioned as a filter
and was not a barrier of drug distribution. Entrapping carvedilol
into a lipid by SLNs formulations were able to retard the drug
release. Furthermore, the differences in release profiles of
carvedilol from various SLNs formulations were due to differ-
ences in concentrations of COMP, P-188 and carvedilol as
formulation variables used to fabricate the carvedilol-loaded
SLNs and thereby their outcomes of particle size and entrapment
resulted from the differences of formulation variables. It was
found that increasing carvedilol concentration from 0.25%
(formulations F1, F7, F19 and F25) to 1.5% (formulations F3,
F9, F21 and F27) lead to significant decrease in drug release
rate. At low carvedilol concentration, about 60% to 100% drug
was released at the end of 24 h whereas less than 40% of drug
release was obtained when carvedilol concentration was
increased from 0.25% to 1.5%. The decreased drug release
could be attributed to the increased particle size and high
entrapment attributed from higher carvedilol concentration used.
However, keeping drug concentration and COMP concentration
constant, increasing surfactant concentration led to increase in
drug release. At 0.25% carvedilol concentration, when 1.5% of
P-188 concentration (formulations F1 and F19) was used, about
70% drug was released at the end of 24 h whereas drug release
increased to 100% when P-188 concentration was increased to
5.0% (formulations F7 and F25). Similar findings were obtained
when carvedilol concentration was at 1.5% level (formulations
F3 and F21 at 1.5% P-188 level as well as formulations F9 and
F27 at 5.0% P-188 level). As expected, the optimized formu-
lation was able to retard drug release and prolong the release
over a period of 24 h. This may have been due to decreased
particle size followed by increased surface area and decreased
diffusion path length. In addition, entrapment was observed to
decrease with increase in P-188 concentration and thus free drug
could have played a role in increased drug release. On the other
hand, drug release was observed to decrease when carvedilol and
P-188 concentrations were kept constant and COMP concentra-
tion was increased from 5% to 7.5%.
In order to better understand the release mechanism of drug
from SLNs formulations, the release profiles displayed in Figure 4
was plotted as cumulative drug released versus square root of time
and shown in Figure 5. A linear relationship with regression value
of 0.98 or greater was obtained in all selected carvedilol-loaded
SLNs studied, thereby confirming the diffusion model for release
mechanism from matrix type of delivery systems. In the present
investigation, hot homogenization method was used to fabricate
carvedilol-loaded SLNs suggesting the possible model could be
combination of drug-enriched surface and solid solution where
drug is molecularly dispersed in the lipid matrix10
.
Time (h)
0 4 8 12 16 20 24 28
Cumulativedrugreleased(%)
0
20
40
60
80
100
120
F1
F3
F7
F9
F19
F21
F25
F27
FOPT
Solution
Figure 4. The in vitro release profiles of the selected formulations of
carvedilol-loaded SLNs together with the optimized formulation (FOPT)
as well as carvedilol solution as a control in phosphate buffer solution (pH
6.8) by dialysis membrane diffusion technique (data shown as
mean Æ standard deviation, n ¼ 3).
Time (h)
1/2
0.0 0.5 1.0 1.5 2.0 2.5 3.0 3.5
Cumulativedrugreleased(%)
0
20
40
60
80
100
120
F1
F3
F7
F9
F19
F21
F25
F27
FOPT
Figure 5. Comparative relationships of cumulative amount of carvedilol
released as a function of the square root of time from the selected
formulations of carvedilol-loaded SLNs together with the optimized
formulation (FOPT) in phosphate buffer solution (pH 6.8) by dialysis
membrane diffusion technique (data shown as mean Æ standard deviation,
n ¼ 3).
8 M. K. Shah et al. Pharm Dev Technol, Early Online: 1–11
PharmaceuticalDevelopmentandTechnologyDownloadedfrominformahealthcare.comby24.185.57.10on05/23/13
Forpersonaluseonly.
Complete drug release from SLN formulations was obtained
in an acidic medium (0.1 N HCl, pH 1.2) within 2 h of study due
to the weakly basic nature of the drug and smaller particle size.
This finding indicates a need to protect SLNs from the stomach
if improved bioavailability has to be achieved by active
absorption from the Peyer’s patches located particularly in the
distal ileum of the intestinal tract. Therefore, the in vitro release
profiles obtained from the optimized formulation as a liquid
dispersion, as well as from other solid dosage forms such as
lyophilized powder (L-SLNs), compressed core tablet, and
enteric coated tablet having the same formulation components
as optimized formulation were compared (Figure 6). All dosage
forms were studied in PBS (pH 6.8) as release medium for 12 h
except that the enteric coated tablet was kept in 0.1 N HCl (pH
1.2) for 2 h and then placing it in PBS (pH 6.8) for 10 h.
Interestingly, similar release pattern was observed with lyophi-
lized SLNs and un-lyophilized SLNs (i.e. optimized formula-
tion). However, higher drug release rate was observed from
lyophilized L-SLNs as compared to un-lyophilized SLNs. The
possible reason could be attributed to the effect of cryoprotect-
ant (trehalose) and possible structural change that might have
occurred during lyophilization process. In addition, similar drug
release profiles were obtained from L-SLNs, compressed core
tablet and enteric coated tablet confirming the ability of
prepared tablets to exhibit the same release kinetics as
L-SLNs. Furthermore, prolonged controlled release profiles of
carvedilol over the period of 12 h from these solid dosage forms
were obtained. Therefore, it can be concluded that the
carvedilol-loaded SLNs based enteric-coated tablet was able to
protect the carvedilol from the acidic environment of the
stomach and drug release was retarded before the uptake of
carvedilol-loaded SLNs from small intestine region.
Powder X-ray diffraction
X-ray diffraction patterns of carvedilol, COMP, P-188, physical
mixture of FOPT and lyophilized SLNs of FOPT are shown in
Figure 7. Carvedilol showed characteristic crystalline peaks from
15
to 30
, with the peak at 24
being the most prominent with
intensity of 6 000 cps. COMP showed crystalline peak at 21
with
intensity of 12 400 cps whereas PLX 188 (which is semi-
crystalline in nature) showed peaks at 19
and 23.5
of 2. In the
case of FOPT-based physical mixture, similar peaks were
observed but with lesser intensity. When carvedilol was
incorporated into SLNs, absence of crystalline peak for carvedilol
and decrease in the peak of COPM and P-188 indicates conversion
of crystalline carvedilol to amorphous form in the SLNs.
Time (h)
0 2 4 6 8 10 12 14
Cumulativedrugreleased(%)
0
20
40
60
80
100
SLNs dispersion
L-SLNs
Core tablet
Enteric coated tablet
Figure 6. Comparison of the in vitro release profiles obtained from the
optimized formulation as a liquid dispersion form as well as from other
type of solid dosage forms such as lyophilized powder (L-SLNs),
compress core tablet, and enteric-coated tablet having the same formu-
lation components as optimized formulation (data shown as
mean Æ standard deviation, n ¼ 3).
Figure 7. X-ray diffraction pattern of pure, COMP, P-188, carvedilol and optimized formulation (FOPT)-based physical mixture as well as its
lyophilized SLNs.
DOI: 10.3109/10837450.2013.795169 Absorption of carvedilol-loaded solid lipid nanoparticles 9
PharmaceuticalDevelopmentandTechnologyDownloadedfrominformahealthcare.comby24.185.57.10on05/23/13
Forpersonaluseonly.
Cellular uptake of carvedilol-loaded SLNs
Higher amount of carvedilol uptake were found in all cases of
FOPTs as compared to the drug solutions and physical mixtures
of FOPT, irrespective of carvedilol concentrations studied
(Figure 8). The uptake by Caco-2 was found to be dependent on
the concentration of carvedilol and hence the concentration of
nanoparticles in the medium. It was observed that when the
concentration of carvedilol was increased from 10 mg/mL to
200 mg/mL, the amount of drug uptake increased from carvedilol
solutions and physical mixture of FOPTs. This finding indicates a
characteristic of passive transport of drug molecules from
carvedilol solutions and physical mixture of FOPTs. The similar
higher cellular uptake of drug from drug-loaded SLNs as
compared to the drug solution has been reported20,21
. The
higher amount of carvedilol from FOPTs as compared to the
carvedilol solution and physical mixture of FOPTs suggested the
crucial role of SLNs as a carrier for preferential cellular uptake
through Caco-2 cells.
Caco-2 cells have been widely developed, used and accepted
tool for the investigation of transport across the small intestinal
epithelium of many substances22
. The direct relationship of Caco-
2 cell line with the lymphatic absorption has not been evaluated to
the best of our knowledge. However, Caco-2 cell line has been
used to determine the effect of lipid-based excipients as
formulation variable for the lymphatic delivery of therapeutic
agents. Amongst the lipidic excipients evaluated, the long-chain
fatty acids forms lipoprotein assembly by associating with
intestinal lipoproteins in the enterocytes and thereby facilitates
the lymphatic transport of therapeutic agents16,17,23–25
. Thus,
Caco-2 cell line could have a potential application as screening
tool for lipid-based formulations targeted to lymphatic absorption.
The long-chain fatty acid (COMP) was used in the present
investigation for the preparation of FOPTs. Therefore, FOPTs,
after the cellular uptake, association of COMP with the intestinal
lipoprotein might have potential to promote the lymphatic
absorption of carvedilol.
Conclusion
Solubility parameter was found to be a useful tool for the
selection of lipid to fabricate SLNs. Design of experiments with
blank SLNs helped to understand the interaction of formulation
variables and minimized the number of experiments with the
drug. Carvedilol-loaded SLNs with minimal particle size and high
entrapment was successfully developed using statistical optimiza-
tion. The in vitro drug release study ensured the retarded release
of carvedilol in the gastrointestinal tract before the cellular uptake
of SLNs. Followed by cellular uptake from small intestinal region,
carvedilol-loaded SLNs could have potential to gain access to the
lymphatic system which will avoid the first pass metabolism and
hence higher bioavailability.
Acknowledgements
The authors acknowledge St. John’s University for providing financial
assistance and research facilities to carry out this research.
Declaration of interest
The authors declare no conflict of interest (monetary or otherwise) in
conducting this research. The authors alone are responsible for the content
and writing of the paper.
References
1. Pouton CW. Formulation of poorly water-soluble drugs for oral
administration: physicochemical and physiological issues and the
lipid formulation classification system. Eur J Pharma Sci 2006;29:
278–287.
2. Pavankumar B, Karimulla SK. Solid lipid nanoparticles – a brief
review. Int J Adv Biopharm 2012;2:35–55.
3. Ku M. Use of the biopharmaceutical classification system in early
drug development. The AAPS Journal 2008;10:208–212.
4. Wu CY, Benet LZ. Predicting drug disposition via application of
BCS: transport/absorption/elimination interplay and development
of a biopharmaceutics drug disposition classification system.
Pharm Res 2005;22:11–23.
5. Tsai MJ, Huang YB, Wu PC, et al. Oral apomorphine delivery from
solid lipid nanoparticles with different monostearate emulsifiers:
pharmacokinetic and behavioral evaluations. J Pharm Sci 2011;100:
547–557.
6. Bargoni A, Cavalli R, Caputo O, et al. Solid lipid nanoparticles in
lymph and plasma after duodenal administration to rats. Pharm Res
1998;15:745–750.
7. Yang S, Zhu J, Lu Y, et al. Body distribution of camptothecin solid
lipid nanoparticles after oral administration. Pharm Res 1999;16:
751–757.
8. Mehnert W, Mader K. Solid lipid nanoparticles: production,
characterization and applications. Adv Drug Deliv Rev 2001;47:
165–196.
9. Muchow M, Maincent P, Muller RH. Lipid nanoparticles with a
solid matrix (SLN, NLC, LDC) for oral drug delivery. Drug Dev Ind
Pharm 2008;34:1394–1405.
10. Muller RH, Mader K, Gohla S. Solid lipid nanoparticles (SLN) for
controlled drug – a review of the state of the art. Eur J Pharm
Biopharm 2000;50:161–177.
11. Greenhalgh DJ. Solubility parameters as predictors of miscibility in
solid dispersions. J Pharm Sci 1999;88:1182–1190.
12. Barton AFM. CRC handbook of solubility parameters and other
cohesion parameters. 2nd ed. Boca Raton, FL: CRC Press, 1991.
13. Misra A, Kalariya M, Padhi B, Chougule M. Methotraxate loaded
solid lipid nanoparticles for topical treatment of psoriasis: formu-
lation  clinical implications. Drug Del Tech 2004;4:1–12.
14. Lanlan W, Peinan S, Shufang N, Weisan P. Preparation and
evaluation of SEDDS and SMEDDS containing carvedilol. Drug
Dev Ind Pharm 2005;31:785–794.
15. Schwarz C, Mehnert W. Freeze-drying of drug-free and drug-loaded
solid lipid nanoparticles (SLN). Int J Pharm 1997;157:171–179.
16. Caliph SM, Charman WN, Porter CJ. Effect of short-, medium-, and
long-chain fatty acid-based vehicles on the absolute oral bioavail-
ability and intestinal lymphatic transport of halofantrine and
assessment of mass balance in lymph-cannulated and non-cannu-
lated rats. J Pharm Sci 2000;89:1073–1084.
17. Trevaskis NL, Charman WN, Porter CJ. Lipid-based delivery
systems and intestinal lymphatic drug transport: a mechanistic
update. Adv Drug Del Rev 2008;60:702–716.
Carvedilol concentration (µg/mL)
0 50 100 150 200 250
CarvedilolamountobtainedinCaco-2cells(µg)
0
50
100
150
200
250
FOPT-SLN
FOPT-Physical mixture
Carvedilol solution
Figure 8. The cellular uptake mechanism of nanoparticles from the
optimized formulation (FOPT) of SLNs together with their physical
mixtures and carvedilol solutions as control groups by in vitro model
using Caco-2 cell line (data shown as mean Æ standard deviation, n ¼ 3).
10 M. K. Shah et al. Pharm Dev Technol, Early Online: 1–11
PharmaceuticalDevelopmentandTechnologyDownloadedfrominformahealthcare.comby24.185.57.10on05/23/13
Forpersonaluseonly.
18. Liu CH, Wu CT, Fang JY. Characterization and formulation
optimization of solid lipid nanoparticles in vitamin K1 delivery.
Drug Dev Ind Pharm 2010;36:751–761.
19. Shah KA, Date AA, Joshi MD, Patravale VB. Solid lipid
nanoparticles (SLN) of tretinoin: potential in topical delivery. Int J
Pharm 2007;345:163–171.
20. Yuan H, Miao J, Du YZ, et al. Cellular uptake of solid lipid
nanoparticles and cytotoxicity of encapsulated paclitaxel in A549
cancer cells. Int J Pharm 2008;348:137–145.
21. Miglietta A, Cavalli R, Bocca C, et al. Cellular uptake and
cytotoxicity of solid lipid nanospheres (SLN) incorporating doxo-
rubicin or paclitaxel. Int J Pharm 2000;210:61–67.
22. Gaumet M, Gurny R, Delie F. Localization and quantification of
biodegradable particles in an intestinal cell model: the influence of
particle size. Eur J Pharm Sci 2009;36:465–473.
23. Porter CJ, Trevaskis NL, Charman WN. Lipids and lipid-based
formulations: optimizing the oral delivery of lipophilic drugs.
Nat Rev Drug Discov 2007;6:231–248.
24. Pouton CW, Porter CJ. Formulation of lipid-based delivery systems
for oral administration: materials, methods and strategies. Adv Drug
Deliv Rev 2008;60:625–637.
25. Porter CJ, Pouton CW, Cuine JF, Charman WN. Enhancing
intestinal drug solubilisation using lipid-based delivery systems.
Adv Drug Deliv Rev 2008;60:673–691.
DOI: 10.3109/10837450.2013.795169 Absorption of carvedilol-loaded solid lipid nanoparticles 11
PharmaceuticalDevelopmentandTechnologyDownloadedfrominformahealthcare.comby24.185.57.10on05/23/13
Forpersonaluseonly.

More Related Content

What's hot

12 Drug Distribution part 2
12 Drug Distribution part 212 Drug Distribution part 2
12 Drug Distribution part 2Nilesh Kulkarni
 
Factors affecting drug absorption part ii
Factors affecting drug absorption part iiFactors affecting drug absorption part ii
Factors affecting drug absorption part iiNilesh Kulkarni
 
Ph activated and ion activated cdds
Ph activated and ion activated cddsPh activated and ion activated cdds
Ph activated and ion activated cddsChandrika Chandu
 
Pharmacosomes
PharmacosomesPharmacosomes
PharmacosomesSUJIT DAS
 
P h partition hypothesis
P h partition hypothesisP h partition hypothesis
P h partition hypothesisZahid1392
 
Ph partion hypotesis
Ph partion hypotesisPh partion hypotesis
Ph partion hypotesisSagugowda
 
Formulation factors affecting drug absorption
Formulation factors affecting drug absorptionFormulation factors affecting drug absorption
Formulation factors affecting drug absorptionshikha singh
 
Factors affecting drug absorption part iii
Factors affecting drug absorption part iiiFactors affecting drug absorption part iii
Factors affecting drug absorption part iiiNilesh Kulkarni
 
Development and characterization of anionic liposaccharides for enhanced oral
Development and characterization of anionic liposaccharides for enhanced oralDevelopment and characterization of anionic liposaccharides for enhanced oral
Development and characterization of anionic liposaccharides for enhanced oralAdel Abdelrahim, PhD
 
Formulation design for poorly water-soluble drugs based on biopharmaceutics c...
Formulation design for poorly water-soluble drugs based on biopharmaceuticsc...Formulation design for poorly water-soluble drugs based on biopharmaceuticsc...
Formulation design for poorly water-soluble drugs based on biopharmaceutics c...siddy-07
 

What's hot (19)

12 Drug Distribution part 2
12 Drug Distribution part 212 Drug Distribution part 2
12 Drug Distribution part 2
 
Pharmacosomes.
Pharmacosomes.Pharmacosomes.
Pharmacosomes.
 
Factors affecting drug absorption part ii
Factors affecting drug absorption part iiFactors affecting drug absorption part ii
Factors affecting drug absorption part ii
 
Null 6
Null 6Null 6
Null 6
 
srikanth final presentation
srikanth final presentationsrikanth final presentation
srikanth final presentation
 
pharmacosomes poster
pharmacosomes posterpharmacosomes poster
pharmacosomes poster
 
Ph activated and ion activated cdds
Ph activated and ion activated cddsPh activated and ion activated cdds
Ph activated and ion activated cdds
 
Pharmacokinetics mpharm
Pharmacokinetics mpharmPharmacokinetics mpharm
Pharmacokinetics mpharm
 
Pharmacosomes
PharmacosomesPharmacosomes
Pharmacosomes
 
P h partition hypothesis
P h partition hypothesisP h partition hypothesis
P h partition hypothesis
 
Bcs classification system
Bcs classification system Bcs classification system
Bcs classification system
 
Ph partion hypotesis
Ph partion hypotesisPh partion hypotesis
Ph partion hypotesis
 
Prodrugs
ProdrugsProdrugs
Prodrugs
 
Factors affecting absorption
Factors affecting absorptionFactors affecting absorption
Factors affecting absorption
 
Absorption of drugs
Absorption of drugsAbsorption of drugs
Absorption of drugs
 
Formulation factors affecting drug absorption
Formulation factors affecting drug absorptionFormulation factors affecting drug absorption
Formulation factors affecting drug absorption
 
Factors affecting drug absorption part iii
Factors affecting drug absorption part iiiFactors affecting drug absorption part iii
Factors affecting drug absorption part iii
 
Development and characterization of anionic liposaccharides for enhanced oral
Development and characterization of anionic liposaccharides for enhanced oralDevelopment and characterization of anionic liposaccharides for enhanced oral
Development and characterization of anionic liposaccharides for enhanced oral
 
Formulation design for poorly water-soluble drugs based on biopharmaceutics c...
Formulation design for poorly water-soluble drugs based on biopharmaceuticsc...Formulation design for poorly water-soluble drugs based on biopharmaceuticsc...
Formulation design for poorly water-soluble drugs based on biopharmaceutics c...
 

Similar to MansiShah-PDT2013

In vitro and in vivo evaluation of positively charged liposaccharide derivati...
In vitro and in vivo evaluation of positively charged liposaccharide derivati...In vitro and in vivo evaluation of positively charged liposaccharide derivati...
In vitro and in vivo evaluation of positively charged liposaccharide derivati...Adel Abdelrahim, PhD
 
chemical character OF DRUG.pptx
chemical character OF DRUG.pptxchemical character OF DRUG.pptx
chemical character OF DRUG.pptxlaxmidharsahoo7
 
Investigating the Effect of Molecular Weight of Polyvinylpyrrolidone and Hydr...
Investigating the Effect of Molecular Weight of Polyvinylpyrrolidone and Hydr...Investigating the Effect of Molecular Weight of Polyvinylpyrrolidone and Hydr...
Investigating the Effect of Molecular Weight of Polyvinylpyrrolidone and Hydr...Smruti Chaudhari, Ph.D.
 
Ijdrt issue march-april-2015_article1
Ijdrt issue march-april-2015_article1Ijdrt issue march-april-2015_article1
Ijdrt issue march-april-2015_article1IJDRT JOURNAL
 
Ijdrt issue march-april-2015_article1
Ijdrt issue march-april-2015_article1Ijdrt issue march-april-2015_article1
Ijdrt issue march-april-2015_article1IJDRT JOURNAL
 
Dissolution Enhancement of BCS Class 4 Dssrugs Using Quality by Design Approa...
Dissolution Enhancement of BCS Class 4 Dssrugs Using Quality by Design Approa...Dissolution Enhancement of BCS Class 4 Dssrugs Using Quality by Design Approa...
Dissolution Enhancement of BCS Class 4 Dssrugs Using Quality by Design Approa...inventionjournals
 
pre PowerPoint a.pptx
pre PowerPoint a.pptxpre PowerPoint a.pptx
pre PowerPoint a.pptxAhmedIsmaill3
 
Formulation and Evaluation of Floating microspheres of L-Carnitine
Formulation and Evaluation of Floating microspheres of L-CarnitineFormulation and Evaluation of Floating microspheres of L-Carnitine
Formulation and Evaluation of Floating microspheres of L-CarnitineDarshanChhajedD
 
LIPID POLYMER HYBRID POLYMER presentation
LIPID POLYMER HYBRID POLYMER presentationLIPID POLYMER HYBRID POLYMER presentation
LIPID POLYMER HYBRID POLYMER presentationPankaj0055
 
Nasal drug delivery system
Nasal drug delivery systemNasal drug delivery system
Nasal drug delivery systemPravin Chinchole
 
Design and Development of Effervescent Floating Tablet Dapagliflozin
Design and Development of Effervescent Floating Tablet DapagliflozinDesign and Development of Effervescent Floating Tablet Dapagliflozin
Design and Development of Effervescent Floating Tablet Dapagliflozinijtsrd
 
LPDT_A_938857-2014
LPDT_A_938857-2014LPDT_A_938857-2014
LPDT_A_938857-2014Mansi Shah
 
Importance of partition coefficient, solubility and dissociation on pre-formu...
Importance of partition coefficient, solubility and dissociation on pre-formu...Importance of partition coefficient, solubility and dissociation on pre-formu...
Importance of partition coefficient, solubility and dissociation on pre-formu...SHANE_LOBO145
 
Shankar Gulve 4 sem ppt (1)234.pptx
Shankar Gulve 4 sem ppt (1)234.pptxShankar Gulve 4 sem ppt (1)234.pptx
Shankar Gulve 4 sem ppt (1)234.pptx10ChopaneAshok
 

Similar to MansiShah-PDT2013 (20)

Synopsis copy
Synopsis   copySynopsis   copy
Synopsis copy
 
In vitro and in vivo evaluation of positively charged liposaccharide derivati...
In vitro and in vivo evaluation of positively charged liposaccharide derivati...In vitro and in vivo evaluation of positively charged liposaccharide derivati...
In vitro and in vivo evaluation of positively charged liposaccharide derivati...
 
Formulation and Evaluation of Atorvastatin Calcium Niosomes
Formulation and Evaluation of Atorvastatin Calcium NiosomesFormulation and Evaluation of Atorvastatin Calcium Niosomes
Formulation and Evaluation of Atorvastatin Calcium Niosomes
 
chemical character OF DRUG.pptx
chemical character OF DRUG.pptxchemical character OF DRUG.pptx
chemical character OF DRUG.pptx
 
Keto keto
Keto ketoKeto keto
Keto keto
 
Investigating the Effect of Molecular Weight of Polyvinylpyrrolidone and Hydr...
Investigating the Effect of Molecular Weight of Polyvinylpyrrolidone and Hydr...Investigating the Effect of Molecular Weight of Polyvinylpyrrolidone and Hydr...
Investigating the Effect of Molecular Weight of Polyvinylpyrrolidone and Hydr...
 
Ijdrt issue march-april-2015_article1
Ijdrt issue march-april-2015_article1Ijdrt issue march-april-2015_article1
Ijdrt issue march-april-2015_article1
 
Ijdrt issue march-april-2015_article1
Ijdrt issue march-april-2015_article1Ijdrt issue march-april-2015_article1
Ijdrt issue march-april-2015_article1
 
Solid lipid n ps
Solid lipid n psSolid lipid n ps
Solid lipid n ps
 
Dissolution Enhancement of BCS Class 4 Dssrugs Using Quality by Design Approa...
Dissolution Enhancement of BCS Class 4 Dssrugs Using Quality by Design Approa...Dissolution Enhancement of BCS Class 4 Dssrugs Using Quality by Design Approa...
Dissolution Enhancement of BCS Class 4 Dssrugs Using Quality by Design Approa...
 
pre PowerPoint a.pptx
pre PowerPoint a.pptxpre PowerPoint a.pptx
pre PowerPoint a.pptx
 
Formulation and Evaluation of Floating microspheres of L-Carnitine
Formulation and Evaluation of Floating microspheres of L-CarnitineFormulation and Evaluation of Floating microspheres of L-Carnitine
Formulation and Evaluation of Floating microspheres of L-Carnitine
 
LIPID POLYMER HYBRID POLYMER presentation
LIPID POLYMER HYBRID POLYMER presentationLIPID POLYMER HYBRID POLYMER presentation
LIPID POLYMER HYBRID POLYMER presentation
 
SLN -.pptx
SLN -.pptxSLN -.pptx
SLN -.pptx
 
Nasal drug delivery system
Nasal drug delivery systemNasal drug delivery system
Nasal drug delivery system
 
final pre. ppt.pptx
final pre. ppt.pptxfinal pre. ppt.pptx
final pre. ppt.pptx
 
Design and Development of Effervescent Floating Tablet Dapagliflozin
Design and Development of Effervescent Floating Tablet DapagliflozinDesign and Development of Effervescent Floating Tablet Dapagliflozin
Design and Development of Effervescent Floating Tablet Dapagliflozin
 
LPDT_A_938857-2014
LPDT_A_938857-2014LPDT_A_938857-2014
LPDT_A_938857-2014
 
Importance of partition coefficient, solubility and dissociation on pre-formu...
Importance of partition coefficient, solubility and dissociation on pre-formu...Importance of partition coefficient, solubility and dissociation on pre-formu...
Importance of partition coefficient, solubility and dissociation on pre-formu...
 
Shankar Gulve 4 sem ppt (1)234.pptx
Shankar Gulve 4 sem ppt (1)234.pptxShankar Gulve 4 sem ppt (1)234.pptx
Shankar Gulve 4 sem ppt (1)234.pptx
 

MansiShah-PDT2013

  • 1. 2013 http://informahealthcare.com/phd ISSN: 1083-7450 (print), 1097-9867 (electronic) Pharm Dev Technol, Early Online: 1–11 ! 2013 Informa Healthcare USA, Inc. DOI: 10.3109/10837450.2013.795169 ORIGINAL ARTICLE Preparation, in vitro evaluation and statistical optimization of carvedilol-loaded solid lipid nanoparticles for lymphatic absorption via oral administration Mansi K. Shah, Parshotam Madan, and Senshang Lin College of Pharmacy and Health Sciences, St. John’s University, Queens, NY, USA Abstract Carvedilol-loaded solid lipid nanoparticles (SLNs) were prepared using solubility parameter () to select the lipid, and hot homogenization to fabricate SLNs. The effect of concentration of Compritol 888 ATO (COMP) and Poloxamer 188 (P-188) on the particle size of blank SLNs was studied using the design of experiments. Further narrow concentration range of COMP and P- 188 was selected and carvedilol-loaded SLNs were prepared to obtain an optimized formulation which was lyophilized (L-SLNs), transformed into enteric compression-coated tablet and evaluated for drug release, X-ray diffraction and cellular uptake mechanism. COMP was chosen as lipid due to its least value of D with carvedilol. The optimized formulation (7.5% COMP, 5.0% P-188 and 1.11% carvedilol) had 161 nm particle size and 94.8% entrapment efficiency. The enteric-coated carvedilol-loaded SLNs tablet protected carvedilol from acidic environment and similar prolonged release profiles were obtained from L-SLNs, core tablet and enteric- coated tablet. Absence of crystalline carvedilol XRD peak indicated the presence of amorphous carvedilol in SLNs. Higher carvedilol uptake from SLNs compared to drug solution in the Caco-2 cell line exhibited a potential prolonged drug release. Moreover, upon cellular uptake, SLNs could then enter the lymphatic system which will avoid first pass metabolism and hence higher oral bioavailability. Keywords Caco-2 cells, carvedilol, cellular uptake mechanism, design of experiments, oral drug delivery, solid lipid nanoparticles History Received 22 January 2013 Revised 7 April 2013 Accepted 9 April 2013 Published online 22 May 2013 Introduction The past few decades have seen significant advances in drug delivery technologies. Oral drug delivery is not only the largest and the oldest segment of the entire drug delivery market; it is also the fastest growing and the most preferred route for drug administration. Because a large number of recently developed chemical entities have poor aqueous solubility, many formulation approaches, such as salt formation, co-solvent, size reduction, complexation and lipid-based drug delivery systems have been evaluated to increase their bioavailability1 . Lipophile delivery through oral route is extremely challenging because upon introduction into the aqueous biological environments, lipophilic molecules exhibit instability, precipitation, food interactions, non- specific targeting and toxic effects2 . According to Biopharmaceutical Drug Disposition Classification System (BDDCS), based upon the prediction of drug disposition by interplay of transport, absorption and elimination, majority of the BCS Class II drugs not only have poor aqueous solubility but also have extensive first pass metabolism causing additional factor for poor bioavailability3,4 . Therefore, the development of a delivery system, which not only regulates the release of the drug but also avoids the first pass metabolism, is needed to enhance the overall therapeutic outcomes. Utilization of solid lipid nanoparticles (SLNs) to regulate the release of drug has been evaluated in oral administration route5 . It has been reported that oral bioavailability can be increased by encapsulating drug into SLNs where uptake of drug occurs through the lymphatic system6,7 . SLNs generally are spherical in shape and are comprised of a solid lipid core stabilized by a surfactant interfacial region which combines the advantages of lipid emulsion systems and polymeric nanoparticle systems while overcoming the temporal and in vivo stability issues that are exhibited by other drug delivery approaches8–10 . SLNs are biocompatible and biodegradable and can be produced easily without the use of organic solvents. In addition, due to solid nature of the lipid matrix, SLNs can be lyophilized and transformed into the conventional oral solid dosage forms such as tablets and capsules, thereby enhancing stability and patient compliance8–10 . In order to evaluate the features of regulating the release of drug and avoiding the first pass metabolism through lymphatic uptake offered by SLNs6,7 , carvedilol was selected as the model drug. The properties of carvedilol, e.g. high first pass metabolism and low dose as well as its need for long-term treatment and repetitive dosing, make this drug an interesting candidate for oral administration where the release of the drug should be controlled and the first pass metabolism could be avoided to increase overall bioavailability by promoting lymphatic uptake of carvedilol- loaded SLNs. Carvedilol (log P ¼ 4.2) is practically insoluble in water, in gastric fluids (pH 1.1) and in intestinal fluids (pH 7.5). Although carvedilol is completely absorbed from the gastrointes- tinal tract after ingestion of the conventional tablets, the systemic Address for correspondence: Senshang Lin, PhD, College of Pharmacy and Health Sciences, St. John’s University, Queens, NY, USA. Tel: (718) 990 5344. Fax: (718) 990 1877. E-mail: linse@stjohns.edu PharmaceuticalDevelopmentandTechnologyDownloadedfrominformahealthcare.comby24.185.57.10on05/23/13 Forpersonaluseonly.
  • 2. availability is about 25% due to its metabolism in liver. Therefore, carvedilol-loaded SLNs using solid safe lipid materials, low amount of surfactant and its feasibility of being transformed into tablets as a dosage form were evaluated in this investigation. Various lipids were screened and selected based upon the solubility parameter and then high-shear homogenization was employed to fabricate blank SLNs for evaluation of such formulation variables as concentrations of lipid and surfactant on the size of the nanoparticles. Based upon the results of particle size obtained from blank SLNs, narrow range of lipid and surfactant concentrations were further selected to produce targeted nanoparticles (less than 200 nm) and carvedilol-loaded SLNs were prepared using the design of experimental approach. Physicochemical properties of carvedilol-loaded SLNs, such as particle size, drug entrapment efficiency and in vitro drug release kinetic were evaluated and used to obtain an optimized formu- lation. The optimized formulation was then enteric compression coated and the powder XRD study was performed to evaluate the nature of the drug present in the prepared SLNs. In vitro cellular uptake studies of carvedilol from SLNs as well as from carvedilol solution and physical mixture of components of SLNs as controls were performed using Caco-2 cell line as an indirect indication of lymphatic absorption. Materials and methods Materials Carvedilol was obtained as a free sample from Caraco Pharmaceuticals (Detroit, MI). Compritol 888 ATO (COMP) was obtained as a gift sample from Gattafosse (Paramus, NJ). Monobasic potassium phosphate, dibasic potassium phosphate, Poloxamer 188 (P-188), polyethylene glycol 400 (PEG) and HPLC grade methanol were purchased from VWR International (West Chester, PA). Starch 1500 and Eudragit L100-55 were kind gifts from Colorcon (Harleysville, PA) and Evonik Industries (Piscataway, NJ), respectively. Dialysis membrane (spectra/Por dialysis memberane MWCO: 6–8000) was obtained from Spectrum Labs (Rancho Dominguez, CA). The human umbilical vein endothelial cell (HUVEC) line was obtained from American Type Culture Collection (ATCC, Manassas, VA). Dulbecco’s Modified Eagle’s Medium (DMEM/F12) with L-glutamine and 15 mM HEPES, fetal bovine serum, 1% streptomycin and trypsin were obtained from Sigma-Aldrich (St. Louis, MO). All chem- icals were of analytical or technical grade and were used without further treatment. Selection of lipid using solubility parameter Group contribution method was used to calculate Hildebrand solubility parameter which requires energy of vaporization and the molar volume. The molar volume of the lipid was determined using group contribution method and energy of vaporization was calculated using Van Krevelen–Hoftyzer11,12 . According to this method, the total solubility parameter () is given by Equation (1). Van Krevelen–Hoftyzer method was employed to calculate the solubility parameter of carvedilol and various lipids and con- firmed with the published literature values. Various lipids used in this investigation are outlined in Table 1. 2 ¼ 2 d þ 2 p þ 2 h ð1Þ where ¼ total solubility parameter, d ¼ contribution from dispersion forces d ¼ P Fdi V , p ¼ contribution from polar force p ¼ ffiffiffiffiffiffiffiffiffiffiP F2 pi p V , h ¼ contribution of hydrogen bonding h ¼ ffiffiffiffiffiffiffiffiffiffiP Ehi p V , Fdi ¼ molar attraction constant due to dispersion component, Fpi ¼ molar attraction constant due to polar component, Ehi ¼ hydrogen bonding energy, V ¼ molar volume. Preparation of blank SLNs Blank SLNs were prepared by the hot homogenization method. The lipid was melted at about 5–10 C above its melting point. The aqueous surfactant solution was heated separately at the same temperature and added to the melted lipid. The mixture was homogenized at 25,000 rpm for 10 min using a high-shear homogenizer (Sentry Microprocessor, Kent City, MI). The resultant dispersion was diluted with water and allowed to cool at room temperature with constant stirring. Design of experiments for blank SLNs A series of blank SLN formulations using the design of experiment approach were prepared to evaluate the suitable range of lipid concentration and surfactant concentration that could produce the targeted particle size (less than 200 nm) of blank SLNs. This is the size of particles reported to be absorbed by means of lymphatic route following oral administration6,7 . A fractional factorial design using Fusion Pro software (S-matrix Corporation, Eureka, CA) was applied and the concentrations of COMP and P-188 were set from 0.625% to 15.0% and from 0.25% to 5.0%, respectively. A total of 13 formulations were derived and shown in Table 2. Following the fabrication of blank SLNs, particle size was determined and used as response parameter for the correlation analysis with the COMP and P-188 concentration as independent parameters. In the obtained quadratic equation, only the coefficients that were statistically significant (p50.05) were retained. From the correlation obtained, concentration range values of COMP and P-188 were calculated in order to obtain the targeted particle size before loading the drug. Thereafter, a further narrow range could be selected for lipid (e.g. 5.0%–7.5%) and surfactant (e.g. 1.5%–5.0%), and concentration of an additional third formulation variable (i.e. drug concentration) for a full factorial design studies. This design of experiment approach offers many advantages, e.g. reduction in the total number of formulations containing three formulation variables, identification of interaction between formulation variables and detection of the Table 1. Solubility parameter of carvedilol and various lipids together with their differences. Drug/lipid name Solubility parameter (MPa)1/2 Difference with carvedilol (D) Carvedilol 25.38 Myristic acid 17.64 7.73 Palmitic acid 17.54 7.83 Stearic acid 17.46 7.91 Behenic acid 17.34 8.03 Trilaurin 17.63 7.74 Trimyrisin 17.52 7.85 Tripalmitiin 17.44 7.93 Tristearin 17.36 8.01 Tribehenin 17.26 8.11 Mono-glyceryl behenate 20.15 5.22 Di-glyceryl behenate 18.08 7.29 Compritol ATO 888 21.42 3.96 Glyceryl monostearate (Imwitor 900 K) 20.37 5.00 2 M. K. Shah et al. Pharm Dev Technol, Early Online: 1–11 PharmaceuticalDevelopmentandTechnologyDownloadedfrominformahealthcare.comby24.185.57.10on05/23/13 Forpersonaluseonly.
  • 3. optimal response such as minimum particle size with maximum drug entrapment. Preparation of carvedilol-loaded SLNs Carvedilol-loaded SLNs were prepared using the same procedure that was adopted for the preparation of blank SLNs except that carvedilol was added to the lipid and allowed to dissolve in the lipid melt. After carvedilol dissolved in the lipid melt, the hot aqueous surfactant solution was added to it and the mixture was homogenized at 25 000 rpm for 10 min. The resulting dispersion was diluted with 10.0 mL of water (final preparation, 20.0 mL) and was allowed to cool at room temperature with constant stirring. Design of experiments for carvedilol-loaded SLNs A full factorial design using Fusion Pro software was employed to derive predictive model for carvedilol-loaded SLNs fabricated from COMP concentration, P-188 concentration and carvedilol concentration as formulation variables. A total of 27 formulations (Table 3) were derived. The concentrations of COMP and P-188 were selected based on the outcomes obtained from experiments performed using blank SLNs. Carvedilol concentrations were selected based on the preliminary experiments (data not shown). Lipid concentration was ranged from 5.0% to 7.5%, the concen- tration of P-188 was used from 1.5% to 5.0%, and carvedilol concentration was ranged from 0.25% to 1.5%. Particle size and entrapment efficiency were determined and used as the response parameters for correlation with the formulation variables. Based on the results obtained after the completion of experimental design, a mathematical model could be established and used for optimization, validation and prediction of carvedilol-loaded SLNs. This mathematical model involved a dependent variable Y and three independent variables A, B and C, and could be expressed as Y ¼ f(A, B, C) which was used for regression analysis. The three independent variables selected were lipid concentration, P-188 concentration and carvedilol concentration while the dependent variables included particle size and entrap- ment efficiency. Regression analysis of design of experiment The contribution of the three formulation variables was compared using analysis of variance (ANOVA) at p ¼ 0.5 significance level. Table 2. Composition of blank SLN formulations obtained from the fractional factorial design and their respective particle size (data shown as mean Æ standard deviation, n ¼ 3). Formulation Formulation variables Particle size code COMP (% w/v) P-188 (% w/v) Mean (nm) PI P1 0.625 0.25 116 Æ 4 0.162 P2 0.625 5.0 1224 Æ 433 0.737 P3 0.625 5.0 1224 Æ 433 0.737 P4 2.5 5.0 110 Æ 15 0.167 P5 5.0 2.5 113 Æ 10 0.228 P6 5.0 5.0 101 Æ 14 0.222 P7 7.5 0.25 5918 Æ 2917 0.286 P8 7.5 2.5 199 Æ 7 0.200 P9 12.5 1.5 2442 Æ 1118 0.249 P10 12.5 2.5 1034 Æ 283 0.217 P11 15.0 0.25 9013 Æ 4322 1.000 P12 15.0 5.0 331 Æ 23 0.372 P13 15.0 5.0 331 Æ 23 0.372 COMP: Compritol 888 ATO, P-188: Poloxamer 188, PI: polydispersity index Table 3. Composition of carvedilol-loaded SLNs formulations obtained from the full factorial design and their respective particle size and entrapment efficiency (data shown as mean Æ standard deviation, n ¼ 3). Formulation variables Particle size EE Formulation code COMP (% w/v) P-188 (% w/v) Carvedilol (% w/v) Mean (nm) PI (%) F1 5.0 1.5 0.25 146 Æ 9 0.207 68.5 Æ 0.9 F2 5.0 1.5 0.88 285 Æ 24 0.195 90.3 Æ 2.6 F3 5.0 1.5 1.5 1319 Æ 46 0.412 93.5 Æ 0.2 F4 5.0 3.3 0.25 101 Æ 6 0.243 69.9 Æ 3.2 F5 5.0 3.3 0.88 130 Æ 8 0.183 89.5 Æ 3.8 F6 5.0 3.3 1.5 2486 Æ 83 0.601 94.6 Æ 2.2 F7 5.0 5.0 0.25 97 Æ 16 0.231 60.8 Æ 2.9 F8 5.0 5.0 0.88 124 Æ 3 0.128 86.4 Æ 6.4 F9 5.0 5.0 1.5 414 Æ 19 0.191 88.9 Æ 2.0 F10 6.3 1.5 0.25 218 Æ 27 0.241 71.5 Æ 4.3 F11 6.3 1.5 0.88 279 Æ 43 0.285 92.0 Æ 3.8 F12 6.3 1.5 1.5 667 Æ 12 0.289 93.6 Æ 2.1 F13 6.3 3.3 0.25 124 Æ 17 0.218 69.6 Æ 2.9 F14 6.3 3.3 0.88 227 Æ 66 0.232 86.8 Æ 0.8 F15 6.3 3.3 1.5 406 Æ 6 0.154 95.6 Æ 2.3 F16 6.3 5.0 0.25 98 Æ 7 0.233 67.3 Æ 9.8 F17 6.3 5.0 0.88 110 Æ 13 0.237 87.1 Æ 4.2 F18 6.3 5.0 1.5 327 Æ 42 0.154 93.3 Æ 1.2 F19 7.5 1.5 0.25 289 Æ 22 0.283 56.7 Æ 6.9 F20 7.5 1.5 0.88 470 Æ 10 0.209 87.3 Æ 6.2 F21 7.5 1.5 1.5 1125 Æ 290 0.324 95.0 Æ 2.7 F22 7.5 3.3 0.25 189 Æ 9 0.231 52.1 Æ 4.1 F23 7.5 3.3 0.88 216 Æ 39 0.22 88.0 Æ 4.8 F24 7.5 3.3 1.5 263 Æ 73 0.206 92.5 Æ 3.1 F25 7.5 5.0 0.25 109 Æ 8 0.236 62.7 Æ 2.1 F26 7.5 5.0 0.88 153 Æ 28 0.211 94.8 Æ 2.3 F27 7.5 5.0 1.5 217 Æ 144 0.209 93.7 Æ 3.5 COMP: Compritol 888 ATO, P-188: Poloxamer 188, PI: polydispersity index, EE: entrapment efficiency. DOI: 10.3109/10837450.2013.795169 Absorption of carvedilol-loaded solid lipid nanoparticles 3 PharmaceuticalDevelopmentandTechnologyDownloadedfrominformahealthcare.comby24.185.57.10on05/23/13 Forpersonaluseonly.
  • 4. A regression analysis was carried out to obtain a quadratic model in the form of: Y ¼ b0 þ b1A þ b2B þ b3C þ b4ðA à CÞ þ b5ðC à BÞ þ b6ðA à BÞ þ b7ðcurvatureÞ ð2Þ where Y is the response parameter associated with each factorial level combination, b0 is an intercept (constant), bi is the regression coefficient computed from obtained experimental values of Y, A, B and C stand for the formulation variables, A*C, C*B and A*B are for the interaction between the formulation variables, (curvature) is the quadratic term of the independent variables which was used to simulate the curvature of the designed sample space. A backward elimination procedure was used to fit the data to the quadratic model. Characterization of carvedilol-loaded SLNs Particle size Photon correlation spectroscopy was employed to measure particle size distributions of carvedilol-loaded SLNs, which were diluted 10 times using distilled water before the determin- ation. DelsaÔ Nano Series Zeta Potential and Submicron Particle Size Analyzer (Brea, CA) were used at a scattering angle of 90 at room temperature. Entrapment efficiency Entrapment efficiency was determined using the dialysis bag method which separates un-entrapped drug from the carvedilol- loaded SLN dispersions13 . Briefly, to determine un-entrapped drug, 1.0 mL of the 20.0 mL prepared formulation was placed in the dialysis bag (spectra/Por dialysis membrane MWCO: 6–8000) at 4 C in a beaker containing 20.0 mL of pH 6.8 phosphate buffer with 30% PEG 400. At predetermined time intervals, samples (1.0 mL each) were withdrawn for 8 h and immediately replaced with the fresh medium. The collected samples were diluted with 1.0 mL of methanol and analyzed by the HPLC method described previously14 . The following equation was used to calculate entrapment efficiency. EE ¼ Dt À Dm Dt  100 ð3Þ where EE ¼ entrapment efficiency, Dt ¼ total amount of drug initially added, Dm ¼ amount of drug in medium (un-entrapped). The carvedilol-loaded SLN dispersion (without un-entrapped drug) obtained at the end of the above-mentioned procedure were also measured for entrapment efficiency and mass balance was studied. Constrained optimization of carvedilol-loaded SLNs To further identify an optimal formulation, a constrained optimization technique was used to generate the optimum setting for the carvedilol-loaded SLNs. Therefore, two main constraints were used to optimize the carvedilol-loaded SLNs: (i) minimiza- tion of the particle size below 200 nm to promote lymphatic uptake and (ii) greater than 90% entrapment efficiency. The optimized formulation was subjected to particle size analysis, entrapment efficiency determination and in vitro drug release study. The proposed higher oral bioavailability of carvedilol from SLNs is mainly due to desired particle size leading to higher cellular uptake for lymphatic delivery. To minimize the potential passive absorption of premature released carvedilol from SLNs, in vitro drug release study was performed to ensure the retarded release of carvedilol in the upper gastrointestinal tract before the cellular uptake of SLNs by Peyer’s patches located in the distal ileum of the gastrointestinal tract. For the comparison of carvedilol release profile among formulations studied, in vitro drug release study was also performed in the environment of jejunum and ileum to minimize the release of carvedilol before the cellular uptake of SLNs. In addition, the release of carvedilol from SLNs, upon their uptake in the body, is a complex mechanism which was not well understood. Therefore, the parameters to be obtained from the carvedilol release profiles were not used for the constrained optimization of carvedilol- loaded SLNs. Lyophilization and tableting of carvedilol-loaded SLNs In order to obtain SLNs in a solid form, selected carvedilol-loaded SLNs dispersions were lyophilized using freeze dry/shell freeze system (Labconco, Kansas city, MO). Carvedilol-loaded SLN dispersions were diluted with 15% trehalose as a cryoprotectant at 1:1 ratio, frozen and lyophilized for 24 h to obtain formulation L-SLN15 . Core tablets of optimized formulation were prepared on a Carver Press (model C, Fred S. Carver Inc., Menomonee Falls, WI) using a 7.0 mm concave punch and 0.5 ton compression pressure. Being directly compressible binder, diluent and disin- tegrant Starch 1500 was used at 1:1 ratio. The core tablets were compression coated with 30 mg of Eudragit L100-55 to resist release of carvedilol in the acidic environment. An 8 mm punch at a compression pressure of 1.5 ton was used to provide a thin coating on the lateral sides as well as on the upper and lower sides of the core tablet. In vitro drug release study of carvedilol-loaded SLNs The in vitro release profiles of carvedilol from selected formu- lations of carvedilol-loaded SLNs (Table 3) and the optimized formulation were determined using dialysis bag technique. In addition, the in vitro release profiles obtained from the dispersion of the optimized formulation were compared with lyophilized powder (formulation L-SLNs), compress core tablet and enteric coated tablet having the same formulation components as optimized formulation. In order to confirm that the dialysis bags used (same as used previously for entrapment efficiency determination) acted as a filter only and allowed to separate the drug released from SLNs during the release medium sampling step, the distribution of carvedilol solution from the inside to the outside of the bags was also studied. The dialysis bags were soaked in distilled water for 12 h before use. The selected formulations of carvedilol-loaded SLNs (0.5 mL) were added to the dialysis bag and both ends of the bag were tied with clamps. In the case of solid dosage forms, 40 mg of accurately weighed lyophilized powders or each tablet containing 40 mg of lyophilized powders were added into the dialysis bag with 1.0 mL of dissolution medium. The bags were placed in a beaker containing 30.0 mL of dissolution medium, and the beakers were placed in a thermostatic shaker (VWR, Shell lab, Cornelius, OR) and then shaken horizontally 100 rpm at 37 C. To simulate the acidic conditions of the stomach and the gastric emptying time, 0.1 N HCl (pH 1.2) was used as release medium and samples were withdrawn at 15 min intervals for 2 h. In addition, to simulate the environment of jejunum and ileum, phosphate buffer solution (pH 6.8) containing 1% v/v of Tween 80 was used. Aliquots (0.5 mL) were withdrawn at predetermined 4 M. K. Shah et al. Pharm Dev Technol, Early Online: 1–11 PharmaceuticalDevelopmentandTechnologyDownloadedfrominformahealthcare.comby24.185.57.10on05/23/13 Forpersonaluseonly.
  • 5. time intervals and same volume was replaced with the fresh medium. The samples were analyzed by HPLC method to determine the drug content. All the studies were carried out in triplicate. Powder X-ray diffraction studies To study change in the degree of crystallinity of carvedilol when formulated as SLNs, pure materials and SLN formulations together with their physical mixture were characterized using Shimadzu X-Ray Diffractometer 6000 (Shimadzu, Columbia, MD). Samples were irradiated using a Cu target tube. A monochromator was used to select Ka 1 line. The scanning angle ranged from 10 to 50 of 2, steps were 0.02 of 2 and the counting time was 1 s/step. The scanning rate was 2 per min. The current used was 30 mA and the voltage was 40 kV. Cellular uptake of carvedilol-loaded SLNs Due to the limitation of in vitro methods available to evaluate the lymphatic absorption of carvedilol-loaded SLNs, cellular uptake studies of carvedilol from SLNs as compared to from carvedilol solution and physical mixture of components of SLNs were performed using Caco-2 cell line, which has been reported to be an indirect indication of lymphatic absorption16,17 . Human excised Caco-2 cell monolayer (HUVECs) was seeded in 48-well plates with complete fresh growth medium until cells were confluence. A stock dispersion of the optimized SLN formulation (FOPT) in DMEM (without serum and antibiotics) was prepared and various dilutions from this stock dispersion were used to study the effect of nanoparticles on uptake by the cells in the DMEM medium. To initiate the experiment, the medium in the wells was replaced with the various concentrations of nanopar- ticles and incubated for predetermined time. Since it was difficult to measure the number of nanoparticles, carvedilol concentration was used as an indication of nanoparticles uptake by the cells. This is based on the assumption that dilution of the stock dispersion resulted in various concentrations of nanoparticles as well as resulted in various concentrations of carvedilol accord- ingly. In addition, in order to differentiate the passive absorption of carvedilol from the active uptake of nanoparticles, several control experiments are needed. Therefore, drug solutions and components of optimized formulation as physical mixture (FOPT- PM) with same carvedilol concentrations of that from each respective concentration of nanoparticles in a DMEM media were prepared and evaluated. At the end of the incubation period, the nanoparticle dispersions or solutions containing media were removed from the wells and the cell monolayers were rinsed three times with PBS to remove un-uptaken cells, drug solutions and nanoparticles. For the cell lysate and solubilization, 0.1 mL of 1% triton-X 100 and 0.2 N NaOH in a 1:1 ratio was added to each well. To this, 0.4 mL of methanol was added, centrifuged and samples were analyzed using the previously described HPLC method for carvedilol concentration. Results and discussion Selection of lipid using solubility parameter The value of solubility parameter for the carvedilol was compared with the solubility parameter of various lipid carriers (Table 1). The solubility parameter for carvedilol was found to be 25.38 MPa1/2 while for a number of lipids evaluated in this investigation the values ranged between 17.26 MPa1/2 (tribehenin) and 21.42 MPa1/2 (Compritol ATO 888). It has been reported that miscibility between the drug and carrier increases when the difference in solubility parameters (D) between the drug and carrier11,12 is less than 7 MPa1/2 . The solubility of the drug in the lipid and hence the entrapment and physical stability of the drug in the SLNs is likely to increase with decrease in D. Therefore, Compritol ATO 888 (COMP) having the least value of D (3.96 MPa1/2 ) with carvedilol was chosen as the suitable lipid for further studies. Design of experiments for blank SLNs The particle size obtained from 13 blank SLNs formulations (based on fractional factorial design) ranged between 101 Æ 14 nm and 9013 Æ 4322 nm (Table 2). At 0.625% level of COMP concentration, increasing P-188 concentration from 0.25% (for- mulation P1) to 5.0% (formulation P2) lead to increase in particle size from 116 Æ 4 nm to 1224 Æ 433 nm with polymodal distribu- tion in the later case. When the concentration of COMP was increased to 5.0% level (formulations P5 and P6), the desired size range of SLNs (i.e. less than 200 nm) were obtained with both 2.5% and 5.0% concentration of P-188. Further increase in COMP concentration to 7.5%, 12.5% and 15.0% levels (formulations P7 through P13) lead to significant increase in particle size (except formulation P8 containing 7.5% COMP and 2.5% P-188) and did not produce SLNs of desired range irrespective of P-188 concentration used. To better understand the comparative effect of COMP and P-188 on particle size of SLNs, a surface response curve was plotted (Figure 1). SLNs with larger size were observed when either COMP or P-188 concentrations were at the higher levels. In addition, with suitable concentration combination of COMP and P-188, SLNs having particle size less than 200 nm could be obtained. To further evaluate the quantitative effect of COMP and P-188 as well as their interactions on the particle size of SLNs, an analysis of quadratic model (p50.0001) was performed and an equation having r2 value of 0.9989 was derived as below: Particle size ¼ 13:8 þ 8:37ðCOMPÞ À 4:52ðP-188Þ þ 14:05ðCOMPÞ2 þ 4:62ðP-188Þ2 À 18:38ðCOMP Ã P-188Þ ð4Þ The positive coefficients of COMP (p50.0001) and negative coefficient of P-188 (p50.0001) indicate that increase in COMP concentration increased particle size whereas increasing P-188 concentration helped to decrease the particle size. Moreover, the curvature (higher order, COMP (p ¼ 0.0004) and P-188 (p ¼ 0.0407) terms) indicates that increasing P-188 concentration up to a certain level helped to decrease the particle size whereas beyond a certain level, multiple layers started to form followed by increase in particle size. Furthermore, increasing COMP concen- tration up to a certain level was able to form SLNs with desired size of less than 200 nm whereas beyond a certain concentration, larger particles were obtained. Thus, the combination of COMP and P-188 concentrations (p50.0001) appears to play a crucial role on the particles size of SLNs produced. Design of experiments for carvedilol-loaded SLNs The results obtained from the particle size analysis of blank SLNs helped to understand the effects of COMP and P-188 on the particle size of SLNs. To predict the particle size for selecting the suitable concentration ranges of COMP and P-188 before incorporating the drug, Equation (4) was applied and the results are tabulated in Table 4. It can be seen from Table 4 that below the 2.5% level of COMP, the predicted particle size would be less than 200 nm as long as the concentration of P-188 was less than 1.5%. However, at low concentration of COMP, the drug loading would be expected to be less. Further increase in COMP concentration (above 7.5%) predicted particle size was larger DOI: 10.3109/10837450.2013.795169 Absorption of carvedilol-loaded solid lipid nanoparticles 5 PharmaceuticalDevelopmentandTechnologyDownloadedfrominformahealthcare.comby24.185.57.10on05/23/13 Forpersonaluseonly.
  • 6. than 200 nm in all the cases. Thus, the concentration range of COMP was selected from 5.0% to 7.5%. At this selected concentration range of COMP, the size of SLNs was predicted to be above 200 nm when concentration of P-188 was at low levels (i.e. 0.25% and 1.0%). Based on the approach of predicted particle size, selected concentration ranges for COMP and P-188 were 5.0% to 7.5% and 1.5% to 5.0%, respectively, in order to obtain the desired size of SLNs. However, after the loading of the drug onto the SLNs, the particle size of drug-loaded SLNs might increase further. Thus, the concentration range was selected such that, in the absence of drug, SLNs would be predicted to be less than 200 nm. During the loading of drug onto the SLNs, drug concentration would be the only factor affecting the particle size and entrapment efficiency of drug. Based on the application of Equation (4) and the predicted values of the particle size obtained, the selected concentration ranges of COMP and P-188 were able to minimize the number of formulations when an additional formulation variable (carvedilol concentration) was included for the fabrication of carvedilol- loaded SLNs. Therefore, a total of 27 formulations were derived and shown in Table 3 and subjected to the characterization of particle size and entrapment efficiency. Characterization of carvedilol-loaded SLNs Carvedilol-loaded SLNs were characterized by particle size, polydispersity index and entrapment efficiency. Particle size Particle size and polydispersity index (PI) of the 27 formulations obtained from the full factorial design are shown in Table 3. The magnitude of effect of the variables in the form of response surface curve is shown in Figure 2. The results indicate that the particle sizes of prepared formulations ranged from as low as 97 Æ 16 nm (formulation F7) to as high as 2486 Æ 83 nm 0 200 400 600 800 1000 1200 1400 1600 1800 2 4 6 8 10 12 14 1 2 3 4 Particlesize(nm) COM P concentration (% ) P-188 concentration (%) 400 600 800 1000 1200 1400 1600 1800 Figure 1. Response surface curve illustrating the effects of COMP and P- 188 concentrations on particle size of blank SLNs. Table 4. The selected concentration ranges of Compritol 888 ATO (COMP) and Poloxamer 188 (P-188) for the fabrication of carvedilol- loaded SLNs and their respective predicted particle size determined from the equation obtained in design of experiments for blank solid lipid nanoparticles. COMP (% w/v) P-188 (% w/v) Predicted particle size (nm) 1.25 0.25 105 1.25 1.0 136 1.25 1.5 172 1.25 5.0 1207 2.5 0.25 118 2.5 1.0 126 2.5 1.5 145 2.5 5.0 295 5.0 0.25 214 5.0 1.0 169 5.0 1.5 155 5.0 5.0 154 5.0 7.5 1414 7.5 0.25 475 7.5 1.0 330 7.5 1.5 264 7.5 5.0 206 7.5 7.5 638 7.5 10.0 2155 12.5 0.25 2149 12.5 1.0 1497 12.5 1.5 1162 12.5 5.0 279 15.0 0.25 4062 15.0 1.0 2921 15.0 1.5 1162 15.0 5.0 322 0 200 400 600 800 1000 1200 1400 5.0 5.5 6.0 6.5 7.0 7.5 0.4 0.6 0.8 1.0 1.2 1.4 Particlesize(nm) COM P concentration (% ) Carvedilol concentration (%) 0 200 400 600 800 1000 1200 1400 0 200 400 600 800 1000 1200 1400 1600 1.5 2.0 2.5 3.0 3.5 4.0 4.5 5.0 0.4 0.6 0.8 1.0 1.2 1.4 Particlesize(nm) P-188 concentration (% ) Carvedilol concentration (%) 0 200 400 600 800 1000 1200 1400 1600 Figure 2. Response surface curve demonstrating the effects of COMP, P-188 and carvedilol concentrations on particle size of carvedilol-loaded SLNs. 6 M. K. Shah et al. Pharm Dev Technol, Early Online: 1–11 PharmaceuticalDevelopmentandTechnologyDownloadedfrominformahealthcare.comby24.185.57.10on05/23/13 Forpersonaluseonly.
  • 7. (formulation F6). It was observed that when COMP and P-188 concentrations were kept constant, increasing carvedilol concentration from 0.25% to 1.5% lead to significant increase in particle size. Following the same approach of analyzing the particle size of blank SLNs, the quantitative effect of COMP, P-188, and carvedilol concentrations as well as their interactions on the particle size of carvedilol-loaded SLNs by means of a quadratic model (p50.0001) was evaluated and an equation having an r2 value of 0.8985 was derived as below: ðParticle sizeÞ ¼ 5:32 À 0:48ðP-188Þ þ 0:64ðCarvedilolÞ þ 0:26ðCarvedilolÞ2 À 0:26ðCOMP Ã CarvedilolÞ ð5Þ The absence of the COMP term in Equation (5) confirms that the selected concentration range of COMP was appropriate. It also indicates that COMP did not affect directly the size of the carvedilol-loaded SLNs and the selected concentration range of COMP was able to produce desired size range of carvedilol- loaded SLNs. In addition, the negative coefficient value for P-188 variable (p50.0001) suggests that increase in surfactant concen- tration lead to decrease in particle size, which is also in agreement with the previous results obtained. For the carvedilol variable included in Equation (5), as the concentration of carvedilol increases, the particle size of carvedilol-loaded SLNs was observed to increase as the positive and highest coefficient value of carvedilol variable (p50.0001) obtained. This type of phenomenon has also been observed by several other researchers which could be because of increased entrapment of the carvedilol18 . For instance, at 5% of COMP and 1.5% of P-188, increasing carvedilol concentration from 0.25% to 1.5% increased the particles size from 146 Æ 9 nm to 1319 Æ 46 nm (formulations F1, F2 and F3). The same trend was observed for the 6.3% and 7.5% COMP (formulations F10 to F27). At 0.25% of the carvedilol concentration, all the formulations were able to produce carvedilol-loaded SLNs below 200 nm except formula- tions F10 and F19 where P-188 concentration was insufficient to stabilize and fully cover the particles. In case of formulations F2, F11, F14, F20 and F23 where carvedilol concentration is 0.88%, the obtained carvedilol-loaded SLNs were larger than 200 nm due to insufficient surfactant concentration with respect to the lipid concentration. A further increase in carvedilol concentration to 1.5% level lead to carvedilol-loaded SLNs larger than 200 nm in all the cases. Apparently, higher carvedilol concentration resulted in greater entrapment which resulted in increased particle size. Entrapment efficiency The results of the entrapment efficiency of the 27 formulations obtained from the full factorial design are shown in Table 3. The magnitude of the effect of the variables was plotted using response surface curve and is shown in Figure 3. The entrapment efficiency of carvedilol-loaded SLNs ranged between 52.1 Æ 4.1% (formulation F22) and 95.6 Æ 2.3% (formulation F15). Keeping P- 188 and carvedilol concentrations constant, increase in COMP concentration led to increase in entrapment efficiency due to lipophilic nature of the COMP. For example, at 5% P-188 level, increase in COMP concentration from 5% to 7.5% lead to increase in entrapment efficiency from 86.4 Æ 6.4% (formulation F8) to 94.8 Æ 2.3% (formulation F26). Entrapment efficiency also increased when carvedilol concentration was increased from 0.25% to 1.5%. On the other hand, entrapment efficiency decreased with increase in P-188 concentration due to increased solubility of carvedilol in hot aqueous surfactant (i.e. P-188) solution, thus resulting in the loss of entrapment during fabrica- tion of SLNs stage. Following the same approach of analyzing the particle size of carvedilol-loaded SLNs, the quantitative effect of COMP, P-188, and carvedilol concentrations as well as their interactions on the entrapment efficiency of carvedilol-loaded SLNs using a quad- ratic model (p50.0001) was evaluated and the following equation having an r2 value of 0.9557 was derived: ðEntrapment efficiencyÞ ¼ 7796:1 þ 2321:17ðCarvedilolÞ À 1485:06ðCarvedilolÞ2 þ 352:67ðCOMP Ã P-188Þ þ 350:83ðCOMP Ã CarvedilolÞ ð6Þ Based on the results from Equation (6), at the selected concentration ranges of COMP, P-188, and carvedilol, carvedilol (p50.0001) as well as the interaction of COMP with P-188 (p ¼ 0.014) and carvedilol (p ¼ 0.0151), respectively, were the formulation variables affecting the entrapment efficiency of carvedilol-loaded SLNs. The positive coefficient value of carvedilol variable confirmed the assumption that incorporation of more drug leads to more entrapment because of lipophilic 50 60 70 80 90 100 5.0 5.5 6.0 6.5 7.0 7.5 0.4 0.6 0.8 1.0 1.2 1.4 Entrapmentefficiency(%) COM P concentration (% ) Carvedilol concentration (%) 50 60 70 80 90 100 50 60 70 80 90 100 1.5 2.0 2.5 3.0 3.5 4.0 4.5 5.0 0.4 0.6 0.8 1.0 1.2 1.4 Entrapmentefficiency(%) P-188 concentration (% ) Carvedilol concentration (%) 50 60 70 80 90 100 Figure 3. Response surface curve demonstrating the effects of COMP, P- 188 and carvedilol concentrations on entrapment efficiency of carvedilol- loaded SLNs. DOI: 10.3109/10837450.2013.795169 Absorption of carvedilol-loaded solid lipid nanoparticles 7 PharmaceuticalDevelopmentandTechnologyDownloadedfrominformahealthcare.comby24.185.57.10on05/23/13 Forpersonaluseonly.
  • 8. nature of carrier (i.e. COMP) which can accommodate more drug. It was expected that increase in lipid concentration will lead to increase in entrapment due to decreased tendency of the drug migration into the aqueous phase. At higher lipid concentration, it will provide more space to accommodate the drug19 . However, the off trend was observed in the case of 1.5% of P-188 where increasing lipid concentration did not increase entrapment efficiency. This may have been due to insufficient surfactant concentration which may not have been able to form a stable nanoparticulate system causing poor entrapment. Constrained optimization of carvedilol-loaded SLNs From the selected concentration ranges of COMP, P-188 and carvedilol, many of the 27 formulations generated from the full factorial design showed particle size of carvedilol-loaded SLNs below 200 nm. However, to further identify an optimal formula- tion, a constrained optimization technique was applied to generate the optimum setting for the carvedilol-loaded SLNs. From the constrained optimization, an optimized formulation (FOPT) with the composition of 7.5%, 5.0% and 1.11% of COMP, P-188 and carvedilol, respectively, was obtained. Based on the optimization approach, the theoretically predicted values for particle size and entrapment efficiency of optimized formulation were expected to be 151 nm and 94.6%, respectively. The experimentally obtained values of response parameters for this optimized formulation were 161 nm and 94.8% of entrapment efficiency which are in close agreement with the predicted values, suggesting the feasibility of this optimization approach. In vitro release study of carvedilol-loaded SLNs The in vitro release profiles of the selected carvedilol-loaded SLN formulations (Table 3) as well as the optimized formulation and carvedilol solution in phosphate buffer solution (pH 6.8) are shown in Figure 4. Carvedilol solution showed rapid and complete distribution from inside to outside of the dialysis bag within 1 h confirming that the dialysis bag functioned as a filter and was not a barrier of drug distribution. Entrapping carvedilol into a lipid by SLNs formulations were able to retard the drug release. Furthermore, the differences in release profiles of carvedilol from various SLNs formulations were due to differ- ences in concentrations of COMP, P-188 and carvedilol as formulation variables used to fabricate the carvedilol-loaded SLNs and thereby their outcomes of particle size and entrapment resulted from the differences of formulation variables. It was found that increasing carvedilol concentration from 0.25% (formulations F1, F7, F19 and F25) to 1.5% (formulations F3, F9, F21 and F27) lead to significant decrease in drug release rate. At low carvedilol concentration, about 60% to 100% drug was released at the end of 24 h whereas less than 40% of drug release was obtained when carvedilol concentration was increased from 0.25% to 1.5%. The decreased drug release could be attributed to the increased particle size and high entrapment attributed from higher carvedilol concentration used. However, keeping drug concentration and COMP concentration constant, increasing surfactant concentration led to increase in drug release. At 0.25% carvedilol concentration, when 1.5% of P-188 concentration (formulations F1 and F19) was used, about 70% drug was released at the end of 24 h whereas drug release increased to 100% when P-188 concentration was increased to 5.0% (formulations F7 and F25). Similar findings were obtained when carvedilol concentration was at 1.5% level (formulations F3 and F21 at 1.5% P-188 level as well as formulations F9 and F27 at 5.0% P-188 level). As expected, the optimized formu- lation was able to retard drug release and prolong the release over a period of 24 h. This may have been due to decreased particle size followed by increased surface area and decreased diffusion path length. In addition, entrapment was observed to decrease with increase in P-188 concentration and thus free drug could have played a role in increased drug release. On the other hand, drug release was observed to decrease when carvedilol and P-188 concentrations were kept constant and COMP concentra- tion was increased from 5% to 7.5%. In order to better understand the release mechanism of drug from SLNs formulations, the release profiles displayed in Figure 4 was plotted as cumulative drug released versus square root of time and shown in Figure 5. A linear relationship with regression value of 0.98 or greater was obtained in all selected carvedilol-loaded SLNs studied, thereby confirming the diffusion model for release mechanism from matrix type of delivery systems. In the present investigation, hot homogenization method was used to fabricate carvedilol-loaded SLNs suggesting the possible model could be combination of drug-enriched surface and solid solution where drug is molecularly dispersed in the lipid matrix10 . Time (h) 0 4 8 12 16 20 24 28 Cumulativedrugreleased(%) 0 20 40 60 80 100 120 F1 F3 F7 F9 F19 F21 F25 F27 FOPT Solution Figure 4. The in vitro release profiles of the selected formulations of carvedilol-loaded SLNs together with the optimized formulation (FOPT) as well as carvedilol solution as a control in phosphate buffer solution (pH 6.8) by dialysis membrane diffusion technique (data shown as mean Æ standard deviation, n ¼ 3). Time (h) 1/2 0.0 0.5 1.0 1.5 2.0 2.5 3.0 3.5 Cumulativedrugreleased(%) 0 20 40 60 80 100 120 F1 F3 F7 F9 F19 F21 F25 F27 FOPT Figure 5. Comparative relationships of cumulative amount of carvedilol released as a function of the square root of time from the selected formulations of carvedilol-loaded SLNs together with the optimized formulation (FOPT) in phosphate buffer solution (pH 6.8) by dialysis membrane diffusion technique (data shown as mean Æ standard deviation, n ¼ 3). 8 M. K. Shah et al. Pharm Dev Technol, Early Online: 1–11 PharmaceuticalDevelopmentandTechnologyDownloadedfrominformahealthcare.comby24.185.57.10on05/23/13 Forpersonaluseonly.
  • 9. Complete drug release from SLN formulations was obtained in an acidic medium (0.1 N HCl, pH 1.2) within 2 h of study due to the weakly basic nature of the drug and smaller particle size. This finding indicates a need to protect SLNs from the stomach if improved bioavailability has to be achieved by active absorption from the Peyer’s patches located particularly in the distal ileum of the intestinal tract. Therefore, the in vitro release profiles obtained from the optimized formulation as a liquid dispersion, as well as from other solid dosage forms such as lyophilized powder (L-SLNs), compressed core tablet, and enteric coated tablet having the same formulation components as optimized formulation were compared (Figure 6). All dosage forms were studied in PBS (pH 6.8) as release medium for 12 h except that the enteric coated tablet was kept in 0.1 N HCl (pH 1.2) for 2 h and then placing it in PBS (pH 6.8) for 10 h. Interestingly, similar release pattern was observed with lyophi- lized SLNs and un-lyophilized SLNs (i.e. optimized formula- tion). However, higher drug release rate was observed from lyophilized L-SLNs as compared to un-lyophilized SLNs. The possible reason could be attributed to the effect of cryoprotect- ant (trehalose) and possible structural change that might have occurred during lyophilization process. In addition, similar drug release profiles were obtained from L-SLNs, compressed core tablet and enteric coated tablet confirming the ability of prepared tablets to exhibit the same release kinetics as L-SLNs. Furthermore, prolonged controlled release profiles of carvedilol over the period of 12 h from these solid dosage forms were obtained. Therefore, it can be concluded that the carvedilol-loaded SLNs based enteric-coated tablet was able to protect the carvedilol from the acidic environment of the stomach and drug release was retarded before the uptake of carvedilol-loaded SLNs from small intestine region. Powder X-ray diffraction X-ray diffraction patterns of carvedilol, COMP, P-188, physical mixture of FOPT and lyophilized SLNs of FOPT are shown in Figure 7. Carvedilol showed characteristic crystalline peaks from 15 to 30 , with the peak at 24 being the most prominent with intensity of 6 000 cps. COMP showed crystalline peak at 21 with intensity of 12 400 cps whereas PLX 188 (which is semi- crystalline in nature) showed peaks at 19 and 23.5 of 2. In the case of FOPT-based physical mixture, similar peaks were observed but with lesser intensity. When carvedilol was incorporated into SLNs, absence of crystalline peak for carvedilol and decrease in the peak of COPM and P-188 indicates conversion of crystalline carvedilol to amorphous form in the SLNs. Time (h) 0 2 4 6 8 10 12 14 Cumulativedrugreleased(%) 0 20 40 60 80 100 SLNs dispersion L-SLNs Core tablet Enteric coated tablet Figure 6. Comparison of the in vitro release profiles obtained from the optimized formulation as a liquid dispersion form as well as from other type of solid dosage forms such as lyophilized powder (L-SLNs), compress core tablet, and enteric-coated tablet having the same formu- lation components as optimized formulation (data shown as mean Æ standard deviation, n ¼ 3). Figure 7. X-ray diffraction pattern of pure, COMP, P-188, carvedilol and optimized formulation (FOPT)-based physical mixture as well as its lyophilized SLNs. DOI: 10.3109/10837450.2013.795169 Absorption of carvedilol-loaded solid lipid nanoparticles 9 PharmaceuticalDevelopmentandTechnologyDownloadedfrominformahealthcare.comby24.185.57.10on05/23/13 Forpersonaluseonly.
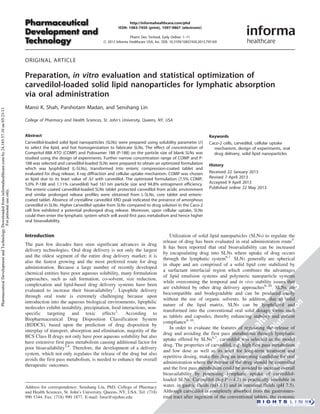
  • 10. Cellular uptake of carvedilol-loaded SLNs Higher amount of carvedilol uptake were found in all cases of FOPTs as compared to the drug solutions and physical mixtures of FOPT, irrespective of carvedilol concentrations studied (Figure 8). The uptake by Caco-2 was found to be dependent on the concentration of carvedilol and hence the concentration of nanoparticles in the medium. It was observed that when the concentration of carvedilol was increased from 10 mg/mL to 200 mg/mL, the amount of drug uptake increased from carvedilol solutions and physical mixture of FOPTs. This finding indicates a characteristic of passive transport of drug molecules from carvedilol solutions and physical mixture of FOPTs. The similar higher cellular uptake of drug from drug-loaded SLNs as compared to the drug solution has been reported20,21 . The higher amount of carvedilol from FOPTs as compared to the carvedilol solution and physical mixture of FOPTs suggested the crucial role of SLNs as a carrier for preferential cellular uptake through Caco-2 cells. Caco-2 cells have been widely developed, used and accepted tool for the investigation of transport across the small intestinal epithelium of many substances22 . The direct relationship of Caco- 2 cell line with the lymphatic absorption has not been evaluated to the best of our knowledge. However, Caco-2 cell line has been used to determine the effect of lipid-based excipients as formulation variable for the lymphatic delivery of therapeutic agents. Amongst the lipidic excipients evaluated, the long-chain fatty acids forms lipoprotein assembly by associating with intestinal lipoproteins in the enterocytes and thereby facilitates the lymphatic transport of therapeutic agents16,17,23–25 . Thus, Caco-2 cell line could have a potential application as screening tool for lipid-based formulations targeted to lymphatic absorption. The long-chain fatty acid (COMP) was used in the present investigation for the preparation of FOPTs. Therefore, FOPTs, after the cellular uptake, association of COMP with the intestinal lipoprotein might have potential to promote the lymphatic absorption of carvedilol. Conclusion Solubility parameter was found to be a useful tool for the selection of lipid to fabricate SLNs. Design of experiments with blank SLNs helped to understand the interaction of formulation variables and minimized the number of experiments with the drug. Carvedilol-loaded SLNs with minimal particle size and high entrapment was successfully developed using statistical optimiza- tion. The in vitro drug release study ensured the retarded release of carvedilol in the gastrointestinal tract before the cellular uptake of SLNs. Followed by cellular uptake from small intestinal region, carvedilol-loaded SLNs could have potential to gain access to the lymphatic system which will avoid the first pass metabolism and hence higher bioavailability. Acknowledgements The authors acknowledge St. John’s University for providing financial assistance and research facilities to carry out this research. Declaration of interest The authors declare no conflict of interest (monetary or otherwise) in conducting this research. The authors alone are responsible for the content and writing of the paper. References 1. Pouton CW. Formulation of poorly water-soluble drugs for oral administration: physicochemical and physiological issues and the lipid formulation classification system. Eur J Pharma Sci 2006;29: 278–287. 2. Pavankumar B, Karimulla SK. Solid lipid nanoparticles – a brief review. Int J Adv Biopharm 2012;2:35–55. 3. Ku M. Use of the biopharmaceutical classification system in early drug development. The AAPS Journal 2008;10:208–212. 4. Wu CY, Benet LZ. Predicting drug disposition via application of BCS: transport/absorption/elimination interplay and development of a biopharmaceutics drug disposition classification system. Pharm Res 2005;22:11–23. 5. Tsai MJ, Huang YB, Wu PC, et al. Oral apomorphine delivery from solid lipid nanoparticles with different monostearate emulsifiers: pharmacokinetic and behavioral evaluations. J Pharm Sci 2011;100: 547–557. 6. Bargoni A, Cavalli R, Caputo O, et al. Solid lipid nanoparticles in lymph and plasma after duodenal administration to rats. Pharm Res 1998;15:745–750. 7. Yang S, Zhu J, Lu Y, et al. Body distribution of camptothecin solid lipid nanoparticles after oral administration. Pharm Res 1999;16: 751–757. 8. Mehnert W, Mader K. Solid lipid nanoparticles: production, characterization and applications. Adv Drug Deliv Rev 2001;47: 165–196. 9. Muchow M, Maincent P, Muller RH. Lipid nanoparticles with a solid matrix (SLN, NLC, LDC) for oral drug delivery. Drug Dev Ind Pharm 2008;34:1394–1405. 10. Muller RH, Mader K, Gohla S. Solid lipid nanoparticles (SLN) for controlled drug – a review of the state of the art. Eur J Pharm Biopharm 2000;50:161–177. 11. Greenhalgh DJ. Solubility parameters as predictors of miscibility in solid dispersions. J Pharm Sci 1999;88:1182–1190. 12. Barton AFM. CRC handbook of solubility parameters and other cohesion parameters. 2nd ed. Boca Raton, FL: CRC Press, 1991. 13. Misra A, Kalariya M, Padhi B, Chougule M. Methotraxate loaded solid lipid nanoparticles for topical treatment of psoriasis: formu- lation clinical implications. Drug Del Tech 2004;4:1–12. 14. Lanlan W, Peinan S, Shufang N, Weisan P. Preparation and evaluation of SEDDS and SMEDDS containing carvedilol. Drug Dev Ind Pharm 2005;31:785–794. 15. Schwarz C, Mehnert W. Freeze-drying of drug-free and drug-loaded solid lipid nanoparticles (SLN). Int J Pharm 1997;157:171–179. 16. Caliph SM, Charman WN, Porter CJ. Effect of short-, medium-, and long-chain fatty acid-based vehicles on the absolute oral bioavail- ability and intestinal lymphatic transport of halofantrine and assessment of mass balance in lymph-cannulated and non-cannu- lated rats. J Pharm Sci 2000;89:1073–1084. 17. Trevaskis NL, Charman WN, Porter CJ. Lipid-based delivery systems and intestinal lymphatic drug transport: a mechanistic update. Adv Drug Del Rev 2008;60:702–716. Carvedilol concentration (µg/mL) 0 50 100 150 200 250 CarvedilolamountobtainedinCaco-2cells(µg) 0 50 100 150 200 250 FOPT-SLN FOPT-Physical mixture Carvedilol solution Figure 8. The cellular uptake mechanism of nanoparticles from the optimized formulation (FOPT) of SLNs together with their physical mixtures and carvedilol solutions as control groups by in vitro model using Caco-2 cell line (data shown as mean Æ standard deviation, n ¼ 3). 10 M. K. Shah et al. Pharm Dev Technol, Early Online: 1–11 PharmaceuticalDevelopmentandTechnologyDownloadedfrominformahealthcare.comby24.185.57.10on05/23/13 Forpersonaluseonly.
  • 11. 18. Liu CH, Wu CT, Fang JY. Characterization and formulation optimization of solid lipid nanoparticles in vitamin K1 delivery. Drug Dev Ind Pharm 2010;36:751–761. 19. Shah KA, Date AA, Joshi MD, Patravale VB. Solid lipid nanoparticles (SLN) of tretinoin: potential in topical delivery. Int J Pharm 2007;345:163–171. 20. Yuan H, Miao J, Du YZ, et al. Cellular uptake of solid lipid nanoparticles and cytotoxicity of encapsulated paclitaxel in A549 cancer cells. Int J Pharm 2008;348:137–145. 21. Miglietta A, Cavalli R, Bocca C, et al. Cellular uptake and cytotoxicity of solid lipid nanospheres (SLN) incorporating doxo- rubicin or paclitaxel. Int J Pharm 2000;210:61–67. 22. Gaumet M, Gurny R, Delie F. Localization and quantification of biodegradable particles in an intestinal cell model: the influence of particle size. Eur J Pharm Sci 2009;36:465–473. 23. Porter CJ, Trevaskis NL, Charman WN. Lipids and lipid-based formulations: optimizing the oral delivery of lipophilic drugs. Nat Rev Drug Discov 2007;6:231–248. 24. Pouton CW, Porter CJ. Formulation of lipid-based delivery systems for oral administration: materials, methods and strategies. Adv Drug Deliv Rev 2008;60:625–637. 25. Porter CJ, Pouton CW, Cuine JF, Charman WN. Enhancing intestinal drug solubilisation using lipid-based delivery systems. Adv Drug Deliv Rev 2008;60:673–691. DOI: 10.3109/10837450.2013.795169 Absorption of carvedilol-loaded solid lipid nanoparticles 11 PharmaceuticalDevelopmentandTechnologyDownloadedfrominformahealthcare.comby24.185.57.10on05/23/13 Forpersonaluseonly.