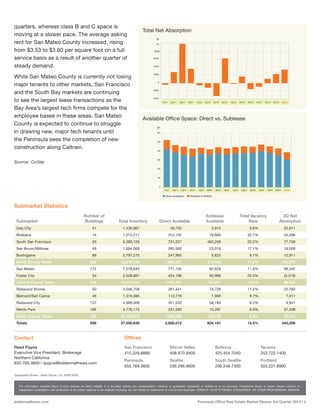
1. Total Net Absorption
Available Office Space: Direct vs. Sublease
SF
Direct Availability Sublease Availability
0
1M
2M
3M
4M
5M
6M
4Q12 1Q13 2Q133Q122Q121Q124Q113Q112Q111Q11 3Q13 3Q144Q13 1Q14 2Q14
SF
4Q12 1Q13 2Q133Q122Q121Q124Q113Q112Q111Q11 3Q13 3Q144Q13 1Q14 2Q14
-400K
-200K
0
200K
400K
600K
800K
1M
quarters, whereas class B and C space is
moving at a slower pace. The average asking
rent for San Mateo County increased, rising
from $3.53 to $3.60 per square foot on a full
service basis as a result of another quarter of
steady demand.
While San Mateo County is currently not losing
major tenants to other markets, San Francisco
and the South Bay markets are continuing
to see the largest lease transactions as the
Bay Area’s largest tech firms compete for the
employee bases in these areas. San Mateo
County is expected to continue to struggle
in drawing new, major tech tenants until
the Peninsula sees the completion of new
construction along Caltrain.
Source: CoStar
kiddermathews.com
This information supplied herein is from sources we deem reliable. It is provided without any representation, warranty or guarantee, expressed or implied as to its accuracy. Prospective Buyer or Tenant should conduct an
independent investigation and verification of all matters deemed to be material, including, but not limited to, statements of income and expenses. CONSULT YOUR ATTORNEY, ACCOUNTANT, OR OTHER PROFESSIONAL ADVISOR.
Peninsula Office Real Estate Market Review 3rd Quarter 2014 | 2
San Francisco
415.229.8888
Peninsula
650.769.3600
Silicon Valley
408.970.9400
Seattle
206.296.9600
Bellevue
425.454.7040
South Seattle
206.248.7300
Tacoma
253.722.1400
Portland
503.221.9900
Contact
Reed Payne
Executive Vice President, Brokerage
Northern California
650.769.3600 | rpayne@kiddermathews.com
Offices
Designated Broker: Reed Payne | LIC #00818935
Submarket Statistics
Submarket
Number of
Buildings Total Inventory Direct Available
Sublease
Available
Total Vacancy
Rate
3Q Net
Absorption
Daly City 41 1,430,867 49,752 3,915 3.8% 22,611
Brisbane 14 1,015,211 312,132 19,689 32.7% 34,286
South San Francisco 93 5,389,128 731,257 463,209 22.2% 77,758
San Bruno/Millbrae 49 1,684,069 265,560 23,018 17.1% 16,009
Burlingame 86 2,797,270 247,860 5,625 9.1% 12,911
North County Totals 282 12,316,545 1,606,561 515,456 17.0% 163,575
San Mateo 172 7,578,645 771,105 62,629 11.0% 99,542
Foster City 34 2,528,867 424,196 92,998 20.5% (3,319)
Central County Totals 206 10,107,512 1,195,301 155,627 15.8% 96,223
Redwood Shores 50 3,046,709 261,441 79,728 11.2% 25,760
Belmont/San Carlos 46 1,318,385 112,776 1,900 8.7% 7,411
Redwood City 157 4,999,309 351,252 58,183 8.2% 9,941
Menlo Park 185 5,776,175 331,530 13,297 6.0% 37,298
South County Totals 438 15,140,578 1,056,999 153,108 8.5% 80,410
Totals 926 37,550,635 3,856,012 824,191 12.5% 340,208