Red flags... some warning signs for companies with potentially high credit risk
•Download as PPT, PDF•
2 likes•300 views

As of Q4 2016 we are in a weak economic environment and there are heightened political and regulatory risks. Understanding and managing your exposure to the credit risk of companies you deal with is crucial. This presentation highlights some of the potential red flags when assessing corporate credit risk

Recommended
Recommended
More Related Content
Recently uploaded
Recently uploaded (20)
Featured
Featured (20)
Red flags... some warning signs for companies with potentially high credit risk
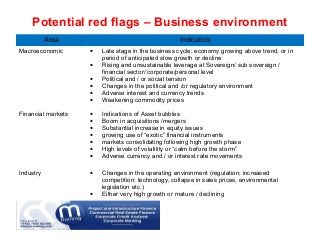
- 1. Potential red flags – Business environment Area Indicators Macroeconomic • Late stage in the business cycle; economy growing above trend, or in period of anticipated slow growth or decline • Rising and unsustainable leverage at Sovereign/ sub sovereign / financial sector/ corporate/personal level • Political and / or social tension • Changes in the political and /or regulatory environment • Adverse interest and currency trends • Weakening commodity prices Financial markets • Indications of Asset bubbles • Boom in acquisitions /mergers • Substantial increase in equity issues • growing use of “exotic” financial instruments • markets consolidating following high growth phase • High levels of volatility or “calm before the storm” • Adverse currency and / or interest rate movements Industry • Changes in the operating environment (regulation; increased competition; technology, collapse in sales prices, environmental legislation etc.) • Either very high growth or mature / declining
- 2. Potential red flags – market indicators Area Indicators Financial market indicators for a corporate Equity underperformance relative to peer groups Stock price not reacting as would be expected to underlying performance Credit pricing higher than would be indicated by its rating / financial performance CDS rates and CDS Indices Loan and bond pricing Financial leverage and structure that exposes company to relatively small changes in interest and /or currency rates
- 3. Potential red flags – risks facing the business and management issues Area Indicators Risks • Adverse trends in key drivers of company’s performance (e.g. regulation; major costs; risk concentrations ( e.g. lack of diversification in revenues)) • Potentially large operating exposures e.g. lawsuits, operating disasters • Technological developments Company • High growth rates relative to its peers but declining operating margins particularly if heavily debt financed , and especially at late stages of the economic cycle • Market position deteriorating • Reputation for poor quality products / services • Unusual number of companies in group for its size and many partly owned companies • Significant change in strategy, particularly if there is a large number of leveraged acquisitions in “new” business areas • Lack of flow of information; late and inaccurate information; lack of responsiveness to questions Corporate Governance • Control by a limited number of individuals; no external checks • “High profile” or secretive management • Mixed private and public ownership – split capital structure with private owners having control of stock with heavy voting rights
- 4. Potential red flags – financial performance Area Indicators Accounting • Clear signs of aggressive accounting • Extensive dealings with related companies • Changes in auditors and / or multiple auditors • Small audit firm in relation to size of company • Regular and / or material restatements of financials Off balance sheet items and heavy commitments • Major amounts ( large in relation to company) of contingencies; operating commitments, “off balance sheet finance”; and derivatives • Anticipated large capital expenditure commitments requiring external funding • Potentially large unfunded liabilities ( pensions, healthcare costs, environmental costs, lawsuits etc.) Financial performance • Lower performance than peer group with weak operating and debt service ratios • Significant exceptional items • Limited “headroom” before breaching financial covenants • Low debt in relation to interest expense at prevailing interest rates ( “window dressing”) • Profitability but weak cash flow • Adverse trends in ratios such as receivables days which may indicate creative accounting • Substantial amounts of cash at the same time as company has large amounts of debt
- 5. Potential red flags – capital structure Area Indicators Capital structure • Weak capitalization and debt service coverage • Bunching of debt maturities • Liquidity constraints • Significant use of Structured Finance and “off balance sheet finance”, and hybrid capital instruments • Complicated capital structure with “exotic” financing techniques • Material exposure to interest and currency fluctuations • Share buybacks in reaction to weak stock performance, particularly if debt financed
- 6. Potential red flags – capital structure Area Indicators Capital structure • Weak capitalization and debt service coverage • Bunching of debt maturities • Liquidity constraints • Significant use of Structured Finance and “off balance sheet finance”, and hybrid capital instruments • Complicated capital structure with “exotic” financing techniques • Material exposure to interest and currency fluctuations • Share buybacks in reaction to weak stock performance, particularly if debt financed