SlideShare a Scribd company logo
1 of 26
Download to read offline
Agricultural Water Management
Intra-block spatial and temporal variability of plant water status and its effect on grape
and wine parameters
--Manuscript Draft--
Manuscript Number: AGWAT-D-20-00151
Article Type: Research Paper
Keywords: Anthocyanins; Tannins; Yield; Cabernet Sauvignon; Stem water potential; Micro-
vinification
Abstract: Improving wine quality is a critical factor for the wine industry. For that matter, phenolic
compounds play an important role in wine quality contributing to its organoleptic
characteristics. Although several factors can influence the phenolic concentration,
water in particular has shown to have a direct impact on the phenolic compounds. It is
however complex to quantitate water stress by plant water status measurements as
they depend on the specific site (topography, viticultural management practices and
soil characteristics) creating variable values with-in the vineyard block. This study
focused on analysing the effect of natural and temporal variability of plant water status
on grape and wine parameters. A field experiment was done in a commercial Cabernet
Sauvignon block to monitoring the temporal and spatial intra-block variability of plant
water status using a grid sample method. Soil analysis and topography were included
in the evaluation. Each target vine was assessed for yield, ripeness as well as
standard juice parameters. Micro-vinification was done for each target vine in small lots
of 2 kg and the concentration of flavonoids (anthocyanins and tannins) analysed. The
results showed that the spatial and temporal variability was evident along the season.
Plant water status influenced changes in the concentration of phenolic compounds and
grape parameters. The vines in the stressed class were associated with changes in
soil texture and topography. These plants presented a significant increase in sugar
content, anthocyanins and tannins and a strong decrease in yield. The results of this
study may help to understand and quantify how spatial variability is naturally distributed
and its effect on grape and wine quality parameters.
Powered by Editorial Manager® and ProduXion Manager® from Aries Systems Corporation
Highlights
• Several factors can influence the phenolic concentration in wine; however, water stress has a direct
impact.
• Plant water status is variable with-in the vineyard block and depend on the specific site conditions
(topography, management practices and soil characteristics).
• A field experiment was done in a commercial Cabernet Sauvignon block to monitoring the temporal
and spatial intra-block variability of plant water status using a grid sample method.
• The level of water stress reached by the vines was associated with changes in soil texture,
topography, and climatic conditions along the season.
• The vines in the stressed class presented a significant increase in sugar content, anthocyanins and
tannins and a strong decrease in yield.
Highlights
Intra-block spatial and temporal variability of plant water status and its
effect on grape and wine parameters
Aladino Jasse1
, Anke Berry1
, Carlos Poblete-Echeverría1,
*
1
Department of Viticulture and Oenology, Faculty of AgriSciences, Stellenbosch University, Private Bag X1,
Matieland 7602, South Africa.
* Correspondence: cpe@sun.ac.za; Tel.: +27-21-808-2747
Abstract
Improving wine quality is a critical factor for the wine industry. For that matter, phenolic compounds play an
important role in wine quality contributing to its organoleptic characteristics. Although several factors can
influence the phenolic concentration, water in particular has shown to have a direct impact on the phenolic
compounds. It is however complex to quantitate water stress by plant water status measurements as they depend
on the specific site (topography, viticultural management practices and soil characteristics) creating variable
values with-in the vineyard block. This study focused on analysing the effect of natural and temporal variability
of plant water status on grape and wine parameters. A field experiment was done in a commercial Cabernet
Sauvignon block to monitoring the temporal and spatial intra-block variability of plant water status using a grid
sample method. Soil analysis and topography were included in the evaluation. Each target vine was assessed
for yield, ripeness as well as standard juice parameters. Micro-vinification was done for each target vine in
small lots of 2 kg and the concentration of flavonoids (anthocyanins and tannins) analysed. The results showed
that the spatial and temporal variability was evident along the season. Plant water status influenced changes in
the concentration of phenolic compounds and grape parameters. The vines in the stressed class were associated
with changes in soil texture and topography. These plants presented a significant increase in sugar content,
anthocyanins and tannins and a strong decrease in yield. The results of this study may help to understand and
quantify how spatial variability is naturally distributed and its effect on grape and wine quality parameters.
Keywords: Anthocyanins; Tannins; Yield; Cabernet Sauvignon; Stem water potential; Micro-vinification.
Manuscript File Click here to view linked References
2
1. Introduction
Plant water status in a vineyard is variable inside of the blocks (intra-block variability) according to
topography, viticultural management practices, and soil characteristics. Previous research has established that
vine and bunch variability have a direct impact on the composition of the final wine (Kontoudakis et al. 2010).
Although the grape parameters, such as yield, present spatial variability in the same block, traditional viticulture
approaches the variability in the field in a uniform manner (Arnó et al. 2009). To this end, Precision Viticulture
(PV) technologies aims at understanding and managing the spatial variability. PV covers a wide group of
techniques and technologies with the objective of controlling spatial variability improving grape quality,
adjusting crop management to field spatial variability (Santesteban 2019). Irrigation strategies such as regulated
deficit irrigation (RDI) largely affect plant water status (Acevedo-Opazo et al. 2010) when applied in specific
areas of the vineyards. Interestingly, Brillante et al. (2017) demonstrated that spatial variability in plant water
status still exist in a homogenous irrigation scheme.
Advances of wine production methods have led to the awareness of phenolic compounds impacting
wine quality (Kennedy et al. 2006). Phenolic compounds are a crucial quality parameter of wines contributing
to their organoleptic characteristics, particularly to colour, flavour, texture, and astringency of the wine and to
its antioxidant properties (Teixeira et al. 2013). The sensory attributes are determined by the grape physiological
and phenolic ripeness when the winemaker decides to harvest and are directly related with the level of phenolics
in the berry (Adams 2006). Standard physiological ripeness parameters such as sugar concentration, titratable
acidity, pH, and sensorial taste are straightforward to evaluate at harvest, however, phenolic ripeness is costly
and time-consuming (Guidetti et al. 2010). In this sense, to answer wine consumer demands, winemakers and
researchers have focused on controlling phenolic ripeness (Kontoudakis et al. 2010). When grapes reach the
ripe stage (red berries) skins are rich in flavonols, flavan-3-ols and anthocyanins, while seeds are known to be
high in flavan-3-ols, which contributes to astringency and bitterness (Williams 2012). It has been demonstrated
that the presence of phenolic compounds in the final wine is dependent on the biosynthesis in the grapevine,
the phenolic ripeness process (Adams 2006), winemaking, and ageing (Monagas et al., 2006). Different factors
can therefore influence the concentration of phenolic compounds. Previous research has established the impact
of viticulture practices, different oenological techniques (Nel 2018), variety, vintage, and location on the
phenolic composition of grapes and wines (Cliff et al. 2007).
3
Viticultural practices can influence berry secondary metabolite concentrations and therefore contribute
to wine sensorial attributes, antioxidant capacity, stabilization, and protection during aging (Ferrandino &
Lovisolo 2014). This concept is supported by Vilanova et al. (2009) who noted that scientific literature perceives
environmental conditions or viticultural practices as having a strong impact on the concentration of flavonoids.
Guidoni et al. (2008) reported that berry phenolic ripening is directly impacted by seasonal climatic conditions
and viticulture practices (cluster thinning and leaf removal). It has been widely reported that plant water status
can influence the levels of phenolic compounds in grapes and wine (e.g. Braidot et al. 2008; Deloire et al. 2004;
Downey et al. 2006). A detailed examination of the influence of viticulture practices on grape phenolic
compounds is presented by Brillante et al., (2018), in this study, the authors determined that the application of
water restrictions to grapevine has a higher influence on berry ripening than canopy management. Overall, there
seems to be some evidence to indicate that reducing plant water status has an implication on skin concentration
of tannins and anthocyanins in berries with the same size (Roby et al. 2004). Along with the level of water
deficit, the period of water stress also plays an important role. The application of water stress before or after
veraison, is significant in determining fruit and wine phenolic composition. Bindon et al. (2011), Blancquaert
et al. (2019) and Kennedy et al. (2002) suggested that water deficit applied before or after veraison affects the
biosynthesis of flavonoids in a different manner.
It is therefore important to understand the development of chemical compounds from grapes to wine
in a spatial and temporal context with the aim of improving viticulture practices, such as irrigation, which can
aid in achieving better wine quality. Therefore, this study is focused primarily on evaluating spatial and temporal
natural intra-block plant water status variability as well as traditional harvest parameters to investigate the effect
of these variations on grape and wine quality parameters by defining classes of water stress.
2. Methods and material
2.1. Site description, soil, and weather data
The study was carried out during the growing season 2019-2020 at a commercial vineyard (Thelema
Mountain Vineyards). The experimental site is located at the Stellenbosch Wine of Origin district, Simonsberg-
Stellenbosch ward – South Africa (SAWIS, 2014), 33°54'11.8"S - 18°55'12.4"E and at 430 m above sea-level.
The geology of the region is characterized by compacted sedimentary formations of the Malmesbury Group from
the Precambrian Era (King 1983; Carey 2005).
4
The climate in the area is Mediterranean with winter rainfall. According to Köppen-Geiger climate
classification it presents a Dry and Warm Summer -Csb (Peel et al., 2007), receiving summer morning Northerly
hot winds and afternoon cooler South-Westerly breezes originating from False Bay (Morgenthal 2004). The
seasonal (from September 2019 to February 2020) maximum average temperature was 33.03°C and minimum
average temperature was 10.65°C, and the seasonal effective rainfall is approximately 639.05 mm.
The experimental block is composed of 2.24 ha of sandy loam soil with a pH of 5.7, planted in 2003 with
vines cv. Cabernet Sauvignon (clone CS 338 C), grafted on 101-114 Mgt rootstock - Vitis riparia x Vitis rupestris.
The 4,840 planted vines in the block have an inter row spacing of 2.5 m and 2 m of vine spacing. The vines were
trained to a Vertical Shoot Positioning (VSP) trellis system with bi-lateral cordon and spur pruned. The block has
an orientation North/South, facing South. The vineyard was drip-irrigated with emitters spaced at 0.6 m and totally
delivering 2.3 L/h per vine. The historical average yield in the block is 8.24 Ton/ha with an average of 4.0 kg/vine.
2.2. Selection of the target vines
A combination of plant, soil and water stress variables were measured and analysed to select the target
vines, covering all the spatial variability conditions (different levels of vigour) presented in the experimental block.
Soil surface electrical conductivity (ECa), Trunk circumference (TC), and Normalized difference vegetation index
(NDVI) (from previous seasons) were used to locate the target vines.
2.2.1. Soil surface electrical conductivity (ECa)
At the beginning of the experiment, (September 2019), ECa was measured, using an electromagnetic
sensor (EM38, Geonics Ltd., Mississauga, Canada) together with a Garmin eTrex 10 GPS. The GPS locations
of each vine in the block were manually geo-corrected using the number of vines per row, distance between
vines and length of the rows. The entire block was scanned in a row alternate sequence, with a sampling
frequency of 5 reads per second on vertical dipole mode.
2.2.2. Trunk circumference
At the same period that ECa was measured (September 2019), TC of all vines in the block was
determined by manual measuring the circumferences of the trunk at an average section between 10 cm above
the graft union and 10 cm bellow the head of the vine.
5
2.2.3. Normalized difference vegetation index
The standard normalized vegetation index (NDVI) from 2 previous seasons (2017-2018 and 2018-
2019) was calculated for the maximum vegetative growth period (January to February) using Sentinel-2A
images corresponding to T34HCH tile. Free-cloud atmospherically corrected images were downloaded from
the European Space Agency (ESA) Copernicus project website. NDVI was calculated in R (R Core Team, 2020)
using the standard equation proposed by Rouse et al. (1974).
2.2.4. k-means analysis
Data from ECa, TC and NDVI was analysed generating classes of variability using the standard
unsupervised k-means function in R (R Core Team, 2020). The k-means algorithm is one of the most used
methods for clustering and it partitions the data by minimizing the within-cluster sum of squares to achieve
higher within-cluster similarity. The basic idea behind k-means clustering consists of defining clusters so that
the total intra-cluster variation is minimized (Zhao et al. 2010). In this study, the experimental vineyard block
was divided arbitrarily into 4 spatial clusters for each analysed variable. The clusters were ordered in ascending
way and then in the matching areas the target vines were located considering a separation of 5 vineyard rows to
cover the whole vineyard block. As a result, a total of 43 target vines were selected (Fig. 1). The block edges
were avoided in order to decrease the influence of winds, solar exposition, and water streams on vine
measurements. All target vines were subjected to the same canopy management, vine treatments, and irrigation
schedules along the growing season.
Fig.1. Location of the target vines and distribution in the experimental block.
6
2.3. Field measurements on the target vines during the growing season.
2.3.1. Soil physical and chemical characteristics
At the beginning of the season, soil samples were extracted at a depth of 50 cm, distancing 30 cm from
the target vines at the beginning of the season. The samples were analysed at the Directorate Plant science of
Elsenburg for texture, resistance, macro/micronutrients, exchangeable acidity, particle size and ammonium
(NH4).
2.3.2. Plant water status
Stem water potential (SWP) was measured weekly, from November to the end of February, using a
pressure chamber (PMS Instrument Company, model 1505D, Albany, USA). SWP was measured around
midday (12:00 to 13:00 local time) on every target vine. Mature and healthy leaves were selected from the
middle of the canopy, facing the shaded side of the canopy to avoid overheating. To diminish leaf transpiration
each selected leaf was covered with aluminium foil inside a plastic zip bag at least 1 hour before midday
measurements (Choné et al. 2000).
2.4. Harvest measurements
2.4.1. Physical measurements (Yield components)
All target vines were harvested 1 day before the commercial harvest of the block, with an average 23.8
Brixº for the entire block. All bunches were carefully handpicked. Each target vine was analysed individually
for the following variables: Total vine weight (TVW), bunch counting (BC) and bunch weight (BW).
2.4.2. Standard berry composition
The bunches of each target vine were destemmed, and the berries crushed, separately, for micro-
vinification. A sample of 4 ml of juice was collected after crushing the berries. The juice was immediately
analysed to determine sugar concentration (PAL-1 Digital Pocket Refractometer, Atago, USA), pH and
titratable acidity (TA) (Metrohm, model 702 SM Titrino, Switzerland).
7
2.5. Micro-vinifications
Harvest date was determined by sugar concentration and berry physical evaluation by the farm winemaker.
Each target vine was harvested and kept separately. After physical measurements were complete, bunches were
destemmed and berries were homogenized for each target vine. In order to make fermentation relatable, all
fermentations were scaled to a standardized 2 kg CONSOL jar. The berries were hand crushed and standard
experimental winemaking procedures specified by the Department of Viticulture and Oenology at Stellenbosch
University, were followed. The must was inoculated with Saccharomyces cerevisiae (Lalvin ICV D21,
Lallemand, France) and a blended complex yeast nutrient (Fermaid K Lallemand France) was added. After 10
days of fermentation in a temperature control room at 23ºC, all wines had a minimum residual sugar of 2.5 g/l
and grapes were manually pressed.
2.6. Phenolic analysis in wine
Wine phenolic compounds were calculated using spectrophotometric analysis with a Multiskan GO
Microplate Spectrophotometer (Thermo Fisher Scientific, Inc., Waltham, MA, USA), following the protocol
proposed by (Aleixandre-Tudo et al. 2019). The supernatant was diluted 50 times with HCL 1M, kept in the
dark for 1 hour and analysed with a Multiskan GO Microplate Spectrophotometer. The absorbance was
calculated in the wavelengths of 270 nm, 290nm, 500nm, 520nm, 540nm. The results were uploaded to the
online web-based phenolic analysis platform - Phenolab.co.za - to calculate the content of anthocyanins and
tannins (Aleixandre-Tudo et al. 2017; Aleixandre-Tudo et al. 2019).
2.4.5. Data analysis
Basic descriptive analysis, principal component analysis (PCA) and correlation analysis were applied to
the variables measured during the growing season. PCA supported the search for patterns in the data and the
classification of any combination of variables that could explain the impact of plant water status on the wine
and grape parameters analysed. The correlation analysis was used to evaluate the strength of relationship
between the analysed variables and the final result was presented as a correlation matrix. The non-parametric
Kruskal–Wallis Rank Sum Test was used to determine whether the variables belonging to the water stress
classes were different. Moreover, Pairwise-Wilcox Test was used to determine which classes differed
statistically according to the level of water stress for the analysed grape and wine variables. All data processing,
statistical analyses and graphical results were performed using R software (R Core Team, 2020).
8
3. Results
3.1. Weather conditions and Total water application
In a historical context of 9 seasons, the season 2019-2020 presented maximum values similar to
the historical records, however the minimum temperature was higher than the historical average by 1.36
°C. Considering an equivalent growing season period, the season 2019-2020 registered the lowest
accumulated precipitation (639.05 mm - historical average 888.63 mm). The precipitation was scarce
resulting in a noticeable water deficiency during the grapevine growing season. From budburst to berry
setting the experimental site received 176.5mm of rain. However, between Berry setting and Harvest only
27 mm of precipitation was registered (Table 1). After veraison, almost no precipitation was registered
(only one event of 1.01 mm). According to these conditions, two irrigations were scheduled by the farm
manager.
Table 1. Summary of climatic data of the experimental site per Week during the study period.
W
T
(°C)
Tmax
(°C)
Tmin
(°C)
RH
(%)
Pp
(mm/week)
I
(m3
/ha)
SR
(MJ/m2
/day)
ET0
(mm/week)
VPD
(kPa)
1 18.66(±20.1) 29.53 10.66 65.71(±20.2) 8.12 - 22.03(±21.2) 25.64 0.74
2+
16.01 (±15.4) 25.00 9.72 68.92(±12.6) 0.00 - 26.94(±4.4) 27.38 0.57
3 19.69 (±6.3) 33.36 12.38 65.18(±6.7) 0.00 - 24.75(±20.7) 34.30 0.80
4 20.83(±13.8) 32.86 10.01 51.49(±16.7) 6.59 - 26.72(±11.9) 36.43 1.20
5 20.34(±17.03) 29.48 10.89 68.21(±23.8) 9.13 - 28.63(±6.3) 28.95 0.76
- 17.76(±18.3) 27.24 11.50 69.32(±18.0) 3.15 - 23.45(±25.0) 25.12 0.62
- 17.95(±11.5) 29.97 10.31 66.90(±14.1) 7.11 - 20.93(±38.5) 28.91 0.68
- 21.51(±20.2) 27.45 16.09 57.80(±19.0) 0.00 - 23.36(±37.9) 10.98 1.08
6++
20.11(±8.6) 28.01 15.00 75.17(±14.5) 0.00 - 24.61(±32.0) 22.27 0.59
7 21.37(8.5) 31.40 14.77 69.16(±8.8) 0.00 - 24.87(±18.4) 30.01 0.79
8 24.32(±18.8) 34.33 15.70 60.07(±9.7) 0.00 123.04 24.17(±35.8) 34.70 1.22
9 20.90(±17.2) 28.62 12.44 66.20(±19.2) 1.01 23.14(±23.8) 29.87 0.84
10 22.21(±12.3) 33.45 12.66 62.84(±20.9) 0.00 184.56 25.65(±6.7) 33.53 1.00
11 22.50(±11.0) 33.57 16.02 65.48(±19.8) 0.00 23.73(±17.2) 31.91 0.94
12+++
24.68(±16.0) 34.27 15.08 58.18(±27.3) 0.00 - 23.46(±15.2) 34.43 1.30
W is the Week number from 04/11/2019 to 17/02/2020, numbered weeks indicated the weeks with SWP measurements, no numbered
weeks indicates that SWP was not measured by problems with the weather conditions, +
indicates Setting,++
indicates Veraison,+++
indicates
Harvest, T is the average ambient temperature, Tmin is the minimum ambient temperature, Tmax is the maximum ambient temperature, Pp is
the precipitation, RH is the relative humidity, I is the irrigation amount, SR is the solar radiation, ET0 is the reference evapotranspiration,
VPD is the average vapor pressure deficit. Values in brackets indicate the coefficient of variation expressed in percentage.
9
The plant water status analysis was done during the course of 12 weeks with a gap between the week 5
and 6, because during this period the weather conditions were not suitable for SWP measurements (light rain
and cloudiness at midday). The maximum temperature in January and February was 34.3°C and 37.1°C,
respectively. High values of vapor pressure deficit (VPD) were calculated for the corresponding higher values
of temperature and evapotranspiration (ETo). The highest atmospheric demand was registered at post-veraison,
with a maximum in week 8 (ETo = 34.7 mm/week and VPD = 1.22 kPa) (Table 1).
3.2. Descriptive analysis of grape and oenological variables
The results obtained from the juice and wine analysis are summarized in Table 2. Block scale
represents the value reported by the winemaker at commercial harvest. As was expected the Block value
registered for sugar content, TA and yield was between the minimum and maximum value and close the
average calculated for the 43 target vines.
Table 2. Descriptive analysis of field and wine variables.
Anthocyanins+
(mg/L)
Tannins+
(mg/L)
Sugar content++
(°Bx)
TA++
(g/L)
Yield
(kg/plant)
Block scale - - 25.00 5.43 4.90
Avg 590.8 1119.8 23.87 4.50 5.23
Max 817.8 1911.2 26.53 5.83 9.20
Min 323.6 577.4 19.90 3.87 2.01
CV 19.02 26.28 5.41 10.35 34.34
+ Indicates phenolic compounds measured in wine, ++ Indicates chemical analysis measured in juice, Block scale is the value reported by
the winemaker at commercial harvest, Avg is the average value for the target vines, Max is the maximum value for the target vines, Min is
the minimum value for the target vines, CV is the coefficient of variation (%), TA is the total acidity.
From the target vines, high variability was registered for yield, tannins and anthocyanins with CV values
of 34.34%, 26,28% and 19.02%, respectively (Table 2). The lowest variability was registered for sugar content
(5.41%). Only 3 plants registered a juice sugar content bellow 22° Bx and 7 plants presented values higher than
25° Bx.
Table 3 indicates the values of SWP along the growing season from November to February (12 weeks).
SWP values increase as grapes reached closer to the maturity stage, reaching a maximum water stress period
during Week 11 (post-veraison period). The variability was around 17% with higher values at the beginning of
the season (lower water stress). From week 1 to week 6 the average of SWP varies between 4.85 bar and 7.32
bar, showing low to medium limitation in plant water availability before veraison. A slight decrease in water
10
availability is observed in week 5, after the maximum daily temperatures increased significantly in the previous
weeks. From the initial phase of veraison (week 6) the steady increase in average SWP values (from 7.32 to
10.90 Bar) indicates a decrease in the plant water availability (average reduction of 32.8%). As shown in Figure
2, spatial variability of SWP changed along the season as well as the level of water stress reached by the plants.
Plants with higher values of SWP (more water stress) are spatially concentrated in the central, top central and
top right areas of the block. This distribution is in line with the topographic inclination of the block and the soil
texture analysis.
Table 3. Variation of the SWP per Week during the studied season.
W1 W2 W3 W4 W5 W6 W7 W8 W9 W10 W11 W12 W.d
Avg 4.86 4.12 4.85 5.30 6.50 7.32 8.92 10.23 8.73 10.63 11.43 10.90 7.82
Diff - -0.74 0.73 0.45 1.20 0.82 1.61 1.31 -1.50 1.91 0.79 -0.52 -
Max 6.89 5.99 7.41 6.72 8.90 10.15 11.64 13.78 11.65 13.80 14.10 13.90 9.26
Min 3.05 2.32 2.30 3.66 3.38 5.10 6.80 6.55 6.10 6.27 6.50 6.90 6.18
CV 20.45 20.76 20.07 14.95 20.05 14.85 14.38 18.07 16.10 17.87 14.96 16.76 10.77
W.d is the whole dataset, Avg is the average value for the target vines (Bar), Max is the maximum value for the target vines (Bar), Min is
the minimum value for the target vines (Bar), Diff is the difference between consecutives weeks (Bar), CV is the coefficient of variation
(%), W indicates weeks.
Fig. 2. Temporal and spatial variability of SWP for the target vines from pre-Veraison (Week 3) to
Harvest (Week 12).
11
3.3. PCA and correlation analysis
A PCA analysis was done to explore the effect of the SWP measured during 12 weeks over the 43
target plants on grape and wine parameters (Figure 3). The first 2 dimensions explained 53.9% of the variation
in the data, with 40.3% explained by Dimension 1 and 12.5% explained by Dimension 2. As expected,
anthocyanins and tannins were directly correlated with the Sugar concentrations and indirectly correlated with
yield and acidity. The 12-SWP weekly measurements presented different associations with the phenolic
compounds (anthocyanins and tannins) showing an effect of the time progression. This time effect is evident in
the correlation matrix (Figure 4) where higher correlation values between phenolic compounds and SWP were
registered from week 7 onwards. Also, a positive significant correlation was indicated between phenolic
compounds and sugar concentration. As anticipated, the total acidity and yield had a strong negative correlation
with sugar content and the phenolic compounds.
Fig. 3. PCA analysis considering all the data set from the 2019 growing season for cv. Cabernet Sauvignon.
Nomenclature used: P represent the target plants, W represent SWP for the 12 weeks, Acidity is the total
acidity (TA), Sugar is the grape juice sugar content, Anth is the anthocyanins concentration measured in wine,
Tannins is the tannin concentration measured in wine, Yield is the yield per vine, contrib is the level of
contribution each variable had to the dimensions. Size and colour intensity of the circles indicate the
contribution of the individuals (target plants).
12
Fig. 4. Correlation matrix of the studies variables. W represent SWP for the 12 weeks. Colour and the size of
the circles are proportional to the correlation coefficients between the variables.
3.2. Classification of the target vines according to the plant water status
From the SWP measured values along the season, the target plants were grouped according to the level,
period, and duration of the waters stress in 3 classes: i) Class 1 - low water deficit, ii) Class 2 - moderate water
deficit and iii) Class 3 - severe water deficit (Fig. 5). As benchmarks, the period between week 6 to 8 (veraison)
was used to discriminate the level of stress. The general thresholds indicated for Class 1, 2 and 3 were < 9 Bar,
between 9 to 12 Bar and > 12 Bar, respectively.
Fig. 5. Classification of the seasonal evolution of SWP along the growing season. Yellow area represents the
Veraison period and arrows indicate the irrigation events.
Irrigation Irrigation Irrigation
13
Plants in Class1 have a more homogeneous variation along the season, with a low amplitude of SWP
values from Week 1 to Week 12. On the other side, plants from Class 3 presented a greater amplitude of SWP
during the season. The progression of water deficit in the plants until veraison is similar in all three classes,
however, between week 6 and week 8 (veraison period) the plants in Class 3 rapidly reached the point of severe
water deficit. This trend in Class 3 was only diminished for a week, with the first irrigation event, to return
rapidly to the same level of water deficiency until harvest (Fig. 5). The irrigation events had a lighter effect on
SWP values in Class 1 and Class 2 than in Class 3, where vine water deficit was severely affected.
Table 4. Descriptive analysis water, soil, grape and wine variables in the 3 water stress classes.
SWP
(Bar)*
Sand
(%)**
Clay
(%)**
Carbon
(%)**
Anth
(mg/L)+
Tann
(mg/L)+
SC
(°B)++
TA
(g/L)++
MA
(g/L)++
Yield
(Kg/v)
Class 1
Avg 7.04 24.86 41.00 8.43 523.4 1028.4 23.18 4.55 3.38 5.03
Max 11.80 50.00 46.00 14.00 673.1 1454.3 24.7 5.6 5.4 9.2
Min 2.32 8.00 36.00 6.00 323.6 577.4 19.9 4.1 2.4 8.4
CV 7.63 40.29 8.12 21.18 17.1 26.6 6.0 9.3 27.0 31.4
Class 2
Avg 7.89 40.58 8.32 1.78 583.5 1041.2 23.77 4.56 3.72 5.88
Max 13.90 48.00 12.00 2.30 757.7 1464.2 25.4 5.7 5.3 8.3
Min 2.43 34.00 6.00 1.35 440.5 764.0 22.0 4.0 2.6 3.0
CV 7.45 8.31 23.05 13.78 16.10 21.92 3.67 9.07 21.51 28.17
Class 3
Avg 8.86 39.11 8.89 1.71 711.1 1427.7 25.17 4.29 3.50 3.56
Max 14.10 44.00 12.00 2.03 817.8 1911.2 26.5 5.8 5.1 5.8
Min 2.30 32.00 8.00 1.35 544.3 1049.1 23.7 3.9 2.6 2.0
CV 13.35 9.08 19.84 13.54 12.21 18.46 3.76 14.26 21.75 34.08
*
Indicates field measurements of SWP (Stem Water potential) average value, **
Indicates soil analysis (surrounding soil)
from each target vine, +
Indicates phenolic compounds measured in wine, ++
Indicates chemical analysis measured in juice,
Avg is the average value for the target vines, Max is the maximum value for the target vines, Min is the minimum value for
the target vines, CV is the coefficient of variation (%), TA is the total acidity, MA is the malic acid, SC is the sugar content
in grape juice, Anth is the anthocyanins concentration in wine and Tann is the tannin concentration in wine.
The box plots presented in Fig. 6, gives an indication of the dispersion of the variables inside the water
stress classes and the statistical differences between classes (Wilcoxon Rank Sum test). In general, acidity
presented lower differences, no statistical differences among the classes were registered for malic acid (Fig. 6e)
and a single difference between Class 2 and Class 3 was registered for titratable acidity (Fig. 6b). The analysis
of anthocyanins, tannins, sugar content and yield, presented significant statistical differences for Class 3 in all
cases. For anthocyanins, Class 3 was significantly higher than Class 1 and 2 (Fig. 6a). The positive skew in
Class 3 reveals that 50% of the observations in this group were higher than 711.1 mg/L (Table 4). Likewise,
tannins presented significantly higher values in Class 3 (Fig. 6d). However, Class 3 demonstrates a much
14
smaller 2nd quarter, indicating that 50% of the plants presented value superior to 1427.7 mg/L and a highest
mean value of 1911.2 mg/L (Table 4). The sugar content was similar for Class 1 and 2, however, Class 3 was
significantly higher (Fig. 6c) ranging from 23.7°Brix to 26.5°Brix (Table 4). As expected, the yield of the plants
in Class 3 was significantly lower than the yield in the remaining 2 classes (Figure 6f). In fact, 50% of the plants
in Class 3 had a yield lower than 3.56 kg/plant. Conversely, more than 75% of the plants in Class 1 and 2 had
a yield superior to 4.26 kg/plant.
Figure 6. Boxplots of grape and wine parameters within each water stress class, a) Anthocyanins, b)
Titratable acidity, c) Sugar content, d) Tannins, d) Malic acid, e) Yield per vine. p-values for Kruskal-Wallis
tests indicate a difference in means within a group. Lines with p-values indicate statistically significant (p-
value < 0.05) in the Wilcoxon Rank Sum test for respective pairwise differences in means.
4. Discussion
4.1. Temporal variability of SWP
SWP is a plant based direct measurement variable used to evaluate the amount of water inside the plant
and therefore the plant water requirement (McCutchan & Shackel 2019). In this regard, SWP has been described
as the most convenient way to measure vine water status as it is used as an aid in vineyard irrigation management
15
decisions (Williams 2012; Choné et al. 2001). In our experiment the temporal variability of SWP during the
growing season was evident. Water stress measured by SWP increased along the season, indicating a decrease
of the plant water content as a consequence of high atmospheric demand and lower soil water availability. This
temporal pattern has been reported in several articles (Brillante et al. 2016; Van Leeuwen et al. 2009; Hardie &
Considine 1976).
The atmospheric demand characterized by VPD and ETo increased along the season reaching
maximum values in the post-veraison period where the maximum water stress was also evidenced by SWP
measurements (Table 1 and Table 3). It has been previously reported that SWP, in drip irrigated vineyards, are
more closely correlated to the atmospheric demand (e.g. VPD) than to soil moisture (Rogiers et al. 2012). In
our experiment this condition was clear since SWP was well correlated with the changes in VPD and ETo along
the season. SWP values registered in this study were positively impacted by the irrigation events (lower SWP
values) in the post-Veraison period (Fig. 4). This finding is consistent with other studies that report a clear
impact of irrigation on plant water content (Acevedo-Opazo et al. 2010; Zúñiga et al. 2018; Chaves et al. 2007;
Brillante et al. 2018).
4.2. Spatial intra-block variability of SWP
When viticulture practices are homogeneous to all plants in a block, soil type and topography are the
main responsible factors for the natural spatial variability in vineyards (Yu et al. 2020). As temperature
increased, the relative humidity diminished and the soil became drier, thus plant water status established a clear
spatial pattern in our experimental block (Fig. 2). Therefore, spatial variability of plant water status was noticed
with CV values around 18% (Table 3). Brillante et al. (2016) indicated the existence of big natural spatial
variations in grapevine water status within short distances in vineyards. In the mentioned study plant water
stress of Chardonnay grapevines was monitored by stem/leaf water potential in two plots with different soil
properties. The singularity of water variation in shallow layers was attributed to soil characteristics affecting
soil evaporation, grapevine root density and cover crop uptake. Significant analysis concluded that soil
properties is the main factor for plant water content differences between plants over short distances.
Topography was another important factor to explain the spatial variability. Kitchen et al. (2003) has
established that topography is a measure to study availability of water in the soil. In accordance with this
concept, Van Leeuwen et al. (2004) concluded that the intensity of vine water deficit stress depends on the
16
water-holding capacity of the soil. In our study, plants with higher SWP were more concentrated at the top
central area of the block. The top central area is characterized by a steeper slope than the remaining of the block.
Plants located in areas with steeper inclination registered less water content than the remaining plants. This
result could be associated with a lower penetration of water in slopes due to run-off and soil texture, therefore,
a lower level of available water in the soil. In accordance with these results, Koundouras et al. (2006)
investigated the influence of site (flood plain, hill slope and plateau) on grape and wine composition from
uniformly viticultural conditions of V. Vinifera L.cv. Agiorgitiko vines. Plant water deficit became significantly
higher during grape maturation to grapevines planted on the hill slope plot, suggesting that plant water uptake
is dependent on soil capacity to retain and supply water to grapevines. When combining these two factors soil
water availability is the major factor of spatial variability of plant water status. In this sense, Ledderhof et al.
(2017) in an attempt to assess the relationship between vine water status and yield and berry composition found
that the amount of clay in the soil texture composition is the main driver of variability. This idea is supported
by our classification, where Class 1 presented an average value of clay content 5 times higher than Class 2 and
3.
4.3. Classification based on plant water status
In our experiment the target plants were grouped into 3 classes according to level, period, and duration
of the waters stress using the veraison period as benchmark. Veraison is the beginning of berry ripening and it
is in this stage that berries start a variety of physical and chemical changes. According to several authors
(Gambetta et al. 2020; Ferrandino & Lovisolo 2014) sugar accumulation and abscisic acid (ABA) concentration
are responsible for berry composition modifications during this period. The resultant immediate effect of the
sugar and ABA accumulation in the berry is, first the change of skin colour, and then, the softening of the berry
and resume of berry growth. Other changes during veraison include increase of berry volume, biosynthesis of
skin and pulp compounds, an increase of pH and a decrease of acidity. Since the increase of berry size during
ripening is mainly related to the amount of water accumulated in the mesocarp vacuoles it has been suggested
that water is the most important component for berry maturation. Until veraison the xylem flow is the main
transporter of water to berries, however at veraison phloem flow becomes the only source of water to grape
berries (Keller 2015). Because of the different effects of water deficit on berry development around veraison, it
was hypothesised that veraison is a critical period on the impact of water status on berry development. The
proposed classes categorize target vines under different water conditions according the SWP values registered
during the season (Table 4).
17
Vine water status can be monitored by means of SWP. The level of stress can be classified according
to the water potential measured on leaves. A significant study on the subject was presented by Leeuwen et al.,
(2009). In an investigation into vine water stress impact on the overall vintage quality, average thresholds for
plant water status have been proposed: no water deficit < 6 bar, weak water deficit 6 to 9 bar, moderate to weak
water deficit 9 to 11 bar, moderate to severe water deficit 11 to 14 bar, severe water deficit > 14 bar. In another
major study Gambetta et al. (2020) determined that, in irrigated and non-irrigated vineyards, SWP higher than
15 bar lead to leaf shedding and risk of vine mortality due to cavitation or turgor loss. Furthermore, the SWP in
viticultural management for premium wine is normally targeted between 12 to 14 bar. In our study the proposed
classes were determined considering the level of water stress and the evolution of plant water content from
Veraison onwards. Target plants with a SWP below 9 Bars at veraison were categorized as Class 1. Plants with
a SWP between 9 and 12 were classified as Class 2 and vines with SWP higher that 12 Bar were classified as
Class 3. Additionally, the level of stress of the plants in post-veraison until harvest was also considered.
Acevedo-Opazo et al. (2010) found that in an experiment of cv. Cabernet Sauvignon under three different RDI
events, the most effective irrigation treatment optimizing grape quality was the event that restricted SWP to
values bellow 12 Bar.
Even though before veraison there is no evidence of stressed plants, a steady decrease of plant water
content is already perceptible. Furthermore, target plants rapidly reached a medium level of water stress at
veraison, until achieving the maximum stress four weeks later at harvest. The reason for this rapid water stress
development in the targeted plants is generally related with the immediate increase of temperature, the depletion
of soil moisture and the subsequent plant reaction, opening the stomata and increasing evapotranspiration
(Choné et al. 2001; Phogat et al. 2017).
The temporal and spatial variability is more pronounced between veraison and harvest. However, the
spatial variability in classes can be explained in part by the retention of water in the soil, due to the position of
target plants in the block, the exposition of plants to sun and wind. When target plants are located in a higher
inclination receive more sun exposition and are affected by stronger wind, this translates into the plants
developing a higher stress condition than plants located in a flat area of the block, with low sun exposition and
less wind. These results reflect those of Brillante et al. (2017) who also found that despite vineyards being
irrigated, spatial variability in water content still exists and vineyard irrigation management should be executed
differently for the different SWP classes of the block.
18
Temporal variability in grapevine water content has been well documented (Zúñiga et al. 2018; Chaves
et al. 2007; Acevedo-Opazo, et al. 2010; Brillante et al. 2018). The evolution of plant water content along the
season is a result of soil, weather, and plant management factors. However, the plant water content pattern is
that plants progressively contain less water until harvest (Chaves et al. 2007) and that has a determinant impact
on grape composition (Acevedo-Opazo et al. 2010). The evaluation of plant water content during the period of
water deficit in post-veraison is a complex task. It involves the analysis of changing weather temporal factors
and spatial pedological factors. Our water stress classes were defined following the logic behind the concept of
water stress integral proposed by Myers (1988) where a cumulative evolution of water potential along the water
deficit period is considered.
4.4. Impact of water stress on Yield, grape juice composition and wine phenolics
It has been proved that water stress has an impact in the physiology of the vines. In this sense, irrigation
techniques have been implemented and analysed to modulate vines response under specific water stress
conditions. Among these techniques regulated deficit irrigation (RDI) is the most followed by producers and
researchers.
As a common rule, grape producers apply water deficit in grapes in order to improve grape composition
and concentration. However, water limitation to grapevines at the end of the growing season has different effects
in grape quality depending on application timing. Plant water balance is markedly different before and after
veraison. Before, berries are more sensitive to alterations in plant water content (Gambetta et al. 2020). In this
phase plant water deficit affects the berry capacity of cell division and expansion, and therefore, berry size and
structure. (Bondada & Shutthanandan 2012). After veraison, the cuticular berry transpiration decreases
progressively and the sugar transport and accumulation increase rapidly, and the berry is more resistant to
shrivelling (Gambetta et al. 2020). Acevedo-Opazo et al. (2010) demonstrated that the application of water
restrictions in the period between veraison and harvest has no significant effect on yield. Therefore, grape berry
is less sensitive to plant water deficit in post-Veraison (Kennedy et al. 2002).
Our results follow an opposite tendency. Plants which reported lower levels of water stress (Class 1
and 2) in post-veraison, reported significantly higher yield values (av. 5,46 kg/plant) Conversely, plants from
Class 3 with higher water stress reported a lower yield (3.56 kg/plant). This finding suggests a threshold of plant
water stress that promotes yield component in grapevines. This is a strong indication that plant water content in
19
post-veraison is a determinant factor for yield. Phogat et al. (2017) proposed that yield and average number of
clusters increase with water application. This study has been unable to demonstrate a difference in number of
clusters between the classes. However, the average plants with a critical water deficit in Class 3 registered
clusters with a lower yield (103g/cluster) in comparison to plants in Class 1 and 2 (av. 136g/cluster) with a
moderate water deficit in post-veraison. According to these data, we can infer that plants with a higher water
content in the period of post-veraison result in a higher yield per plant. As noted by Lovisolo et al. (2010) yield
and berry quality depend strongly on vine adaptability to drought. The level of drought recovery in grapevines
is related with the cultivar and environmental conditions affecting plant water stress.
Optimum production of wines is dependent on the grape composition at harvest. As a standard in
wineries, measurement of grape quality parameters is done by means of visual and sensorial evaluation of the
grapes and the analysis of total soluble solids (TSS) and acidity (Guidetti 2010). High sugar, lower acid, rich
colour and full varietal fruitiness are criteria for harvesting the ripe fruit at desirable ripeness (Boulton et al.,
1999). However, depending on the style and level of quality intended to be achieved there are several potential
harvest dates.
To date there has been little agreement about the effects of water deficit in berry juice quality
parameters (pH, TA and sugar content). Some authors suggest that plant water status derived from deficit
irrigation has a substantial impact on soluble solids of grape composition (Yu et al. 2020; Esteban et al. 2001).
Other have found no evidence of significant water deficit irrigation effect on grape soluble solids composition
of pH, TA (Acevedo-Opazo et al. 2010) and sugar accumulation (Chaves et al. 2007). In our study the values
of berry juice quality parameters analysed at harvest demonstrated no significant differences between classes
for pH, however, a small decrease of TA was registered in Class 3. Van Leeuwen et al. (2009) argues that mild
conditions of water deficit are beneficial to grape quality, decreasing malic acid and increasing sugar,
anthocyanins, and tannins of grape content. In our study the sugar content at harvest was well correlated with
the level of plant water stress. Grape berry sugar content increases with the level of stress between classes. This
augment in sugar can be related to the decrease of water content in the berry, therefore berry size, which leads
to the increase of sugar concentration in the berry. The chemical composition of grape juice and wine correlation
analysis illustrated a strong positive relationship (+0.9) between anthocyanins, tannins, and sugar. The analysis
demonstrated that anthocyanins and tannins in wine were highly correlated with the sugar concentrations
indicating that sugar may be useful as an indicator of wine phenolic content. The impact of water deficit in the
20
increase of Brix° has been reported by Roby et al., (2004). Brix° values were higher for water stressed plants in
Class 3, but this was already expected since sugar is a component of Brix°.
4.5. Wine phenolics
The phenolic content and composition of red grapes are the main attributes to wine sensory properties
and wine colour. Anthocyanins are phenolic compounds that impart red colour to wine and tannins contribute
to the mouth feel properties (Aleixandre-Tudo et al. 2018). Although extensive research has been carried out
on flavonoid composition of wines, few studies have investigated the relationship between plant water deficit
and flavonoid composition of wines. A study conducted by Downey et al. (2006) suggests that plant water status
is a common denominator for flavonoids in wine. In our study a positive relationship was noticed between the
increase of water stress in plants of Class 3 and the increase of anthocyanins content of fermented wines.
Even though some authors argue that wine tannin concentrations can only be altered with higher values
of water deficits (Yu et al. 2020), our experiment demonstrated that plant water deficit is a strong driver for
tannin concentration in fermented wines and for anthocyanin concentration in wines. The experiment shows
that tannin and anthocyanin concentration 27% and 23%, respectively between low water deficit Class 1 and 2
and high-water deficit in Class 3. This finding was also reported by Kennedy et al., (2002) who reported an
increase of tannin concentration in response to water deficit. In our study, total phenols content in wine was
24% lower in Class 1. A similar result was presented by Nadal & Arola (1995) who reported a decrease of 22%
of total phenols in wines produced from irrigated vines.
Proanthocyanidins (tannins) are synthesised before anthesis through veraison and anthocyanin and
sugar accumulation, begins at veraison until harvest (Ollé et al. 2011). In our experiment the values of tannins,
anthocyanins and sugar (brix°) are higher in wines from Class 3, suggesting that temperature had a high
influence on the synthesis of these compounds during grape development. This observation may support the
hypothesis that the average temperatures in pre- and post-veraison periods were very high, mainly affecting the
plants with lower soil water content located in the steepest areas of the bock. This suggest that plant water
deficit in this period induces the accumulation of B-ring trihydroxylated anthocyanins through the differential
regulation of flavonoid 3’-hydroxylase and flavonoid 3’,5’-hydroxylase (Castellarin et al. 2007). Here the
influence of low water status before veraison impacts nonacylated anthocyanins (cyanidin and peonidin),
whereas in post-veraison it mainly affects cyanidin derivatives (p-coumaroyl substitutions) (Ollé et al. 2011).
21
There is still uncertainty, however, whether plant water deficit has an impact on the increase wine
phenolic concentration because of alterations occurring through grape biosynthesis or due to the enhanced
concentration. It is also uncertain how this change will influence phenolic extraction during fermentation
(Casassa et al. 2015). Ojeda et al. (2002) confirmed two types of berry responses to water deficit: an indirect
and always positive effect on the concentration of phenolic compounds due to berry size reduction, and a direct
action on biosynthesis that can be positive or negative, depending on the type of phenolic compound, period of
application, and severity of the water deficit (Kennedy et al. 2002; Ojeda et al. 2002). Other than a direct
stimulation of biosynthesis, water deficits could also increase the concentrations of skin tannins and
anthocyanins due to the differential growth responses of the skin and inner mesocarp tissue to water deficits,
resulting in greater skin mass and relative skin mass per berry, and therefore greater amounts of skin-localised
solutes (Roby et al. 2004). Further studies, which take these variables into account, will need to be undertaken.
5. Conclusion
The present study highlights the complex response of wine phenolic content (anthocyanins and
tannins) and grape parameters (sugar content, TA, MA and yield) to the temporal and spatial variability of plant
water status in a commercial block induced by natural conditions of topography and soil characteristics.
In this study all target plants were treated with the same viticultural management practices and only
the natural effects were accountable to the spatial variability. Plant water status variability occurred along the
season, suggesting soil texture and topography as key factors for this effect. Plant water status influenced
changes in the concentration of phenolic compounds (anthocyanins and tannins) and grape parameters
particularly yield, and sugar content.
The results of this study may help to understand and quantify how spatial variability is naturally
distributed in a vineyard and ultimately impacts the style of wine that is possible to produce from a section or
the whole block. Further studies at intra-block scale are needed to understand the implications of plant water
status in the phenolic composition of wines focusing on the specific compounds that can play an important role
in the wine quality as well as the drivers associated with the variability.
References
Acevedo-Opazo, C., Ortega-Farias, S., et al., 2010. Effects of grapevine (Vitis vinifera L.) water status on water
consumption, vegetative growth and grape quality: An irrigation scheduling application to achieve
regulated deficit irrigation Agric. Water Manag. 97, 7, 956–964.
22
Acevedo-Opazo, C., Tisseyre, B., et al., 2010. Spatial extrapolation of the vine (Vitis vinifera L.) water status:
A first step towards a spatial prediction model Irrig. Sci. 28, 2, 143–155.
Adams, D.O., 2006. Phenolics and ripening in grape berries Am. J. Enol. Vitic. 57, 3, 249–256.
Aleixandre-Tudo, J.L., Buica, A., et al., 2017. Spectrophotometric Analysis of Phenolic Compounds in Grapes
and Wines J. Agric. Food Chem. 65, 20, 4009–4026.
Aleixandre-Tudo, J.L., Nieuwoudt, H., et al., 2019. Towards on-line monitoring of phenolic content in red wine
grapes: A feasibility study Food Chem. 270, July 2018, 322–331.
Arnó, J., Martínez Casasnovas, J.A., et al., 2009. Review. Precision viticulture. Research topics, challenges and
opportunities in site-specific vineyard management Spanish J. Agric. Res. 7, 4, 779.
Bindon, K., Myburgh, P., et al., 2011. Response of Grape and Wine Phenolic Composition in Vitis vinifera L .
cv . Merlot to Variation in Grapevine Water Status 32, 1, 71–88.
Blancquaert, E.H., Oberholster, A., et al., 2019. Effects of abiotic factors on phenolic compounds in the grape
berry - A review South African J. Enol. Vitic. 40, 1.
Bondada, B. & Shutthanandan, J., 2012. Understanding Differential Responses of Grapevine (Vitis vinifera L.)
Leaf and Fruit to Water Stress and Recovery Following Re-Watering Am. J. Plant Sci. 03, 09, 1232–
1240.
Boulton, R.B., Singleton, V.L., et al., 1999. Principles and Practices of Winemaking. Vol. 97.
Braidot, E., Zancani, M., et al., 2008. Transport and accumulation of flavonoids in grapevine (Vitis vinifera L.)
Plant Signal. Behav. 2324, 9.
Brillante, L., Bois, B., et al., 2016. Variations in soil-water use by grapevine according to plant water status and
soil physical-chemical characteristics-A 3D spatio-temporal analysis Eur. J. Agron. 77, 122–135.
Brillante, L., Martínez-Luscher, J., et al., 2017. Assessing Spatial Variability of Grape Skin Flavonoids at the
Vineyard Scale Based on Plant Water Status Mapping J. Agric. Food Chem. 65, 26, 5255–5265.
Brillante, L., Martínez-Lüscher, J., et al., 2018. Applied water and mechanical canopy management affect berry
and wine phenolic and aroma composition of grapevine (Vitis vinifera L., cv. Syrah) in Central
California Sci. Hortic. (Amsterdam). 227, June 2017, 261–271.
Casassa, L.F., Keller, M., et al., 2015. Regulated deficit irrigation alters anthocyanins, tannins and sensory
properties of Cabernet Sauvignon grapes and wines Molecules 20, 5, 7820–7844.
Castellarin, S.D., Matthews, M.A., et al., 2007. Water deficits accelerate ripening and induce changes in gene
expression regulating flavonoid biosynthesis in grape berries Planta 227, 1, 101–112.
Chaves, M.M., Santos, T.P., et al., 2007. Deficit irrigation in grapevine improves water-use efficiency while
controlling vigour and production quality Ann. Appl. Biol. 150, 2, 237–252.
Choné, X., Van Leeuwen, C., et al., 2001. Stem water potential is a sensitive indicator of grapevine water status
Ann. Bot. 87, 4, 477–483.
Cliff, M.A., King, M.C., et al., 2007. Anthocyanin, phenolic composition, colour measurement and sensory
analysis of BC commercial red wines Food Res. Int. 40, 1, 92–100.
Deloire, A., Carbonneau, A., et al., 2004. Vine and water a short review In: J. Int. des Sci. la Vigne du Vin. Vol.
38 1–13.
Downey, M.O., Dokoozlian, N.K., et al., 2006. Cultural Practice and Environmental Impacts on the Flavonoid
Composition of Grapes and Wine: A Review of Recent Research Am. J. Enol. Vitic. 3, 257–268.
Esteban, M.A., Villanueva, M.J., et al., 2001. Effect of irrigation on changes in the anthocyanin composition of
the skin of cv Tempranillo (Vitis vinifera L) grape berries during ripening J. Sci. Food Agric. 81, 4,
409–420.
Ferrandino, A. & Lovisolo, C., 2014. Abiotic stress effects on grapevine (Vitis vinifera L.): Focus on abscisic
acid-mediated consequences on secondary metabolism and berry quality Environ. Exp. Bot. 103, 138–
147.
Gambetta, G.A., Herrera, J.C., et al., 2020. The physiology of drought stress in grapevine: towards an integrative
definition of drought tolerance J. Exp. Bot. 71, 16, 4658–4676.
Gaudillère JP, van Leeuwen C, T.O., 2000. The assessment of vine water uptake conditions by 13c/12c
discrimination in grape sugar J. Int. des Sci. la Vigne du Vin 34, 4, 169–176.
Guidoni, S., Ferrandino, A., et al., 2008. Effects of seasonal and agronomical practices on skin anthocyanin
profile of Nebbiolo grapes Am. J. Enol. Vitic. 59, 1, 22–29.
Hardie, W.J. & Considine, J. a, 1976. Response of Grapes To Water-Deficit Stress in Particular Stages of
Development Am. J. Enol. Vitic. 27, 2, 55–61.
Jose Luis Aleixandre-Tudo, 2018. Understanding phenolic compounds in red winemaking. Stellenbosch
university.
Keller, M., 2015. The Science of Grapevines: Anatomy and Physiology: Second Edition. Vol. 1.
Kennedy, J.A., Matthews, M.A., et al., 2002. Effect of maturity and vine water status on grape skin and wine
flavonoids Am. J. Enol. Vitic. 53, 4, 268–274.
Kennedy, J.A., Saucier, C., et al., 2006. Grape and wine phenolics: History and perspective Am. J. Enol. Vitic.
57, 3, 239–248.
23
King, W.B., 1983. Geomorphology of the cape peninsula University of Cape Town.
Kitchen, N.R., Drummond, S.T., et al., 2003. Soil electrical conductivity and topography related to yield for
three contrasting soil-crop systems Agron. J. 95, 3, 483–495.
Kontoudakis, N., Esteruelas, M., et al., 2010. Influence of the heterogeneity of grape phenolic maturity on wine
composition and quality Elsevier 124, 767–774.
Koundouras, S., Marinos, V., et al., 2006. Influence of vineyard location and vine water status on fruit
maturation of nonirrigated cv. Agiorgitiko (Vitis vinifera L.). Effects on wine phenolic and aroma
components J. Agric. Food Chem. 54, 14, 5077–5086.
Ledderhof, D., Reynolds, A.G., et al., 2017. Spatial variability in Ontario pinot noir vineyards: Use of geomatics
and implications for precision viticulture Am. J. Enol. Vitic. 68, 2, 151–168.
Van Leeuwen, C., Friant, P., et al., 2004. Influence of climate, soil, and cultivar on terroir Am. J. Enol. Vitic.
55, 3, 207–217.
Leeuwen, C. Van, Tregoat, O., et al., 2009. Vine water status is a key factor in grape ripening and vintage
quality for red Bordeaux wine. How can it be assessed for vineyard management purposes? J. Int. des
Sci. la Vigne du Vin 43, 3, 121–134.
Lovisolo, C., Perrone, I., et al., 2010. Drought-induced changes in development and function of grapevine (Vitis
spp.) organs and in their hydraulic and non-hydraulic interactions at the whole-plant level: A
physiological and molecular update Funct. Plant Biol. 37, 2, 98–116.
McCutchan, H. & Shackel, K.A., 2019. Stem-water Potential as a Sensitive Indicator of Water Stress in Prune
Trees (Prunus domestica L. cv. French) J. Am. Soc. Hortic. Sci. 117, 4, 607–611.
Monagas, M., Gómez-Cordovés, C., et al., 2006. Evolution of the phenolic content of red wines from Vitis
vinifera L. during ageing in bottle Food Chem. 95, 3, 405–412.
Morgenthal, A., 2004. The wine lands of South Africa - In-depth information & detailed topographical maps.
(3rd ed.). Wines of South Africa.
Nadal, M. & Arola, L., 1995. Effects of limited irrigation on the composition of must and wine of Cabernet
Sauvignon under semi-arid conditions Vitis 34, 3, 151–154.
Nel, A.P., 2018. Tannins and anthocyanins: From their origin to wine analysis - A review South African J. Enol.
Vitic. 39, 1, 1–20.
Ojeda, H., Andary, C., et al., 2002. Influence of pre- and postveraison water deficit on synthesis and
concentration of skin phenolic compounds during berry growth of Vitis vinifera cv. Shiraz Am. J.
Enol. Vitic. 53, 4, 261–267.
Ollé, D., Guiraud, J.L., et al., 2011. Effect of pre- and post-veraison water deficit on proanthocyanidin and
anthocyanin accumulation during Shiraz berry development Aust. J. Grape Wine Res. 17, 1, 90–100.
Peel, M.C., Finlayson, B.L., et al., 2007. Updated world map of the Köppen-Geiger climate classification
Hydrol. Earth Syst. Sci. 11, 5, 1633–1644.
Phogat, V., Skewes, M.A., et al., 2017. Evaluation of crop coefficients, water productivity, and water balance
components for wine grapes irrigated at different deficit levels by a sub-surface drip Agric. Water
Manag. 180, 22–34.
R. Guidetti, R. Beghi, L.B., 2010. Evaluation of grape quality parameters by a simple vis/nir system Trans.
ASABE 53, 2, 477–484.
Roby, G., Harbertson, J.F., et al., 2004. Berry size and vine water deficits as factors in winegrape composition:
Anthocyanins and tannins Aust. J. Grape Wine Res. 10, 2, 100–107.
Rogiers, S.Y., Greer, D.H., et al., 2012. Stomatal response of an anisohydric grapevine cultivar to evaporative
demand, available soil moisture and abscisic acid Tree Physiol. 32, 3, 249–261.
Santesteban, L.G., 2019. Precision viticulture and advanced analytics. A short review Food Chem. 279, April
2018, 58–62.
SAWIS, 2014. Production areas defined in terms of the wine of origin scheme 1–4.
Teixeira, A., Eiras-Dias, J., et al., 2013. Berry phenolics of grapevine under challenging environments Int. J.
Mol. Sci. 14, 9, 18711–18739.
Vilanova, M., Santalla, M., et al., 2009. Environmental and genetic variation of phenolic compounds in grapes
(vitis vinifera) from northwest Spain J. Agric. Sci. 147, 6, 683–697.
Williams, L.E., 2012. Leaf water potentials of sunlit and/or shaded grapevine leaves are sensitive alternatives
to stem water potential J. Int. des Sci. la Vigne du Vin 46, 3, 207–219.
Yu, R., Brillante, L., et al., 2020. Spatial Variability of Soil and Plant Water Status and Their Cascading Effects
on Grapevine Physiology Are Linked to Berry and Wine Chemistry Front. Plant Sci. 11, June.
Zhao, J., Zhang, W., et al., 2010. Improved K-Means cluster algorithm in telecommunications enterprises
customer segmentation Proc. 2010 IEEE Int. Conf. Inf. Theory Inf. Secur. ICITIS 2010 167–169.
Zúñiga, M., Ortega-Farías, S., et al., 2018. Effects of three irrigation strategies on gas exchange relationships,
plant water status, yield components and water productivity on grafted carménère grapevines Front.
Plant Sci. 9, July 1–13.
24
Myers BJ 1988 ´Water stress integral. A link between short-term stress and long-term growth. Tree Physiol 4:
315–323.
R Core Team (2020). R: A language and environment for statistical computing. R Foundation for Statistical
Computing, Vienna, Austria. URL http://www.R-project.org/
Rouse, J.W., Jr.; Haas, R.H.; Schell, J.A.; Deering, D.W. (1974). Monitoring Vegetation Systems in the Great
Plains with ERTS. NASA Spec. Publ. 351, 309–317.

More Related Content

Similar to Agwat d-20-00151 reviewer

2017 Oregon Wine Symposium | The Myth of Terroir and Understanding Your Site:...
2017 Oregon Wine Symposium | The Myth of Terroir and Understanding Your Site:...2017 Oregon Wine Symposium | The Myth of Terroir and Understanding Your Site:...
2017 Oregon Wine Symposium | The Myth of Terroir and Understanding Your Site:...Oregon Wine Board
 
Evalution the changes of some biomolecules of two grapevine cultivars against...
Evalution the changes of some biomolecules of two grapevine cultivars against...Evalution the changes of some biomolecules of two grapevine cultivars against...
Evalution the changes of some biomolecules of two grapevine cultivars against...Innspub Net
 
Family Winemakers 2010a Sti R Wample
Family Winemakers 2010a Sti R WampleFamily Winemakers 2010a Sti R Wample
Family Winemakers 2010a Sti R Wampledigitalgear
 
Understanding Water Quality Dynamics in Aquaculture Ponds in Sunyani, Ghana: ...
Understanding Water Quality Dynamics in Aquaculture Ponds in Sunyani, Ghana: ...Understanding Water Quality Dynamics in Aquaculture Ponds in Sunyani, Ghana: ...
Understanding Water Quality Dynamics in Aquaculture Ponds in Sunyani, Ghana: ...Premier Publishers
 
Analysis of Physicochemical and Microbiological Parameters of Wine Produced f...
Analysis of Physicochemical and Microbiological Parameters of Wine Produced f...Analysis of Physicochemical and Microbiological Parameters of Wine Produced f...
Analysis of Physicochemical and Microbiological Parameters of Wine Produced f...IIJSRJournal
 
Quantifying the relative impact of physical and human factors on the viticult...
Quantifying the relative impact of physical and human factors on the viticult...Quantifying the relative impact of physical and human factors on the viticult...
Quantifying the relative impact of physical and human factors on the viticult...Agriculture Journal IJOEAR
 
EFFECT OF BIOFERTILIZAÇÃO ON YELLOW PASSION FRUIT PRODUCTION AND FRUIT QUALITY
EFFECT OF BIOFERTILIZAÇÃO ON YELLOW PASSION FRUIT PRODUCTION AND FRUIT QUALITYEFFECT OF BIOFERTILIZAÇÃO ON YELLOW PASSION FRUIT PRODUCTION AND FRUIT QUALITY
EFFECT OF BIOFERTILIZAÇÃO ON YELLOW PASSION FRUIT PRODUCTION AND FRUIT QUALITYAna Aguiar
 
Autochthonous yeasts: Role in vinification and aging of Cabernet-Sauvignon
Autochthonous yeasts: Role in vinification and aging of Cabernet-SauvignonAutochthonous yeasts: Role in vinification and aging of Cabernet-Sauvignon
Autochthonous yeasts: Role in vinification and aging of Cabernet-SauvignonAgriculture Journal IJOEAR
 
Enhancing Productivity and Livelihoods among Smallholders Irrigations through...
Enhancing Productivity and Livelihoods among Smallholders Irrigations through...Enhancing Productivity and Livelihoods among Smallholders Irrigations through...
Enhancing Productivity and Livelihoods among Smallholders Irrigations through...Jenkins Macedo
 
Spatiotemporal assessment of the quality of surface water the most polluted i...
Spatiotemporal assessment of the quality of surface water the most polluted i...Spatiotemporal assessment of the quality of surface water the most polluted i...
Spatiotemporal assessment of the quality of surface water the most polluted i...Innspub Net
 
Consistent Relationship of Both Watercontent and Activity With Maize Seed Qua...
Consistent Relationship of Both Watercontent and Activity With Maize Seed Qua...Consistent Relationship of Both Watercontent and Activity With Maize Seed Qua...
Consistent Relationship of Both Watercontent and Activity With Maize Seed Qua...bioejjournal
 
Climate change and mitigation strategy for fruit production
Climate change and mitigation strategy for fruit productionClimate change and mitigation strategy for fruit production
Climate change and mitigation strategy for fruit productionpriyankakatara2
 
BiotechnologicaApproaches to Improve Nutritional Quality and Shelf life of fr...
BiotechnologicaApproaches to Improve Nutritional Quality and Shelf life of fr...BiotechnologicaApproaches to Improve Nutritional Quality and Shelf life of fr...
BiotechnologicaApproaches to Improve Nutritional Quality and Shelf life of fr...anilasajjad
 
Efficacy of hibiscus cannabinus l. (kenaf) crude seed powder
Efficacy of hibiscus cannabinus l. (kenaf) crude seed powderEfficacy of hibiscus cannabinus l. (kenaf) crude seed powder
Efficacy of hibiscus cannabinus l. (kenaf) crude seed powderAlexander Decker
 
Effectiveness of various salinity on leaf growth of Gazania | IJAAR
Effectiveness of various salinity on leaf growth of Gazania | IJAAREffectiveness of various salinity on leaf growth of Gazania | IJAAR
Effectiveness of various salinity on leaf growth of Gazania | IJAARInnspub Net
 
Med partnership bouareg_rev
Med partnership bouareg_revMed partnership bouareg_rev
Med partnership bouareg_revgroundwatercop
 

Similar to Agwat d-20-00151 reviewer (20)

2017 Oregon Wine Symposium | The Myth of Terroir and Understanding Your Site:...
2017 Oregon Wine Symposium | The Myth of Terroir and Understanding Your Site:...2017 Oregon Wine Symposium | The Myth of Terroir and Understanding Your Site:...
2017 Oregon Wine Symposium | The Myth of Terroir and Understanding Your Site:...
 
Mr
MrMr
Mr
 
Evalution the changes of some biomolecules of two grapevine cultivars against...
Evalution the changes of some biomolecules of two grapevine cultivars against...Evalution the changes of some biomolecules of two grapevine cultivars against...
Evalution the changes of some biomolecules of two grapevine cultivars against...
 
Family Winemakers 2010a Sti R Wample
Family Winemakers 2010a Sti R WampleFamily Winemakers 2010a Sti R Wample
Family Winemakers 2010a Sti R Wample
 
Understanding Water Quality Dynamics in Aquaculture Ponds in Sunyani, Ghana: ...
Understanding Water Quality Dynamics in Aquaculture Ponds in Sunyani, Ghana: ...Understanding Water Quality Dynamics in Aquaculture Ponds in Sunyani, Ghana: ...
Understanding Water Quality Dynamics in Aquaculture Ponds in Sunyani, Ghana: ...
 
Analysis of Physicochemical and Microbiological Parameters of Wine Produced f...
Analysis of Physicochemical and Microbiological Parameters of Wine Produced f...Analysis of Physicochemical and Microbiological Parameters of Wine Produced f...
Analysis of Physicochemical and Microbiological Parameters of Wine Produced f...
 
"Vineyard and climate change" by Gregory Jones
"Vineyard and climate change" by Gregory Jones"Vineyard and climate change" by Gregory Jones
"Vineyard and climate change" by Gregory Jones
 
Quantifying the relative impact of physical and human factors on the viticult...
Quantifying the relative impact of physical and human factors on the viticult...Quantifying the relative impact of physical and human factors on the viticult...
Quantifying the relative impact of physical and human factors on the viticult...
 
EFFECT OF BIOFERTILIZAÇÃO ON YELLOW PASSION FRUIT PRODUCTION AND FRUIT QUALITY
EFFECT OF BIOFERTILIZAÇÃO ON YELLOW PASSION FRUIT PRODUCTION AND FRUIT QUALITYEFFECT OF BIOFERTILIZAÇÃO ON YELLOW PASSION FRUIT PRODUCTION AND FRUIT QUALITY
EFFECT OF BIOFERTILIZAÇÃO ON YELLOW PASSION FRUIT PRODUCTION AND FRUIT QUALITY
 
Autochthonous yeasts: Role in vinification and aging of Cabernet-Sauvignon
Autochthonous yeasts: Role in vinification and aging of Cabernet-SauvignonAutochthonous yeasts: Role in vinification and aging of Cabernet-Sauvignon
Autochthonous yeasts: Role in vinification and aging of Cabernet-Sauvignon
 
Enhancing Productivity and Livelihoods among Smallholders Irrigations through...
Enhancing Productivity and Livelihoods among Smallholders Irrigations through...Enhancing Productivity and Livelihoods among Smallholders Irrigations through...
Enhancing Productivity and Livelihoods among Smallholders Irrigations through...
 
Spatiotemporal assessment of the quality of surface water the most polluted i...
Spatiotemporal assessment of the quality of surface water the most polluted i...Spatiotemporal assessment of the quality of surface water the most polluted i...
Spatiotemporal assessment of the quality of surface water the most polluted i...
 
Consistent Relationship of Both Watercontent and Activity With Maize Seed Qua...
Consistent Relationship of Both Watercontent and Activity With Maize Seed Qua...Consistent Relationship of Both Watercontent and Activity With Maize Seed Qua...
Consistent Relationship of Both Watercontent and Activity With Maize Seed Qua...
 
Climate change and mitigation strategy for fruit production
Climate change and mitigation strategy for fruit productionClimate change and mitigation strategy for fruit production
Climate change and mitigation strategy for fruit production
 
55044 311170-2-pb
55044 311170-2-pb55044 311170-2-pb
55044 311170-2-pb
 
BiotechnologicaApproaches to Improve Nutritional Quality and Shelf life of fr...
BiotechnologicaApproaches to Improve Nutritional Quality and Shelf life of fr...BiotechnologicaApproaches to Improve Nutritional Quality and Shelf life of fr...
BiotechnologicaApproaches to Improve Nutritional Quality and Shelf life of fr...
 
Efficacy of hibiscus cannabinus l. (kenaf) crude seed powder
Efficacy of hibiscus cannabinus l. (kenaf) crude seed powderEfficacy of hibiscus cannabinus l. (kenaf) crude seed powder
Efficacy of hibiscus cannabinus l. (kenaf) crude seed powder
 
Effectiveness of various salinity on leaf growth of Gazania | IJAAR
Effectiveness of various salinity on leaf growth of Gazania | IJAAREffectiveness of various salinity on leaf growth of Gazania | IJAAR
Effectiveness of various salinity on leaf growth of Gazania | IJAAR
 
UAV-IQ: Due Diligence Primer
UAV-IQ: Due Diligence PrimerUAV-IQ: Due Diligence Primer
UAV-IQ: Due Diligence Primer
 
Med partnership bouareg_rev
Med partnership bouareg_revMed partnership bouareg_rev
Med partnership bouareg_rev
 

More from Mahbubul Hassan

#1 guidelines for expression of stable isotope ratio results
#1 guidelines for expression of stable isotope ratio results#1 guidelines for expression of stable isotope ratio results
#1 guidelines for expression of stable isotope ratio resultsMahbubul Hassan
 
#1 irms guide finalv3.1 web +++++
#1 irms guide finalv3.1 web +++++#1 irms guide finalv3.1 web +++++
#1 irms guide finalv3.1 web +++++Mahbubul Hassan
 
#1 isotope guidelines coplen 2011
#1 isotope guidelines   coplen 2011#1 isotope guidelines   coplen 2011
#1 isotope guidelines coplen 2011Mahbubul Hassan
 
#1 stable isotope deltas tiny yet robust signatures in nature
#1 stable isotope deltas tiny yet robust signatures in nature#1 stable isotope deltas tiny yet robust signatures in nature
#1 stable isotope deltas tiny yet robust signatures in natureMahbubul Hassan
 
#2 determination of o 18 of water and c-13 of dic using simple modification o...
#2 determination of o 18 of water and c-13 of dic using simple modification o...#2 determination of o 18 of water and c-13 of dic using simple modification o...
#2 determination of o 18 of water and c-13 of dic using simple modification o...Mahbubul Hassan
 
13 c analyses of calcium carbonate comparison between gb and ea
13 c analyses of calcium carbonate comparison between gb and ea13 c analyses of calcium carbonate comparison between gb and ea
13 c analyses of calcium carbonate comparison between gb and eaMahbubul Hassan
 
13 doc analysis technique - isotope tracer tech inc
13 doc analysis technique - isotope tracer tech inc13 doc analysis technique - isotope tracer tech inc
13 doc analysis technique - isotope tracer tech incMahbubul Hassan
 
2016 new organic reference materials for h, c, n measurements supporting in...
2016 new organic reference materials for h, c, n measurements   supporting in...2016 new organic reference materials for h, c, n measurements   supporting in...
2016 new organic reference materials for h, c, n measurements supporting in...Mahbubul Hassan
 
Absolute isotopic scale for deuterium analysis of natural waters
Absolute isotopic scale for deuterium analysis of natural watersAbsolute isotopic scale for deuterium analysis of natural waters
Absolute isotopic scale for deuterium analysis of natural watersMahbubul Hassan
 
Acid fumigation preparing c-13 solid samples for organic analysis
Acid fumigation   preparing c-13 solid samples for organic analysisAcid fumigation   preparing c-13 solid samples for organic analysis
Acid fumigation preparing c-13 solid samples for organic analysisMahbubul Hassan
 
Acid fumigation of soils to remove co3 prior to c 13 isotopic analysis
Acid fumigation of soils to remove co3 prior to c 13 isotopic analysisAcid fumigation of soils to remove co3 prior to c 13 isotopic analysis
Acid fumigation of soils to remove co3 prior to c 13 isotopic analysisMahbubul Hassan
 
Carbonate removal by acid fumigation for measuring 13 c
Carbonate removal by acid fumigation for measuring 13 cCarbonate removal by acid fumigation for measuring 13 c
Carbonate removal by acid fumigation for measuring 13 cMahbubul Hassan
 
Carbonate removal from coastal sediments for the determination of organic c a...
Carbonate removal from coastal sediments for the determination of organic c a...Carbonate removal from coastal sediments for the determination of organic c a...
Carbonate removal from coastal sediments for the determination of organic c a...Mahbubul Hassan
 
Forensic application of irms
Forensic application of irmsForensic application of irms
Forensic application of irmsMahbubul Hassan
 
Improved method for analysis of dic in natural water samples
Improved method for analysis of dic in natural water samplesImproved method for analysis of dic in natural water samples
Improved method for analysis of dic in natural water samplesMahbubul Hassan
 
Introduction to isotopic calculation
Introduction to isotopic calculationIntroduction to isotopic calculation
Introduction to isotopic calculationMahbubul Hassan
 
Isotope ratio mass spectrometry minireview
Isotope ratio mass spectrometry   minireviewIsotope ratio mass spectrometry   minireview
Isotope ratio mass spectrometry minireviewMahbubul Hassan
 
Measurement of slap2 and gisp 17 o and proposed vsmow slap normalization
Measurement of slap2 and gisp 17 o and proposed vsmow slap normalizationMeasurement of slap2 and gisp 17 o and proposed vsmow slap normalization
Measurement of slap2 and gisp 17 o and proposed vsmow slap normalizationMahbubul Hassan
 
Method of sampling and analysis of 13 c dic in groundwaters
Method of sampling and analysis of 13 c dic in groundwatersMethod of sampling and analysis of 13 c dic in groundwaters
Method of sampling and analysis of 13 c dic in groundwatersMahbubul Hassan
 

More from Mahbubul Hassan (20)

#1 guidelines for expression of stable isotope ratio results
#1 guidelines for expression of stable isotope ratio results#1 guidelines for expression of stable isotope ratio results
#1 guidelines for expression of stable isotope ratio results
 
#1 irms guide finalv3.1 web +++++
#1 irms guide finalv3.1 web +++++#1 irms guide finalv3.1 web +++++
#1 irms guide finalv3.1 web +++++
 
#1 isotope guidelines coplen 2011
#1 isotope guidelines   coplen 2011#1 isotope guidelines   coplen 2011
#1 isotope guidelines coplen 2011
 
#1 stable isotope deltas tiny yet robust signatures in nature
#1 stable isotope deltas tiny yet robust signatures in nature#1 stable isotope deltas tiny yet robust signatures in nature
#1 stable isotope deltas tiny yet robust signatures in nature
 
#2 determination of o 18 of water and c-13 of dic using simple modification o...
#2 determination of o 18 of water and c-13 of dic using simple modification o...#2 determination of o 18 of water and c-13 of dic using simple modification o...
#2 determination of o 18 of water and c-13 of dic using simple modification o...
 
13 c analyses of calcium carbonate comparison between gb and ea
13 c analyses of calcium carbonate comparison between gb and ea13 c analyses of calcium carbonate comparison between gb and ea
13 c analyses of calcium carbonate comparison between gb and ea
 
13 doc analysis technique - isotope tracer tech inc
13 doc analysis technique - isotope tracer tech inc13 doc analysis technique - isotope tracer tech inc
13 doc analysis technique - isotope tracer tech inc
 
2013 sk~1
2013 sk~12013 sk~1
2013 sk~1
 
2016 new organic reference materials for h, c, n measurements supporting in...
2016 new organic reference materials for h, c, n measurements   supporting in...2016 new organic reference materials for h, c, n measurements   supporting in...
2016 new organic reference materials for h, c, n measurements supporting in...
 
Absolute isotopic scale for deuterium analysis of natural waters
Absolute isotopic scale for deuterium analysis of natural watersAbsolute isotopic scale for deuterium analysis of natural waters
Absolute isotopic scale for deuterium analysis of natural waters
 
Acid fumigation preparing c-13 solid samples for organic analysis
Acid fumigation   preparing c-13 solid samples for organic analysisAcid fumigation   preparing c-13 solid samples for organic analysis
Acid fumigation preparing c-13 solid samples for organic analysis
 
Acid fumigation of soils to remove co3 prior to c 13 isotopic analysis
Acid fumigation of soils to remove co3 prior to c 13 isotopic analysisAcid fumigation of soils to remove co3 prior to c 13 isotopic analysis
Acid fumigation of soils to remove co3 prior to c 13 isotopic analysis
 
Carbonate removal by acid fumigation for measuring 13 c
Carbonate removal by acid fumigation for measuring 13 cCarbonate removal by acid fumigation for measuring 13 c
Carbonate removal by acid fumigation for measuring 13 c
 
Carbonate removal from coastal sediments for the determination of organic c a...
Carbonate removal from coastal sediments for the determination of organic c a...Carbonate removal from coastal sediments for the determination of organic c a...
Carbonate removal from coastal sediments for the determination of organic c a...
 
Forensic application of irms
Forensic application of irmsForensic application of irms
Forensic application of irms
 
Improved method for analysis of dic in natural water samples
Improved method for analysis of dic in natural water samplesImproved method for analysis of dic in natural water samples
Improved method for analysis of dic in natural water samples
 
Introduction to isotopic calculation
Introduction to isotopic calculationIntroduction to isotopic calculation
Introduction to isotopic calculation
 
Isotope ratio mass spectrometry minireview
Isotope ratio mass spectrometry   minireviewIsotope ratio mass spectrometry   minireview
Isotope ratio mass spectrometry minireview
 
Measurement of slap2 and gisp 17 o and proposed vsmow slap normalization
Measurement of slap2 and gisp 17 o and proposed vsmow slap normalizationMeasurement of slap2 and gisp 17 o and proposed vsmow slap normalization
Measurement of slap2 and gisp 17 o and proposed vsmow slap normalization
 
Method of sampling and analysis of 13 c dic in groundwaters
Method of sampling and analysis of 13 c dic in groundwatersMethod of sampling and analysis of 13 c dic in groundwaters
Method of sampling and analysis of 13 c dic in groundwaters
 

Recently uploaded

Postal Ballots-For home voting step by step process 2024.pptx
Postal Ballots-For home voting step by step process 2024.pptxPostal Ballots-For home voting step by step process 2024.pptx
Postal Ballots-For home voting step by step process 2024.pptxSwastiRanjanNayak
 
Human-AI Collaboration for Virtual Capacity in Emergency Operation Centers (E...
Human-AI Collaborationfor Virtual Capacity in Emergency Operation Centers (E...Human-AI Collaborationfor Virtual Capacity in Emergency Operation Centers (E...
Human-AI Collaboration for Virtual Capacity in Emergency Operation Centers (E...Hemant Purohit
 
Call On 6297143586 Yerwada Call Girls In All Pune 24/7 Provide Call With Bes...
Call On 6297143586  Yerwada Call Girls In All Pune 24/7 Provide Call With Bes...Call On 6297143586  Yerwada Call Girls In All Pune 24/7 Provide Call With Bes...
Call On 6297143586 Yerwada Call Girls In All Pune 24/7 Provide Call With Bes...tanu pandey
 
VIP Model Call Girls Kiwale ( Pune ) Call ON 8005736733 Starting From 5K to 2...
VIP Model Call Girls Kiwale ( Pune ) Call ON 8005736733 Starting From 5K to 2...VIP Model Call Girls Kiwale ( Pune ) Call ON 8005736733 Starting From 5K to 2...
VIP Model Call Girls Kiwale ( Pune ) Call ON 8005736733 Starting From 5K to 2...SUHANI PANDEY
 
Climate change and safety and health at work
Climate change and safety and health at workClimate change and safety and health at work
Climate change and safety and health at workChristina Parmionova
 
Expressive clarity oral presentation.pptx
Expressive clarity oral presentation.pptxExpressive clarity oral presentation.pptx
Expressive clarity oral presentation.pptxtsionhagos36
 
Top Rated Pune Call Girls Wadgaon Sheri ⟟ 6297143586 ⟟ Call Me For Genuine S...
Top Rated  Pune Call Girls Wadgaon Sheri ⟟ 6297143586 ⟟ Call Me For Genuine S...Top Rated  Pune Call Girls Wadgaon Sheri ⟟ 6297143586 ⟟ Call Me For Genuine S...
Top Rated Pune Call Girls Wadgaon Sheri ⟟ 6297143586 ⟟ Call Me For Genuine S...Call Girls in Nagpur High Profile
 
Call On 6297143586 Viman Nagar Call Girls In All Pune 24/7 Provide Call With...
Call On 6297143586  Viman Nagar Call Girls In All Pune 24/7 Provide Call With...Call On 6297143586  Viman Nagar Call Girls In All Pune 24/7 Provide Call With...
Call On 6297143586 Viman Nagar Call Girls In All Pune 24/7 Provide Call With...tanu pandey
 
EDUROOT SME_ Performance upto March-2024.pptx
EDUROOT SME_ Performance upto March-2024.pptxEDUROOT SME_ Performance upto March-2024.pptx
EDUROOT SME_ Performance upto March-2024.pptxaaryamanorathofficia
 
Call Girls Nanded City Call Me 7737669865 Budget Friendly No Advance Booking
Call Girls Nanded City Call Me 7737669865 Budget Friendly No Advance BookingCall Girls Nanded City Call Me 7737669865 Budget Friendly No Advance Booking
Call Girls Nanded City Call Me 7737669865 Budget Friendly No Advance Bookingroncy bisnoi
 
↑VVIP celebrity ( Pune ) Serampore Call Girls 8250192130 unlimited shot and a...
↑VVIP celebrity ( Pune ) Serampore Call Girls 8250192130 unlimited shot and a...↑VVIP celebrity ( Pune ) Serampore Call Girls 8250192130 unlimited shot and a...
↑VVIP celebrity ( Pune ) Serampore Call Girls 8250192130 unlimited shot and a...ranjana rawat
 
PPT Item # 4 - 231 Encino Ave (Significance Only)
PPT Item # 4 - 231 Encino Ave (Significance Only)PPT Item # 4 - 231 Encino Ave (Significance Only)
PPT Item # 4 - 231 Encino Ave (Significance Only)ahcitycouncil
 
The Economic and Organised Crime Office (EOCO) has been advised by the Office...
The Economic and Organised Crime Office (EOCO) has been advised by the Office...The Economic and Organised Crime Office (EOCO) has been advised by the Office...
The Economic and Organised Crime Office (EOCO) has been advised by the Office...nservice241
 
Call Girls Chakan Call Me 7737669865 Budget Friendly No Advance Booking
Call Girls Chakan Call Me 7737669865 Budget Friendly No Advance BookingCall Girls Chakan Call Me 7737669865 Budget Friendly No Advance Booking
Call Girls Chakan Call Me 7737669865 Budget Friendly No Advance Bookingroncy bisnoi
 
VIP Call Girls Bhavnagar 7001035870 Whatsapp Number, 24/07 Booking
VIP Call Girls Bhavnagar 7001035870 Whatsapp Number, 24/07 BookingVIP Call Girls Bhavnagar 7001035870 Whatsapp Number, 24/07 Booking
VIP Call Girls Bhavnagar 7001035870 Whatsapp Number, 24/07 Bookingdharasingh5698
 
VIP Russian Call Girls in Indore Ishita 💚😋 9256729539 🚀 Indore Escorts
VIP Russian Call Girls in Indore Ishita 💚😋  9256729539 🚀 Indore EscortsVIP Russian Call Girls in Indore Ishita 💚😋  9256729539 🚀 Indore Escorts
VIP Russian Call Girls in Indore Ishita 💚😋 9256729539 🚀 Indore Escortsaditipandeya
 
2024: The FAR, Federal Acquisition Regulations, Part 30
2024: The FAR, Federal Acquisition Regulations, Part 302024: The FAR, Federal Acquisition Regulations, Part 30
2024: The FAR, Federal Acquisition Regulations, Part 30JSchaus & Associates
 
Lucknow 💋 Russian Call Girls Lucknow ₹7.5k Pick Up & Drop With Cash Payment 8...
Lucknow 💋 Russian Call Girls Lucknow ₹7.5k Pick Up & Drop With Cash Payment 8...Lucknow 💋 Russian Call Girls Lucknow ₹7.5k Pick Up & Drop With Cash Payment 8...
Lucknow 💋 Russian Call Girls Lucknow ₹7.5k Pick Up & Drop With Cash Payment 8...anilsa9823
 
VIP Call Girl mohali 7001035870 Enjoy Call Girls With Our Escorts
VIP Call Girl mohali 7001035870 Enjoy Call Girls With Our EscortsVIP Call Girl mohali 7001035870 Enjoy Call Girls With Our Escorts
VIP Call Girl mohali 7001035870 Enjoy Call Girls With Our Escortssonatiwari757
 
Item # 4 - 231 Encino Ave (Significance Only).pdf
Item # 4 - 231 Encino Ave (Significance Only).pdfItem # 4 - 231 Encino Ave (Significance Only).pdf
Item # 4 - 231 Encino Ave (Significance Only).pdfahcitycouncil
 

Recently uploaded (20)

Postal Ballots-For home voting step by step process 2024.pptx
Postal Ballots-For home voting step by step process 2024.pptxPostal Ballots-For home voting step by step process 2024.pptx
Postal Ballots-For home voting step by step process 2024.pptx
 
Human-AI Collaboration for Virtual Capacity in Emergency Operation Centers (E...
Human-AI Collaborationfor Virtual Capacity in Emergency Operation Centers (E...Human-AI Collaborationfor Virtual Capacity in Emergency Operation Centers (E...
Human-AI Collaboration for Virtual Capacity in Emergency Operation Centers (E...
 
Call On 6297143586 Yerwada Call Girls In All Pune 24/7 Provide Call With Bes...
Call On 6297143586  Yerwada Call Girls In All Pune 24/7 Provide Call With Bes...Call On 6297143586  Yerwada Call Girls In All Pune 24/7 Provide Call With Bes...
Call On 6297143586 Yerwada Call Girls In All Pune 24/7 Provide Call With Bes...
 
VIP Model Call Girls Kiwale ( Pune ) Call ON 8005736733 Starting From 5K to 2...
VIP Model Call Girls Kiwale ( Pune ) Call ON 8005736733 Starting From 5K to 2...VIP Model Call Girls Kiwale ( Pune ) Call ON 8005736733 Starting From 5K to 2...
VIP Model Call Girls Kiwale ( Pune ) Call ON 8005736733 Starting From 5K to 2...
 
Climate change and safety and health at work
Climate change and safety and health at workClimate change and safety and health at work
Climate change and safety and health at work
 
Expressive clarity oral presentation.pptx
Expressive clarity oral presentation.pptxExpressive clarity oral presentation.pptx
Expressive clarity oral presentation.pptx
 
Top Rated Pune Call Girls Wadgaon Sheri ⟟ 6297143586 ⟟ Call Me For Genuine S...
Top Rated  Pune Call Girls Wadgaon Sheri ⟟ 6297143586 ⟟ Call Me For Genuine S...Top Rated  Pune Call Girls Wadgaon Sheri ⟟ 6297143586 ⟟ Call Me For Genuine S...
Top Rated Pune Call Girls Wadgaon Sheri ⟟ 6297143586 ⟟ Call Me For Genuine S...
 
Call On 6297143586 Viman Nagar Call Girls In All Pune 24/7 Provide Call With...
Call On 6297143586  Viman Nagar Call Girls In All Pune 24/7 Provide Call With...Call On 6297143586  Viman Nagar Call Girls In All Pune 24/7 Provide Call With...
Call On 6297143586 Viman Nagar Call Girls In All Pune 24/7 Provide Call With...
 
EDUROOT SME_ Performance upto March-2024.pptx
EDUROOT SME_ Performance upto March-2024.pptxEDUROOT SME_ Performance upto March-2024.pptx
EDUROOT SME_ Performance upto March-2024.pptx
 
Call Girls Nanded City Call Me 7737669865 Budget Friendly No Advance Booking
Call Girls Nanded City Call Me 7737669865 Budget Friendly No Advance BookingCall Girls Nanded City Call Me 7737669865 Budget Friendly No Advance Booking
Call Girls Nanded City Call Me 7737669865 Budget Friendly No Advance Booking
 
↑VVIP celebrity ( Pune ) Serampore Call Girls 8250192130 unlimited shot and a...
↑VVIP celebrity ( Pune ) Serampore Call Girls 8250192130 unlimited shot and a...↑VVIP celebrity ( Pune ) Serampore Call Girls 8250192130 unlimited shot and a...
↑VVIP celebrity ( Pune ) Serampore Call Girls 8250192130 unlimited shot and a...
 
PPT Item # 4 - 231 Encino Ave (Significance Only)
PPT Item # 4 - 231 Encino Ave (Significance Only)PPT Item # 4 - 231 Encino Ave (Significance Only)
PPT Item # 4 - 231 Encino Ave (Significance Only)
 
The Economic and Organised Crime Office (EOCO) has been advised by the Office...
The Economic and Organised Crime Office (EOCO) has been advised by the Office...The Economic and Organised Crime Office (EOCO) has been advised by the Office...
The Economic and Organised Crime Office (EOCO) has been advised by the Office...
 
Call Girls Chakan Call Me 7737669865 Budget Friendly No Advance Booking
Call Girls Chakan Call Me 7737669865 Budget Friendly No Advance BookingCall Girls Chakan Call Me 7737669865 Budget Friendly No Advance Booking
Call Girls Chakan Call Me 7737669865 Budget Friendly No Advance Booking
 
VIP Call Girls Bhavnagar 7001035870 Whatsapp Number, 24/07 Booking
VIP Call Girls Bhavnagar 7001035870 Whatsapp Number, 24/07 BookingVIP Call Girls Bhavnagar 7001035870 Whatsapp Number, 24/07 Booking
VIP Call Girls Bhavnagar 7001035870 Whatsapp Number, 24/07 Booking
 
VIP Russian Call Girls in Indore Ishita 💚😋 9256729539 🚀 Indore Escorts
VIP Russian Call Girls in Indore Ishita 💚😋  9256729539 🚀 Indore EscortsVIP Russian Call Girls in Indore Ishita 💚😋  9256729539 🚀 Indore Escorts
VIP Russian Call Girls in Indore Ishita 💚😋 9256729539 🚀 Indore Escorts
 
2024: The FAR, Federal Acquisition Regulations, Part 30
2024: The FAR, Federal Acquisition Regulations, Part 302024: The FAR, Federal Acquisition Regulations, Part 30
2024: The FAR, Federal Acquisition Regulations, Part 30
 
Lucknow 💋 Russian Call Girls Lucknow ₹7.5k Pick Up & Drop With Cash Payment 8...
Lucknow 💋 Russian Call Girls Lucknow ₹7.5k Pick Up & Drop With Cash Payment 8...Lucknow 💋 Russian Call Girls Lucknow ₹7.5k Pick Up & Drop With Cash Payment 8...
Lucknow 💋 Russian Call Girls Lucknow ₹7.5k Pick Up & Drop With Cash Payment 8...
 
VIP Call Girl mohali 7001035870 Enjoy Call Girls With Our Escorts
VIP Call Girl mohali 7001035870 Enjoy Call Girls With Our EscortsVIP Call Girl mohali 7001035870 Enjoy Call Girls With Our Escorts
VIP Call Girl mohali 7001035870 Enjoy Call Girls With Our Escorts
 
Item # 4 - 231 Encino Ave (Significance Only).pdf
Item # 4 - 231 Encino Ave (Significance Only).pdfItem # 4 - 231 Encino Ave (Significance Only).pdf
Item # 4 - 231 Encino Ave (Significance Only).pdf
 

Agwat d-20-00151 reviewer

  • 1. Agricultural Water Management Intra-block spatial and temporal variability of plant water status and its effect on grape and wine parameters --Manuscript Draft-- Manuscript Number: AGWAT-D-20-00151 Article Type: Research Paper Keywords: Anthocyanins; Tannins; Yield; Cabernet Sauvignon; Stem water potential; Micro- vinification Abstract: Improving wine quality is a critical factor for the wine industry. For that matter, phenolic compounds play an important role in wine quality contributing to its organoleptic characteristics. Although several factors can influence the phenolic concentration, water in particular has shown to have a direct impact on the phenolic compounds. It is however complex to quantitate water stress by plant water status measurements as they depend on the specific site (topography, viticultural management practices and soil characteristics) creating variable values with-in the vineyard block. This study focused on analysing the effect of natural and temporal variability of plant water status on grape and wine parameters. A field experiment was done in a commercial Cabernet Sauvignon block to monitoring the temporal and spatial intra-block variability of plant water status using a grid sample method. Soil analysis and topography were included in the evaluation. Each target vine was assessed for yield, ripeness as well as standard juice parameters. Micro-vinification was done for each target vine in small lots of 2 kg and the concentration of flavonoids (anthocyanins and tannins) analysed. The results showed that the spatial and temporal variability was evident along the season. Plant water status influenced changes in the concentration of phenolic compounds and grape parameters. The vines in the stressed class were associated with changes in soil texture and topography. These plants presented a significant increase in sugar content, anthocyanins and tannins and a strong decrease in yield. The results of this study may help to understand and quantify how spatial variability is naturally distributed and its effect on grape and wine quality parameters. Powered by Editorial Manager® and ProduXion Manager® from Aries Systems Corporation
  • 2. Highlights • Several factors can influence the phenolic concentration in wine; however, water stress has a direct impact. • Plant water status is variable with-in the vineyard block and depend on the specific site conditions (topography, management practices and soil characteristics). • A field experiment was done in a commercial Cabernet Sauvignon block to monitoring the temporal and spatial intra-block variability of plant water status using a grid sample method. • The level of water stress reached by the vines was associated with changes in soil texture, topography, and climatic conditions along the season. • The vines in the stressed class presented a significant increase in sugar content, anthocyanins and tannins and a strong decrease in yield. Highlights
  • 3. Intra-block spatial and temporal variability of plant water status and its effect on grape and wine parameters Aladino Jasse1 , Anke Berry1 , Carlos Poblete-Echeverría1, * 1 Department of Viticulture and Oenology, Faculty of AgriSciences, Stellenbosch University, Private Bag X1, Matieland 7602, South Africa. * Correspondence: cpe@sun.ac.za; Tel.: +27-21-808-2747 Abstract Improving wine quality is a critical factor for the wine industry. For that matter, phenolic compounds play an important role in wine quality contributing to its organoleptic characteristics. Although several factors can influence the phenolic concentration, water in particular has shown to have a direct impact on the phenolic compounds. It is however complex to quantitate water stress by plant water status measurements as they depend on the specific site (topography, viticultural management practices and soil characteristics) creating variable values with-in the vineyard block. This study focused on analysing the effect of natural and temporal variability of plant water status on grape and wine parameters. A field experiment was done in a commercial Cabernet Sauvignon block to monitoring the temporal and spatial intra-block variability of plant water status using a grid sample method. Soil analysis and topography were included in the evaluation. Each target vine was assessed for yield, ripeness as well as standard juice parameters. Micro-vinification was done for each target vine in small lots of 2 kg and the concentration of flavonoids (anthocyanins and tannins) analysed. The results showed that the spatial and temporal variability was evident along the season. Plant water status influenced changes in the concentration of phenolic compounds and grape parameters. The vines in the stressed class were associated with changes in soil texture and topography. These plants presented a significant increase in sugar content, anthocyanins and tannins and a strong decrease in yield. The results of this study may help to understand and quantify how spatial variability is naturally distributed and its effect on grape and wine quality parameters. Keywords: Anthocyanins; Tannins; Yield; Cabernet Sauvignon; Stem water potential; Micro-vinification. Manuscript File Click here to view linked References
  • 4. 2 1. Introduction Plant water status in a vineyard is variable inside of the blocks (intra-block variability) according to topography, viticultural management practices, and soil characteristics. Previous research has established that vine and bunch variability have a direct impact on the composition of the final wine (Kontoudakis et al. 2010). Although the grape parameters, such as yield, present spatial variability in the same block, traditional viticulture approaches the variability in the field in a uniform manner (Arnó et al. 2009). To this end, Precision Viticulture (PV) technologies aims at understanding and managing the spatial variability. PV covers a wide group of techniques and technologies with the objective of controlling spatial variability improving grape quality, adjusting crop management to field spatial variability (Santesteban 2019). Irrigation strategies such as regulated deficit irrigation (RDI) largely affect plant water status (Acevedo-Opazo et al. 2010) when applied in specific areas of the vineyards. Interestingly, Brillante et al. (2017) demonstrated that spatial variability in plant water status still exist in a homogenous irrigation scheme. Advances of wine production methods have led to the awareness of phenolic compounds impacting wine quality (Kennedy et al. 2006). Phenolic compounds are a crucial quality parameter of wines contributing to their organoleptic characteristics, particularly to colour, flavour, texture, and astringency of the wine and to its antioxidant properties (Teixeira et al. 2013). The sensory attributes are determined by the grape physiological and phenolic ripeness when the winemaker decides to harvest and are directly related with the level of phenolics in the berry (Adams 2006). Standard physiological ripeness parameters such as sugar concentration, titratable acidity, pH, and sensorial taste are straightforward to evaluate at harvest, however, phenolic ripeness is costly and time-consuming (Guidetti et al. 2010). In this sense, to answer wine consumer demands, winemakers and researchers have focused on controlling phenolic ripeness (Kontoudakis et al. 2010). When grapes reach the ripe stage (red berries) skins are rich in flavonols, flavan-3-ols and anthocyanins, while seeds are known to be high in flavan-3-ols, which contributes to astringency and bitterness (Williams 2012). It has been demonstrated that the presence of phenolic compounds in the final wine is dependent on the biosynthesis in the grapevine, the phenolic ripeness process (Adams 2006), winemaking, and ageing (Monagas et al., 2006). Different factors can therefore influence the concentration of phenolic compounds. Previous research has established the impact of viticulture practices, different oenological techniques (Nel 2018), variety, vintage, and location on the phenolic composition of grapes and wines (Cliff et al. 2007).
  • 5. 3 Viticultural practices can influence berry secondary metabolite concentrations and therefore contribute to wine sensorial attributes, antioxidant capacity, stabilization, and protection during aging (Ferrandino & Lovisolo 2014). This concept is supported by Vilanova et al. (2009) who noted that scientific literature perceives environmental conditions or viticultural practices as having a strong impact on the concentration of flavonoids. Guidoni et al. (2008) reported that berry phenolic ripening is directly impacted by seasonal climatic conditions and viticulture practices (cluster thinning and leaf removal). It has been widely reported that plant water status can influence the levels of phenolic compounds in grapes and wine (e.g. Braidot et al. 2008; Deloire et al. 2004; Downey et al. 2006). A detailed examination of the influence of viticulture practices on grape phenolic compounds is presented by Brillante et al., (2018), in this study, the authors determined that the application of water restrictions to grapevine has a higher influence on berry ripening than canopy management. Overall, there seems to be some evidence to indicate that reducing plant water status has an implication on skin concentration of tannins and anthocyanins in berries with the same size (Roby et al. 2004). Along with the level of water deficit, the period of water stress also plays an important role. The application of water stress before or after veraison, is significant in determining fruit and wine phenolic composition. Bindon et al. (2011), Blancquaert et al. (2019) and Kennedy et al. (2002) suggested that water deficit applied before or after veraison affects the biosynthesis of flavonoids in a different manner. It is therefore important to understand the development of chemical compounds from grapes to wine in a spatial and temporal context with the aim of improving viticulture practices, such as irrigation, which can aid in achieving better wine quality. Therefore, this study is focused primarily on evaluating spatial and temporal natural intra-block plant water status variability as well as traditional harvest parameters to investigate the effect of these variations on grape and wine quality parameters by defining classes of water stress. 2. Methods and material 2.1. Site description, soil, and weather data The study was carried out during the growing season 2019-2020 at a commercial vineyard (Thelema Mountain Vineyards). The experimental site is located at the Stellenbosch Wine of Origin district, Simonsberg- Stellenbosch ward – South Africa (SAWIS, 2014), 33°54'11.8"S - 18°55'12.4"E and at 430 m above sea-level. The geology of the region is characterized by compacted sedimentary formations of the Malmesbury Group from the Precambrian Era (King 1983; Carey 2005).
  • 6. 4 The climate in the area is Mediterranean with winter rainfall. According to Köppen-Geiger climate classification it presents a Dry and Warm Summer -Csb (Peel et al., 2007), receiving summer morning Northerly hot winds and afternoon cooler South-Westerly breezes originating from False Bay (Morgenthal 2004). The seasonal (from September 2019 to February 2020) maximum average temperature was 33.03°C and minimum average temperature was 10.65°C, and the seasonal effective rainfall is approximately 639.05 mm. The experimental block is composed of 2.24 ha of sandy loam soil with a pH of 5.7, planted in 2003 with vines cv. Cabernet Sauvignon (clone CS 338 C), grafted on 101-114 Mgt rootstock - Vitis riparia x Vitis rupestris. The 4,840 planted vines in the block have an inter row spacing of 2.5 m and 2 m of vine spacing. The vines were trained to a Vertical Shoot Positioning (VSP) trellis system with bi-lateral cordon and spur pruned. The block has an orientation North/South, facing South. The vineyard was drip-irrigated with emitters spaced at 0.6 m and totally delivering 2.3 L/h per vine. The historical average yield in the block is 8.24 Ton/ha with an average of 4.0 kg/vine. 2.2. Selection of the target vines A combination of plant, soil and water stress variables were measured and analysed to select the target vines, covering all the spatial variability conditions (different levels of vigour) presented in the experimental block. Soil surface electrical conductivity (ECa), Trunk circumference (TC), and Normalized difference vegetation index (NDVI) (from previous seasons) were used to locate the target vines. 2.2.1. Soil surface electrical conductivity (ECa) At the beginning of the experiment, (September 2019), ECa was measured, using an electromagnetic sensor (EM38, Geonics Ltd., Mississauga, Canada) together with a Garmin eTrex 10 GPS. The GPS locations of each vine in the block were manually geo-corrected using the number of vines per row, distance between vines and length of the rows. The entire block was scanned in a row alternate sequence, with a sampling frequency of 5 reads per second on vertical dipole mode. 2.2.2. Trunk circumference At the same period that ECa was measured (September 2019), TC of all vines in the block was determined by manual measuring the circumferences of the trunk at an average section between 10 cm above the graft union and 10 cm bellow the head of the vine.
  • 7. 5 2.2.3. Normalized difference vegetation index The standard normalized vegetation index (NDVI) from 2 previous seasons (2017-2018 and 2018- 2019) was calculated for the maximum vegetative growth period (January to February) using Sentinel-2A images corresponding to T34HCH tile. Free-cloud atmospherically corrected images were downloaded from the European Space Agency (ESA) Copernicus project website. NDVI was calculated in R (R Core Team, 2020) using the standard equation proposed by Rouse et al. (1974). 2.2.4. k-means analysis Data from ECa, TC and NDVI was analysed generating classes of variability using the standard unsupervised k-means function in R (R Core Team, 2020). The k-means algorithm is one of the most used methods for clustering and it partitions the data by minimizing the within-cluster sum of squares to achieve higher within-cluster similarity. The basic idea behind k-means clustering consists of defining clusters so that the total intra-cluster variation is minimized (Zhao et al. 2010). In this study, the experimental vineyard block was divided arbitrarily into 4 spatial clusters for each analysed variable. The clusters were ordered in ascending way and then in the matching areas the target vines were located considering a separation of 5 vineyard rows to cover the whole vineyard block. As a result, a total of 43 target vines were selected (Fig. 1). The block edges were avoided in order to decrease the influence of winds, solar exposition, and water streams on vine measurements. All target vines were subjected to the same canopy management, vine treatments, and irrigation schedules along the growing season. Fig.1. Location of the target vines and distribution in the experimental block.
  • 8. 6 2.3. Field measurements on the target vines during the growing season. 2.3.1. Soil physical and chemical characteristics At the beginning of the season, soil samples were extracted at a depth of 50 cm, distancing 30 cm from the target vines at the beginning of the season. The samples were analysed at the Directorate Plant science of Elsenburg for texture, resistance, macro/micronutrients, exchangeable acidity, particle size and ammonium (NH4). 2.3.2. Plant water status Stem water potential (SWP) was measured weekly, from November to the end of February, using a pressure chamber (PMS Instrument Company, model 1505D, Albany, USA). SWP was measured around midday (12:00 to 13:00 local time) on every target vine. Mature and healthy leaves were selected from the middle of the canopy, facing the shaded side of the canopy to avoid overheating. To diminish leaf transpiration each selected leaf was covered with aluminium foil inside a plastic zip bag at least 1 hour before midday measurements (Choné et al. 2000). 2.4. Harvest measurements 2.4.1. Physical measurements (Yield components) All target vines were harvested 1 day before the commercial harvest of the block, with an average 23.8 Brixº for the entire block. All bunches were carefully handpicked. Each target vine was analysed individually for the following variables: Total vine weight (TVW), bunch counting (BC) and bunch weight (BW). 2.4.2. Standard berry composition The bunches of each target vine were destemmed, and the berries crushed, separately, for micro- vinification. A sample of 4 ml of juice was collected after crushing the berries. The juice was immediately analysed to determine sugar concentration (PAL-1 Digital Pocket Refractometer, Atago, USA), pH and titratable acidity (TA) (Metrohm, model 702 SM Titrino, Switzerland).
  • 9. 7 2.5. Micro-vinifications Harvest date was determined by sugar concentration and berry physical evaluation by the farm winemaker. Each target vine was harvested and kept separately. After physical measurements were complete, bunches were destemmed and berries were homogenized for each target vine. In order to make fermentation relatable, all fermentations were scaled to a standardized 2 kg CONSOL jar. The berries were hand crushed and standard experimental winemaking procedures specified by the Department of Viticulture and Oenology at Stellenbosch University, were followed. The must was inoculated with Saccharomyces cerevisiae (Lalvin ICV D21, Lallemand, France) and a blended complex yeast nutrient (Fermaid K Lallemand France) was added. After 10 days of fermentation in a temperature control room at 23ºC, all wines had a minimum residual sugar of 2.5 g/l and grapes were manually pressed. 2.6. Phenolic analysis in wine Wine phenolic compounds were calculated using spectrophotometric analysis with a Multiskan GO Microplate Spectrophotometer (Thermo Fisher Scientific, Inc., Waltham, MA, USA), following the protocol proposed by (Aleixandre-Tudo et al. 2019). The supernatant was diluted 50 times with HCL 1M, kept in the dark for 1 hour and analysed with a Multiskan GO Microplate Spectrophotometer. The absorbance was calculated in the wavelengths of 270 nm, 290nm, 500nm, 520nm, 540nm. The results were uploaded to the online web-based phenolic analysis platform - Phenolab.co.za - to calculate the content of anthocyanins and tannins (Aleixandre-Tudo et al. 2017; Aleixandre-Tudo et al. 2019). 2.4.5. Data analysis Basic descriptive analysis, principal component analysis (PCA) and correlation analysis were applied to the variables measured during the growing season. PCA supported the search for patterns in the data and the classification of any combination of variables that could explain the impact of plant water status on the wine and grape parameters analysed. The correlation analysis was used to evaluate the strength of relationship between the analysed variables and the final result was presented as a correlation matrix. The non-parametric Kruskal–Wallis Rank Sum Test was used to determine whether the variables belonging to the water stress classes were different. Moreover, Pairwise-Wilcox Test was used to determine which classes differed statistically according to the level of water stress for the analysed grape and wine variables. All data processing, statistical analyses and graphical results were performed using R software (R Core Team, 2020).
  • 10. 8 3. Results 3.1. Weather conditions and Total water application In a historical context of 9 seasons, the season 2019-2020 presented maximum values similar to the historical records, however the minimum temperature was higher than the historical average by 1.36 °C. Considering an equivalent growing season period, the season 2019-2020 registered the lowest accumulated precipitation (639.05 mm - historical average 888.63 mm). The precipitation was scarce resulting in a noticeable water deficiency during the grapevine growing season. From budburst to berry setting the experimental site received 176.5mm of rain. However, between Berry setting and Harvest only 27 mm of precipitation was registered (Table 1). After veraison, almost no precipitation was registered (only one event of 1.01 mm). According to these conditions, two irrigations were scheduled by the farm manager. Table 1. Summary of climatic data of the experimental site per Week during the study period. W T (°C) Tmax (°C) Tmin (°C) RH (%) Pp (mm/week) I (m3 /ha) SR (MJ/m2 /day) ET0 (mm/week) VPD (kPa) 1 18.66(±20.1) 29.53 10.66 65.71(±20.2) 8.12 - 22.03(±21.2) 25.64 0.74 2+ 16.01 (±15.4) 25.00 9.72 68.92(±12.6) 0.00 - 26.94(±4.4) 27.38 0.57 3 19.69 (±6.3) 33.36 12.38 65.18(±6.7) 0.00 - 24.75(±20.7) 34.30 0.80 4 20.83(±13.8) 32.86 10.01 51.49(±16.7) 6.59 - 26.72(±11.9) 36.43 1.20 5 20.34(±17.03) 29.48 10.89 68.21(±23.8) 9.13 - 28.63(±6.3) 28.95 0.76 - 17.76(±18.3) 27.24 11.50 69.32(±18.0) 3.15 - 23.45(±25.0) 25.12 0.62 - 17.95(±11.5) 29.97 10.31 66.90(±14.1) 7.11 - 20.93(±38.5) 28.91 0.68 - 21.51(±20.2) 27.45 16.09 57.80(±19.0) 0.00 - 23.36(±37.9) 10.98 1.08 6++ 20.11(±8.6) 28.01 15.00 75.17(±14.5) 0.00 - 24.61(±32.0) 22.27 0.59 7 21.37(8.5) 31.40 14.77 69.16(±8.8) 0.00 - 24.87(±18.4) 30.01 0.79 8 24.32(±18.8) 34.33 15.70 60.07(±9.7) 0.00 123.04 24.17(±35.8) 34.70 1.22 9 20.90(±17.2) 28.62 12.44 66.20(±19.2) 1.01 23.14(±23.8) 29.87 0.84 10 22.21(±12.3) 33.45 12.66 62.84(±20.9) 0.00 184.56 25.65(±6.7) 33.53 1.00 11 22.50(±11.0) 33.57 16.02 65.48(±19.8) 0.00 23.73(±17.2) 31.91 0.94 12+++ 24.68(±16.0) 34.27 15.08 58.18(±27.3) 0.00 - 23.46(±15.2) 34.43 1.30 W is the Week number from 04/11/2019 to 17/02/2020, numbered weeks indicated the weeks with SWP measurements, no numbered weeks indicates that SWP was not measured by problems with the weather conditions, + indicates Setting,++ indicates Veraison,+++ indicates Harvest, T is the average ambient temperature, Tmin is the minimum ambient temperature, Tmax is the maximum ambient temperature, Pp is the precipitation, RH is the relative humidity, I is the irrigation amount, SR is the solar radiation, ET0 is the reference evapotranspiration, VPD is the average vapor pressure deficit. Values in brackets indicate the coefficient of variation expressed in percentage.
  • 11. 9 The plant water status analysis was done during the course of 12 weeks with a gap between the week 5 and 6, because during this period the weather conditions were not suitable for SWP measurements (light rain and cloudiness at midday). The maximum temperature in January and February was 34.3°C and 37.1°C, respectively. High values of vapor pressure deficit (VPD) were calculated for the corresponding higher values of temperature and evapotranspiration (ETo). The highest atmospheric demand was registered at post-veraison, with a maximum in week 8 (ETo = 34.7 mm/week and VPD = 1.22 kPa) (Table 1). 3.2. Descriptive analysis of grape and oenological variables The results obtained from the juice and wine analysis are summarized in Table 2. Block scale represents the value reported by the winemaker at commercial harvest. As was expected the Block value registered for sugar content, TA and yield was between the minimum and maximum value and close the average calculated for the 43 target vines. Table 2. Descriptive analysis of field and wine variables. Anthocyanins+ (mg/L) Tannins+ (mg/L) Sugar content++ (°Bx) TA++ (g/L) Yield (kg/plant) Block scale - - 25.00 5.43 4.90 Avg 590.8 1119.8 23.87 4.50 5.23 Max 817.8 1911.2 26.53 5.83 9.20 Min 323.6 577.4 19.90 3.87 2.01 CV 19.02 26.28 5.41 10.35 34.34 + Indicates phenolic compounds measured in wine, ++ Indicates chemical analysis measured in juice, Block scale is the value reported by the winemaker at commercial harvest, Avg is the average value for the target vines, Max is the maximum value for the target vines, Min is the minimum value for the target vines, CV is the coefficient of variation (%), TA is the total acidity. From the target vines, high variability was registered for yield, tannins and anthocyanins with CV values of 34.34%, 26,28% and 19.02%, respectively (Table 2). The lowest variability was registered for sugar content (5.41%). Only 3 plants registered a juice sugar content bellow 22° Bx and 7 plants presented values higher than 25° Bx. Table 3 indicates the values of SWP along the growing season from November to February (12 weeks). SWP values increase as grapes reached closer to the maturity stage, reaching a maximum water stress period during Week 11 (post-veraison period). The variability was around 17% with higher values at the beginning of the season (lower water stress). From week 1 to week 6 the average of SWP varies between 4.85 bar and 7.32 bar, showing low to medium limitation in plant water availability before veraison. A slight decrease in water
  • 12. 10 availability is observed in week 5, after the maximum daily temperatures increased significantly in the previous weeks. From the initial phase of veraison (week 6) the steady increase in average SWP values (from 7.32 to 10.90 Bar) indicates a decrease in the plant water availability (average reduction of 32.8%). As shown in Figure 2, spatial variability of SWP changed along the season as well as the level of water stress reached by the plants. Plants with higher values of SWP (more water stress) are spatially concentrated in the central, top central and top right areas of the block. This distribution is in line with the topographic inclination of the block and the soil texture analysis. Table 3. Variation of the SWP per Week during the studied season. W1 W2 W3 W4 W5 W6 W7 W8 W9 W10 W11 W12 W.d Avg 4.86 4.12 4.85 5.30 6.50 7.32 8.92 10.23 8.73 10.63 11.43 10.90 7.82 Diff - -0.74 0.73 0.45 1.20 0.82 1.61 1.31 -1.50 1.91 0.79 -0.52 - Max 6.89 5.99 7.41 6.72 8.90 10.15 11.64 13.78 11.65 13.80 14.10 13.90 9.26 Min 3.05 2.32 2.30 3.66 3.38 5.10 6.80 6.55 6.10 6.27 6.50 6.90 6.18 CV 20.45 20.76 20.07 14.95 20.05 14.85 14.38 18.07 16.10 17.87 14.96 16.76 10.77 W.d is the whole dataset, Avg is the average value for the target vines (Bar), Max is the maximum value for the target vines (Bar), Min is the minimum value for the target vines (Bar), Diff is the difference between consecutives weeks (Bar), CV is the coefficient of variation (%), W indicates weeks. Fig. 2. Temporal and spatial variability of SWP for the target vines from pre-Veraison (Week 3) to Harvest (Week 12).
  • 13. 11 3.3. PCA and correlation analysis A PCA analysis was done to explore the effect of the SWP measured during 12 weeks over the 43 target plants on grape and wine parameters (Figure 3). The first 2 dimensions explained 53.9% of the variation in the data, with 40.3% explained by Dimension 1 and 12.5% explained by Dimension 2. As expected, anthocyanins and tannins were directly correlated with the Sugar concentrations and indirectly correlated with yield and acidity. The 12-SWP weekly measurements presented different associations with the phenolic compounds (anthocyanins and tannins) showing an effect of the time progression. This time effect is evident in the correlation matrix (Figure 4) where higher correlation values between phenolic compounds and SWP were registered from week 7 onwards. Also, a positive significant correlation was indicated between phenolic compounds and sugar concentration. As anticipated, the total acidity and yield had a strong negative correlation with sugar content and the phenolic compounds. Fig. 3. PCA analysis considering all the data set from the 2019 growing season for cv. Cabernet Sauvignon. Nomenclature used: P represent the target plants, W represent SWP for the 12 weeks, Acidity is the total acidity (TA), Sugar is the grape juice sugar content, Anth is the anthocyanins concentration measured in wine, Tannins is the tannin concentration measured in wine, Yield is the yield per vine, contrib is the level of contribution each variable had to the dimensions. Size and colour intensity of the circles indicate the contribution of the individuals (target plants).
  • 14. 12 Fig. 4. Correlation matrix of the studies variables. W represent SWP for the 12 weeks. Colour and the size of the circles are proportional to the correlation coefficients between the variables. 3.2. Classification of the target vines according to the plant water status From the SWP measured values along the season, the target plants were grouped according to the level, period, and duration of the waters stress in 3 classes: i) Class 1 - low water deficit, ii) Class 2 - moderate water deficit and iii) Class 3 - severe water deficit (Fig. 5). As benchmarks, the period between week 6 to 8 (veraison) was used to discriminate the level of stress. The general thresholds indicated for Class 1, 2 and 3 were < 9 Bar, between 9 to 12 Bar and > 12 Bar, respectively. Fig. 5. Classification of the seasonal evolution of SWP along the growing season. Yellow area represents the Veraison period and arrows indicate the irrigation events. Irrigation Irrigation Irrigation
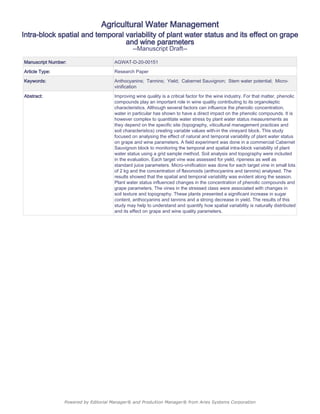
  • 15. 13 Plants in Class1 have a more homogeneous variation along the season, with a low amplitude of SWP values from Week 1 to Week 12. On the other side, plants from Class 3 presented a greater amplitude of SWP during the season. The progression of water deficit in the plants until veraison is similar in all three classes, however, between week 6 and week 8 (veraison period) the plants in Class 3 rapidly reached the point of severe water deficit. This trend in Class 3 was only diminished for a week, with the first irrigation event, to return rapidly to the same level of water deficiency until harvest (Fig. 5). The irrigation events had a lighter effect on SWP values in Class 1 and Class 2 than in Class 3, where vine water deficit was severely affected. Table 4. Descriptive analysis water, soil, grape and wine variables in the 3 water stress classes. SWP (Bar)* Sand (%)** Clay (%)** Carbon (%)** Anth (mg/L)+ Tann (mg/L)+ SC (°B)++ TA (g/L)++ MA (g/L)++ Yield (Kg/v) Class 1 Avg 7.04 24.86 41.00 8.43 523.4 1028.4 23.18 4.55 3.38 5.03 Max 11.80 50.00 46.00 14.00 673.1 1454.3 24.7 5.6 5.4 9.2 Min 2.32 8.00 36.00 6.00 323.6 577.4 19.9 4.1 2.4 8.4 CV 7.63 40.29 8.12 21.18 17.1 26.6 6.0 9.3 27.0 31.4 Class 2 Avg 7.89 40.58 8.32 1.78 583.5 1041.2 23.77 4.56 3.72 5.88 Max 13.90 48.00 12.00 2.30 757.7 1464.2 25.4 5.7 5.3 8.3 Min 2.43 34.00 6.00 1.35 440.5 764.0 22.0 4.0 2.6 3.0 CV 7.45 8.31 23.05 13.78 16.10 21.92 3.67 9.07 21.51 28.17 Class 3 Avg 8.86 39.11 8.89 1.71 711.1 1427.7 25.17 4.29 3.50 3.56 Max 14.10 44.00 12.00 2.03 817.8 1911.2 26.5 5.8 5.1 5.8 Min 2.30 32.00 8.00 1.35 544.3 1049.1 23.7 3.9 2.6 2.0 CV 13.35 9.08 19.84 13.54 12.21 18.46 3.76 14.26 21.75 34.08 * Indicates field measurements of SWP (Stem Water potential) average value, ** Indicates soil analysis (surrounding soil) from each target vine, + Indicates phenolic compounds measured in wine, ++ Indicates chemical analysis measured in juice, Avg is the average value for the target vines, Max is the maximum value for the target vines, Min is the minimum value for the target vines, CV is the coefficient of variation (%), TA is the total acidity, MA is the malic acid, SC is the sugar content in grape juice, Anth is the anthocyanins concentration in wine and Tann is the tannin concentration in wine. The box plots presented in Fig. 6, gives an indication of the dispersion of the variables inside the water stress classes and the statistical differences between classes (Wilcoxon Rank Sum test). In general, acidity presented lower differences, no statistical differences among the classes were registered for malic acid (Fig. 6e) and a single difference between Class 2 and Class 3 was registered for titratable acidity (Fig. 6b). The analysis of anthocyanins, tannins, sugar content and yield, presented significant statistical differences for Class 3 in all cases. For anthocyanins, Class 3 was significantly higher than Class 1 and 2 (Fig. 6a). The positive skew in Class 3 reveals that 50% of the observations in this group were higher than 711.1 mg/L (Table 4). Likewise, tannins presented significantly higher values in Class 3 (Fig. 6d). However, Class 3 demonstrates a much
  • 16. 14 smaller 2nd quarter, indicating that 50% of the plants presented value superior to 1427.7 mg/L and a highest mean value of 1911.2 mg/L (Table 4). The sugar content was similar for Class 1 and 2, however, Class 3 was significantly higher (Fig. 6c) ranging from 23.7°Brix to 26.5°Brix (Table 4). As expected, the yield of the plants in Class 3 was significantly lower than the yield in the remaining 2 classes (Figure 6f). In fact, 50% of the plants in Class 3 had a yield lower than 3.56 kg/plant. Conversely, more than 75% of the plants in Class 1 and 2 had a yield superior to 4.26 kg/plant. Figure 6. Boxplots of grape and wine parameters within each water stress class, a) Anthocyanins, b) Titratable acidity, c) Sugar content, d) Tannins, d) Malic acid, e) Yield per vine. p-values for Kruskal-Wallis tests indicate a difference in means within a group. Lines with p-values indicate statistically significant (p- value < 0.05) in the Wilcoxon Rank Sum test for respective pairwise differences in means. 4. Discussion 4.1. Temporal variability of SWP SWP is a plant based direct measurement variable used to evaluate the amount of water inside the plant and therefore the plant water requirement (McCutchan & Shackel 2019). In this regard, SWP has been described as the most convenient way to measure vine water status as it is used as an aid in vineyard irrigation management
  • 17. 15 decisions (Williams 2012; Choné et al. 2001). In our experiment the temporal variability of SWP during the growing season was evident. Water stress measured by SWP increased along the season, indicating a decrease of the plant water content as a consequence of high atmospheric demand and lower soil water availability. This temporal pattern has been reported in several articles (Brillante et al. 2016; Van Leeuwen et al. 2009; Hardie & Considine 1976). The atmospheric demand characterized by VPD and ETo increased along the season reaching maximum values in the post-veraison period where the maximum water stress was also evidenced by SWP measurements (Table 1 and Table 3). It has been previously reported that SWP, in drip irrigated vineyards, are more closely correlated to the atmospheric demand (e.g. VPD) than to soil moisture (Rogiers et al. 2012). In our experiment this condition was clear since SWP was well correlated with the changes in VPD and ETo along the season. SWP values registered in this study were positively impacted by the irrigation events (lower SWP values) in the post-Veraison period (Fig. 4). This finding is consistent with other studies that report a clear impact of irrigation on plant water content (Acevedo-Opazo et al. 2010; Zúñiga et al. 2018; Chaves et al. 2007; Brillante et al. 2018). 4.2. Spatial intra-block variability of SWP When viticulture practices are homogeneous to all plants in a block, soil type and topography are the main responsible factors for the natural spatial variability in vineyards (Yu et al. 2020). As temperature increased, the relative humidity diminished and the soil became drier, thus plant water status established a clear spatial pattern in our experimental block (Fig. 2). Therefore, spatial variability of plant water status was noticed with CV values around 18% (Table 3). Brillante et al. (2016) indicated the existence of big natural spatial variations in grapevine water status within short distances in vineyards. In the mentioned study plant water stress of Chardonnay grapevines was monitored by stem/leaf water potential in two plots with different soil properties. The singularity of water variation in shallow layers was attributed to soil characteristics affecting soil evaporation, grapevine root density and cover crop uptake. Significant analysis concluded that soil properties is the main factor for plant water content differences between plants over short distances. Topography was another important factor to explain the spatial variability. Kitchen et al. (2003) has established that topography is a measure to study availability of water in the soil. In accordance with this concept, Van Leeuwen et al. (2004) concluded that the intensity of vine water deficit stress depends on the
  • 18. 16 water-holding capacity of the soil. In our study, plants with higher SWP were more concentrated at the top central area of the block. The top central area is characterized by a steeper slope than the remaining of the block. Plants located in areas with steeper inclination registered less water content than the remaining plants. This result could be associated with a lower penetration of water in slopes due to run-off and soil texture, therefore, a lower level of available water in the soil. In accordance with these results, Koundouras et al. (2006) investigated the influence of site (flood plain, hill slope and plateau) on grape and wine composition from uniformly viticultural conditions of V. Vinifera L.cv. Agiorgitiko vines. Plant water deficit became significantly higher during grape maturation to grapevines planted on the hill slope plot, suggesting that plant water uptake is dependent on soil capacity to retain and supply water to grapevines. When combining these two factors soil water availability is the major factor of spatial variability of plant water status. In this sense, Ledderhof et al. (2017) in an attempt to assess the relationship between vine water status and yield and berry composition found that the amount of clay in the soil texture composition is the main driver of variability. This idea is supported by our classification, where Class 1 presented an average value of clay content 5 times higher than Class 2 and 3. 4.3. Classification based on plant water status In our experiment the target plants were grouped into 3 classes according to level, period, and duration of the waters stress using the veraison period as benchmark. Veraison is the beginning of berry ripening and it is in this stage that berries start a variety of physical and chemical changes. According to several authors (Gambetta et al. 2020; Ferrandino & Lovisolo 2014) sugar accumulation and abscisic acid (ABA) concentration are responsible for berry composition modifications during this period. The resultant immediate effect of the sugar and ABA accumulation in the berry is, first the change of skin colour, and then, the softening of the berry and resume of berry growth. Other changes during veraison include increase of berry volume, biosynthesis of skin and pulp compounds, an increase of pH and a decrease of acidity. Since the increase of berry size during ripening is mainly related to the amount of water accumulated in the mesocarp vacuoles it has been suggested that water is the most important component for berry maturation. Until veraison the xylem flow is the main transporter of water to berries, however at veraison phloem flow becomes the only source of water to grape berries (Keller 2015). Because of the different effects of water deficit on berry development around veraison, it was hypothesised that veraison is a critical period on the impact of water status on berry development. The proposed classes categorize target vines under different water conditions according the SWP values registered during the season (Table 4).
  • 19. 17 Vine water status can be monitored by means of SWP. The level of stress can be classified according to the water potential measured on leaves. A significant study on the subject was presented by Leeuwen et al., (2009). In an investigation into vine water stress impact on the overall vintage quality, average thresholds for plant water status have been proposed: no water deficit < 6 bar, weak water deficit 6 to 9 bar, moderate to weak water deficit 9 to 11 bar, moderate to severe water deficit 11 to 14 bar, severe water deficit > 14 bar. In another major study Gambetta et al. (2020) determined that, in irrigated and non-irrigated vineyards, SWP higher than 15 bar lead to leaf shedding and risk of vine mortality due to cavitation or turgor loss. Furthermore, the SWP in viticultural management for premium wine is normally targeted between 12 to 14 bar. In our study the proposed classes were determined considering the level of water stress and the evolution of plant water content from Veraison onwards. Target plants with a SWP below 9 Bars at veraison were categorized as Class 1. Plants with a SWP between 9 and 12 were classified as Class 2 and vines with SWP higher that 12 Bar were classified as Class 3. Additionally, the level of stress of the plants in post-veraison until harvest was also considered. Acevedo-Opazo et al. (2010) found that in an experiment of cv. Cabernet Sauvignon under three different RDI events, the most effective irrigation treatment optimizing grape quality was the event that restricted SWP to values bellow 12 Bar. Even though before veraison there is no evidence of stressed plants, a steady decrease of plant water content is already perceptible. Furthermore, target plants rapidly reached a medium level of water stress at veraison, until achieving the maximum stress four weeks later at harvest. The reason for this rapid water stress development in the targeted plants is generally related with the immediate increase of temperature, the depletion of soil moisture and the subsequent plant reaction, opening the stomata and increasing evapotranspiration (Choné et al. 2001; Phogat et al. 2017). The temporal and spatial variability is more pronounced between veraison and harvest. However, the spatial variability in classes can be explained in part by the retention of water in the soil, due to the position of target plants in the block, the exposition of plants to sun and wind. When target plants are located in a higher inclination receive more sun exposition and are affected by stronger wind, this translates into the plants developing a higher stress condition than plants located in a flat area of the block, with low sun exposition and less wind. These results reflect those of Brillante et al. (2017) who also found that despite vineyards being irrigated, spatial variability in water content still exists and vineyard irrigation management should be executed differently for the different SWP classes of the block.
  • 20. 18 Temporal variability in grapevine water content has been well documented (Zúñiga et al. 2018; Chaves et al. 2007; Acevedo-Opazo, et al. 2010; Brillante et al. 2018). The evolution of plant water content along the season is a result of soil, weather, and plant management factors. However, the plant water content pattern is that plants progressively contain less water until harvest (Chaves et al. 2007) and that has a determinant impact on grape composition (Acevedo-Opazo et al. 2010). The evaluation of plant water content during the period of water deficit in post-veraison is a complex task. It involves the analysis of changing weather temporal factors and spatial pedological factors. Our water stress classes were defined following the logic behind the concept of water stress integral proposed by Myers (1988) where a cumulative evolution of water potential along the water deficit period is considered. 4.4. Impact of water stress on Yield, grape juice composition and wine phenolics It has been proved that water stress has an impact in the physiology of the vines. In this sense, irrigation techniques have been implemented and analysed to modulate vines response under specific water stress conditions. Among these techniques regulated deficit irrigation (RDI) is the most followed by producers and researchers. As a common rule, grape producers apply water deficit in grapes in order to improve grape composition and concentration. However, water limitation to grapevines at the end of the growing season has different effects in grape quality depending on application timing. Plant water balance is markedly different before and after veraison. Before, berries are more sensitive to alterations in plant water content (Gambetta et al. 2020). In this phase plant water deficit affects the berry capacity of cell division and expansion, and therefore, berry size and structure. (Bondada & Shutthanandan 2012). After veraison, the cuticular berry transpiration decreases progressively and the sugar transport and accumulation increase rapidly, and the berry is more resistant to shrivelling (Gambetta et al. 2020). Acevedo-Opazo et al. (2010) demonstrated that the application of water restrictions in the period between veraison and harvest has no significant effect on yield. Therefore, grape berry is less sensitive to plant water deficit in post-Veraison (Kennedy et al. 2002). Our results follow an opposite tendency. Plants which reported lower levels of water stress (Class 1 and 2) in post-veraison, reported significantly higher yield values (av. 5,46 kg/plant) Conversely, plants from Class 3 with higher water stress reported a lower yield (3.56 kg/plant). This finding suggests a threshold of plant water stress that promotes yield component in grapevines. This is a strong indication that plant water content in
  • 21. 19 post-veraison is a determinant factor for yield. Phogat et al. (2017) proposed that yield and average number of clusters increase with water application. This study has been unable to demonstrate a difference in number of clusters between the classes. However, the average plants with a critical water deficit in Class 3 registered clusters with a lower yield (103g/cluster) in comparison to plants in Class 1 and 2 (av. 136g/cluster) with a moderate water deficit in post-veraison. According to these data, we can infer that plants with a higher water content in the period of post-veraison result in a higher yield per plant. As noted by Lovisolo et al. (2010) yield and berry quality depend strongly on vine adaptability to drought. The level of drought recovery in grapevines is related with the cultivar and environmental conditions affecting plant water stress. Optimum production of wines is dependent on the grape composition at harvest. As a standard in wineries, measurement of grape quality parameters is done by means of visual and sensorial evaluation of the grapes and the analysis of total soluble solids (TSS) and acidity (Guidetti 2010). High sugar, lower acid, rich colour and full varietal fruitiness are criteria for harvesting the ripe fruit at desirable ripeness (Boulton et al., 1999). However, depending on the style and level of quality intended to be achieved there are several potential harvest dates. To date there has been little agreement about the effects of water deficit in berry juice quality parameters (pH, TA and sugar content). Some authors suggest that plant water status derived from deficit irrigation has a substantial impact on soluble solids of grape composition (Yu et al. 2020; Esteban et al. 2001). Other have found no evidence of significant water deficit irrigation effect on grape soluble solids composition of pH, TA (Acevedo-Opazo et al. 2010) and sugar accumulation (Chaves et al. 2007). In our study the values of berry juice quality parameters analysed at harvest demonstrated no significant differences between classes for pH, however, a small decrease of TA was registered in Class 3. Van Leeuwen et al. (2009) argues that mild conditions of water deficit are beneficial to grape quality, decreasing malic acid and increasing sugar, anthocyanins, and tannins of grape content. In our study the sugar content at harvest was well correlated with the level of plant water stress. Grape berry sugar content increases with the level of stress between classes. This augment in sugar can be related to the decrease of water content in the berry, therefore berry size, which leads to the increase of sugar concentration in the berry. The chemical composition of grape juice and wine correlation analysis illustrated a strong positive relationship (+0.9) between anthocyanins, tannins, and sugar. The analysis demonstrated that anthocyanins and tannins in wine were highly correlated with the sugar concentrations indicating that sugar may be useful as an indicator of wine phenolic content. The impact of water deficit in the
  • 22. 20 increase of Brix° has been reported by Roby et al., (2004). Brix° values were higher for water stressed plants in Class 3, but this was already expected since sugar is a component of Brix°. 4.5. Wine phenolics The phenolic content and composition of red grapes are the main attributes to wine sensory properties and wine colour. Anthocyanins are phenolic compounds that impart red colour to wine and tannins contribute to the mouth feel properties (Aleixandre-Tudo et al. 2018). Although extensive research has been carried out on flavonoid composition of wines, few studies have investigated the relationship between plant water deficit and flavonoid composition of wines. A study conducted by Downey et al. (2006) suggests that plant water status is a common denominator for flavonoids in wine. In our study a positive relationship was noticed between the increase of water stress in plants of Class 3 and the increase of anthocyanins content of fermented wines. Even though some authors argue that wine tannin concentrations can only be altered with higher values of water deficits (Yu et al. 2020), our experiment demonstrated that plant water deficit is a strong driver for tannin concentration in fermented wines and for anthocyanin concentration in wines. The experiment shows that tannin and anthocyanin concentration 27% and 23%, respectively between low water deficit Class 1 and 2 and high-water deficit in Class 3. This finding was also reported by Kennedy et al., (2002) who reported an increase of tannin concentration in response to water deficit. In our study, total phenols content in wine was 24% lower in Class 1. A similar result was presented by Nadal & Arola (1995) who reported a decrease of 22% of total phenols in wines produced from irrigated vines. Proanthocyanidins (tannins) are synthesised before anthesis through veraison and anthocyanin and sugar accumulation, begins at veraison until harvest (Ollé et al. 2011). In our experiment the values of tannins, anthocyanins and sugar (brix°) are higher in wines from Class 3, suggesting that temperature had a high influence on the synthesis of these compounds during grape development. This observation may support the hypothesis that the average temperatures in pre- and post-veraison periods were very high, mainly affecting the plants with lower soil water content located in the steepest areas of the bock. This suggest that plant water deficit in this period induces the accumulation of B-ring trihydroxylated anthocyanins through the differential regulation of flavonoid 3’-hydroxylase and flavonoid 3’,5’-hydroxylase (Castellarin et al. 2007). Here the influence of low water status before veraison impacts nonacylated anthocyanins (cyanidin and peonidin), whereas in post-veraison it mainly affects cyanidin derivatives (p-coumaroyl substitutions) (Ollé et al. 2011).
  • 23. 21 There is still uncertainty, however, whether plant water deficit has an impact on the increase wine phenolic concentration because of alterations occurring through grape biosynthesis or due to the enhanced concentration. It is also uncertain how this change will influence phenolic extraction during fermentation (Casassa et al. 2015). Ojeda et al. (2002) confirmed two types of berry responses to water deficit: an indirect and always positive effect on the concentration of phenolic compounds due to berry size reduction, and a direct action on biosynthesis that can be positive or negative, depending on the type of phenolic compound, period of application, and severity of the water deficit (Kennedy et al. 2002; Ojeda et al. 2002). Other than a direct stimulation of biosynthesis, water deficits could also increase the concentrations of skin tannins and anthocyanins due to the differential growth responses of the skin and inner mesocarp tissue to water deficits, resulting in greater skin mass and relative skin mass per berry, and therefore greater amounts of skin-localised solutes (Roby et al. 2004). Further studies, which take these variables into account, will need to be undertaken. 5. Conclusion The present study highlights the complex response of wine phenolic content (anthocyanins and tannins) and grape parameters (sugar content, TA, MA and yield) to the temporal and spatial variability of plant water status in a commercial block induced by natural conditions of topography and soil characteristics. In this study all target plants were treated with the same viticultural management practices and only the natural effects were accountable to the spatial variability. Plant water status variability occurred along the season, suggesting soil texture and topography as key factors for this effect. Plant water status influenced changes in the concentration of phenolic compounds (anthocyanins and tannins) and grape parameters particularly yield, and sugar content. The results of this study may help to understand and quantify how spatial variability is naturally distributed in a vineyard and ultimately impacts the style of wine that is possible to produce from a section or the whole block. Further studies at intra-block scale are needed to understand the implications of plant water status in the phenolic composition of wines focusing on the specific compounds that can play an important role in the wine quality as well as the drivers associated with the variability. References Acevedo-Opazo, C., Ortega-Farias, S., et al., 2010. Effects of grapevine (Vitis vinifera L.) water status on water consumption, vegetative growth and grape quality: An irrigation scheduling application to achieve regulated deficit irrigation Agric. Water Manag. 97, 7, 956–964.
  • 24. 22 Acevedo-Opazo, C., Tisseyre, B., et al., 2010. Spatial extrapolation of the vine (Vitis vinifera L.) water status: A first step towards a spatial prediction model Irrig. Sci. 28, 2, 143–155. Adams, D.O., 2006. Phenolics and ripening in grape berries Am. J. Enol. Vitic. 57, 3, 249–256. Aleixandre-Tudo, J.L., Buica, A., et al., 2017. Spectrophotometric Analysis of Phenolic Compounds in Grapes and Wines J. Agric. Food Chem. 65, 20, 4009–4026. Aleixandre-Tudo, J.L., Nieuwoudt, H., et al., 2019. Towards on-line monitoring of phenolic content in red wine grapes: A feasibility study Food Chem. 270, July 2018, 322–331. Arnó, J., Martínez Casasnovas, J.A., et al., 2009. Review. Precision viticulture. Research topics, challenges and opportunities in site-specific vineyard management Spanish J. Agric. Res. 7, 4, 779. Bindon, K., Myburgh, P., et al., 2011. Response of Grape and Wine Phenolic Composition in Vitis vinifera L . cv . Merlot to Variation in Grapevine Water Status 32, 1, 71–88. Blancquaert, E.H., Oberholster, A., et al., 2019. Effects of abiotic factors on phenolic compounds in the grape berry - A review South African J. Enol. Vitic. 40, 1. Bondada, B. & Shutthanandan, J., 2012. Understanding Differential Responses of Grapevine (Vitis vinifera L.) Leaf and Fruit to Water Stress and Recovery Following Re-Watering Am. J. Plant Sci. 03, 09, 1232– 1240. Boulton, R.B., Singleton, V.L., et al., 1999. Principles and Practices of Winemaking. Vol. 97. Braidot, E., Zancani, M., et al., 2008. Transport and accumulation of flavonoids in grapevine (Vitis vinifera L.) Plant Signal. Behav. 2324, 9. Brillante, L., Bois, B., et al., 2016. Variations in soil-water use by grapevine according to plant water status and soil physical-chemical characteristics-A 3D spatio-temporal analysis Eur. J. Agron. 77, 122–135. Brillante, L., Martínez-Luscher, J., et al., 2017. Assessing Spatial Variability of Grape Skin Flavonoids at the Vineyard Scale Based on Plant Water Status Mapping J. Agric. Food Chem. 65, 26, 5255–5265. Brillante, L., Martínez-Lüscher, J., et al., 2018. Applied water and mechanical canopy management affect berry and wine phenolic and aroma composition of grapevine (Vitis vinifera L., cv. Syrah) in Central California Sci. Hortic. (Amsterdam). 227, June 2017, 261–271. Casassa, L.F., Keller, M., et al., 2015. Regulated deficit irrigation alters anthocyanins, tannins and sensory properties of Cabernet Sauvignon grapes and wines Molecules 20, 5, 7820–7844. Castellarin, S.D., Matthews, M.A., et al., 2007. Water deficits accelerate ripening and induce changes in gene expression regulating flavonoid biosynthesis in grape berries Planta 227, 1, 101–112. Chaves, M.M., Santos, T.P., et al., 2007. Deficit irrigation in grapevine improves water-use efficiency while controlling vigour and production quality Ann. Appl. Biol. 150, 2, 237–252. Choné, X., Van Leeuwen, C., et al., 2001. Stem water potential is a sensitive indicator of grapevine water status Ann. Bot. 87, 4, 477–483. Cliff, M.A., King, M.C., et al., 2007. Anthocyanin, phenolic composition, colour measurement and sensory analysis of BC commercial red wines Food Res. Int. 40, 1, 92–100. Deloire, A., Carbonneau, A., et al., 2004. Vine and water a short review In: J. Int. des Sci. la Vigne du Vin. Vol. 38 1–13. Downey, M.O., Dokoozlian, N.K., et al., 2006. Cultural Practice and Environmental Impacts on the Flavonoid Composition of Grapes and Wine: A Review of Recent Research Am. J. Enol. Vitic. 3, 257–268. Esteban, M.A., Villanueva, M.J., et al., 2001. Effect of irrigation on changes in the anthocyanin composition of the skin of cv Tempranillo (Vitis vinifera L) grape berries during ripening J. Sci. Food Agric. 81, 4, 409–420. Ferrandino, A. & Lovisolo, C., 2014. Abiotic stress effects on grapevine (Vitis vinifera L.): Focus on abscisic acid-mediated consequences on secondary metabolism and berry quality Environ. Exp. Bot. 103, 138– 147. Gambetta, G.A., Herrera, J.C., et al., 2020. The physiology of drought stress in grapevine: towards an integrative definition of drought tolerance J. Exp. Bot. 71, 16, 4658–4676. Gaudillère JP, van Leeuwen C, T.O., 2000. The assessment of vine water uptake conditions by 13c/12c discrimination in grape sugar J. Int. des Sci. la Vigne du Vin 34, 4, 169–176. Guidoni, S., Ferrandino, A., et al., 2008. Effects of seasonal and agronomical practices on skin anthocyanin profile of Nebbiolo grapes Am. J. Enol. Vitic. 59, 1, 22–29. Hardie, W.J. & Considine, J. a, 1976. Response of Grapes To Water-Deficit Stress in Particular Stages of Development Am. J. Enol. Vitic. 27, 2, 55–61. Jose Luis Aleixandre-Tudo, 2018. Understanding phenolic compounds in red winemaking. Stellenbosch university. Keller, M., 2015. The Science of Grapevines: Anatomy and Physiology: Second Edition. Vol. 1. Kennedy, J.A., Matthews, M.A., et al., 2002. Effect of maturity and vine water status on grape skin and wine flavonoids Am. J. Enol. Vitic. 53, 4, 268–274. Kennedy, J.A., Saucier, C., et al., 2006. Grape and wine phenolics: History and perspective Am. J. Enol. Vitic. 57, 3, 239–248.
  • 25. 23 King, W.B., 1983. Geomorphology of the cape peninsula University of Cape Town. Kitchen, N.R., Drummond, S.T., et al., 2003. Soil electrical conductivity and topography related to yield for three contrasting soil-crop systems Agron. J. 95, 3, 483–495. Kontoudakis, N., Esteruelas, M., et al., 2010. Influence of the heterogeneity of grape phenolic maturity on wine composition and quality Elsevier 124, 767–774. Koundouras, S., Marinos, V., et al., 2006. Influence of vineyard location and vine water status on fruit maturation of nonirrigated cv. Agiorgitiko (Vitis vinifera L.). Effects on wine phenolic and aroma components J. Agric. Food Chem. 54, 14, 5077–5086. Ledderhof, D., Reynolds, A.G., et al., 2017. Spatial variability in Ontario pinot noir vineyards: Use of geomatics and implications for precision viticulture Am. J. Enol. Vitic. 68, 2, 151–168. Van Leeuwen, C., Friant, P., et al., 2004. Influence of climate, soil, and cultivar on terroir Am. J. Enol. Vitic. 55, 3, 207–217. Leeuwen, C. Van, Tregoat, O., et al., 2009. Vine water status is a key factor in grape ripening and vintage quality for red Bordeaux wine. How can it be assessed for vineyard management purposes? J. Int. des Sci. la Vigne du Vin 43, 3, 121–134. Lovisolo, C., Perrone, I., et al., 2010. Drought-induced changes in development and function of grapevine (Vitis spp.) organs and in their hydraulic and non-hydraulic interactions at the whole-plant level: A physiological and molecular update Funct. Plant Biol. 37, 2, 98–116. McCutchan, H. & Shackel, K.A., 2019. Stem-water Potential as a Sensitive Indicator of Water Stress in Prune Trees (Prunus domestica L. cv. French) J. Am. Soc. Hortic. Sci. 117, 4, 607–611. Monagas, M., Gómez-Cordovés, C., et al., 2006. Evolution of the phenolic content of red wines from Vitis vinifera L. during ageing in bottle Food Chem. 95, 3, 405–412. Morgenthal, A., 2004. The wine lands of South Africa - In-depth information & detailed topographical maps. (3rd ed.). Wines of South Africa. Nadal, M. & Arola, L., 1995. Effects of limited irrigation on the composition of must and wine of Cabernet Sauvignon under semi-arid conditions Vitis 34, 3, 151–154. Nel, A.P., 2018. Tannins and anthocyanins: From their origin to wine analysis - A review South African J. Enol. Vitic. 39, 1, 1–20. Ojeda, H., Andary, C., et al., 2002. Influence of pre- and postveraison water deficit on synthesis and concentration of skin phenolic compounds during berry growth of Vitis vinifera cv. Shiraz Am. J. Enol. Vitic. 53, 4, 261–267. Ollé, D., Guiraud, J.L., et al., 2011. Effect of pre- and post-veraison water deficit on proanthocyanidin and anthocyanin accumulation during Shiraz berry development Aust. J. Grape Wine Res. 17, 1, 90–100. Peel, M.C., Finlayson, B.L., et al., 2007. Updated world map of the Köppen-Geiger climate classification Hydrol. Earth Syst. Sci. 11, 5, 1633–1644. Phogat, V., Skewes, M.A., et al., 2017. Evaluation of crop coefficients, water productivity, and water balance components for wine grapes irrigated at different deficit levels by a sub-surface drip Agric. Water Manag. 180, 22–34. R. Guidetti, R. Beghi, L.B., 2010. Evaluation of grape quality parameters by a simple vis/nir system Trans. ASABE 53, 2, 477–484. Roby, G., Harbertson, J.F., et al., 2004. Berry size and vine water deficits as factors in winegrape composition: Anthocyanins and tannins Aust. J. Grape Wine Res. 10, 2, 100–107. Rogiers, S.Y., Greer, D.H., et al., 2012. Stomatal response of an anisohydric grapevine cultivar to evaporative demand, available soil moisture and abscisic acid Tree Physiol. 32, 3, 249–261. Santesteban, L.G., 2019. Precision viticulture and advanced analytics. A short review Food Chem. 279, April 2018, 58–62. SAWIS, 2014. Production areas defined in terms of the wine of origin scheme 1–4. Teixeira, A., Eiras-Dias, J., et al., 2013. Berry phenolics of grapevine under challenging environments Int. J. Mol. Sci. 14, 9, 18711–18739. Vilanova, M., Santalla, M., et al., 2009. Environmental and genetic variation of phenolic compounds in grapes (vitis vinifera) from northwest Spain J. Agric. Sci. 147, 6, 683–697. Williams, L.E., 2012. Leaf water potentials of sunlit and/or shaded grapevine leaves are sensitive alternatives to stem water potential J. Int. des Sci. la Vigne du Vin 46, 3, 207–219. Yu, R., Brillante, L., et al., 2020. Spatial Variability of Soil and Plant Water Status and Their Cascading Effects on Grapevine Physiology Are Linked to Berry and Wine Chemistry Front. Plant Sci. 11, June. Zhao, J., Zhang, W., et al., 2010. Improved K-Means cluster algorithm in telecommunications enterprises customer segmentation Proc. 2010 IEEE Int. Conf. Inf. Theory Inf. Secur. ICITIS 2010 167–169. Zúñiga, M., Ortega-Farías, S., et al., 2018. Effects of three irrigation strategies on gas exchange relationships, plant water status, yield components and water productivity on grafted carménère grapevines Front. Plant Sci. 9, July 1–13.
  • 26. 24 Myers BJ 1988 ´Water stress integral. A link between short-term stress and long-term growth. Tree Physiol 4: 315–323. R Core Team (2020). R: A language and environment for statistical computing. R Foundation for Statistical Computing, Vienna, Austria. URL http://www.R-project.org/ Rouse, J.W., Jr.; Haas, R.H.; Schell, J.A.; Deering, D.W. (1974). Monitoring Vegetation Systems in the Great Plains with ERTS. NASA Spec. Publ. 351, 309–317.