Outlook for Week of August 7, 2023
•
0 likes•199 views

Free weekly newsletter with outlook and brief comments for world stock markets. Weekly reversal levels for stocks, gold, crypto currencies and forex. This method was designed to keep you on the right side of the market most of the time, letting the winners run while keeping losses small.

Recommended
Recommended
More Related Content
More from LunaticTrader
More from LunaticTrader (17)
Recently uploaded
Recently uploaded (20)
Outlook for Week of August 7, 2023
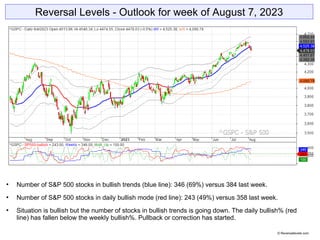
- 1. Reversal Levels - Outlook for week of August 7, 2023 Number of S&P 500 stocks in bullish trends (blue line): 346 (69%) versus 384 last week. Number of S&P 500 stocks in daily bullish mode (red line): 243 (49%) versus 358 last week. Situation is bullish but the number of stocks in bullish trends is going down. The daily bullish% (red line) has fallen below the weekly bullish%. Pullback or correction has started. © Reversallevels.com
- 2. ELC: up | BMO: down | Blue snake: up | Repellor: up BMO has peaked in the +2 peak zone and is now coming down. This means a correction or significant pause has started. © Reversallevels.com S&P 500 Weekly chart
- 3. SwX is green - bullish. Weekly MoM is going up. The bull market is on as long as that red channel stays on. © Reversallevels.com S&P 500 - Weekly
- 4. SwX is green – bullish, but slowing down. Weekly MoM is going up. Weekly MoM is inching up, but not gaining much traction so far. © Reversallevels.com Gold - Weekly
- 5. SwX is green - bullish. Weekly MoM is going down. The $30k resistance level was not overcome. Still weak © Reversallevels.com Bitcoin - Weekly
- 6. Sell signal for Dow Utilities. Partial profits signal for Turkey BIST100. Argentina Merval is our current best performer. It is up 326% since its Buy signal 56 weeks ago. World markets © Reversallevels.com
- 7. Sell signal for AUDUSD. Partial profits signal for USDRUB. Bullish divergence for USDBRL. Note for daytraders or swing traders: if you do your trading in the direction of the weekly trend you are likely to do well in the long run. So, try to buy the pullbacks in currencies pairs that are in bullish trends and sell the rallies during bearish trends. Forex & Crypto © Reversallevels.com
- 8. On Twitter: https://twitter.com/lunatictrader1 On Stocktwits: https://stocktwits.com/LunaticTrader Blog 1: Reversallevels.com Blog 2: LunaticTrader.com For daily comments and questions you can find us here: © Reversallevels.com Disclaimer Investing in stocks, forex or commodities is risky. No guarantee can be given that the opinions or predictions given in this presentation will be correct. Reversallevels.com cannot in any way be responsible for eventual losses you may incur if you trade based on the given information. Simulated trading programs in general are designed with the benefit of hindsight. No representation is being made that any account will or is likely to achieve profits or losses similar to those shown. Trade at your own risk and responsibility. Sign up for our subscription service Daily reversal levels for over 3000 stocks and ETFs have been available since 2015: 1 Month ($22) 6 Months ($110) 1 Year ($199) Includes instructions and strategies for using reversal levels and the MoM indicator in your own trading, example trades and mentoring. This is an honest method with limited risk, not a get rich quick formula. Give it a try.