The State of Employment Sector in the Nigerian Economy
Zambia's Labor Market with Cross-National Comparisons
1. 1
Background on Zambia’s Labor Market with Cross-National Comparisons
Alex Chester, Thao Dang, Amanda Edgell, Matthew Harber, Dace Mahanay, Matthew Messer, & Luis Ramos
List of tables
Table 1: Characteristics of Zambia and Comparison Countries (CIA World Factbook, 2011)
Table 2: Starting a Business
Table 3: Dealing with Construction Permits
Table 4: Registering Property
Table 5: Getting Credit
Table 6: Paying Taxes
Table 7: Trading Across Borders
Table 8: Enforcing Contracts
Table 9: Ease of Doing Business
Table 10: Difficulty of Hiring
Table 11.1: Rigidity of Hours (Restrictions on hours, working days, and night work)
Table 11.2: Rigidity of Hours (Paid annual leave)
Table 12: Difficulty of Redundancy
Table 13: Redundancy Cost
List of Figures
Figure 1: GDP Growth Rates of Selected African Countries 2000-2009
Figure 2: GDP (Value Added, %) by Sector of Selected Developing Countries, 2009
Figure 3: Labor Participation Rate (population ages 15+) in Selected Developing Countries, 2008
Figure 4: Labor Productivity of Selected Developing Countries, 2008
Figure 5: Cost (% of income per capita) to Construct a Business
Figure 6: Cost of Exports and Imports in Selected Countries
2. 2
Zambia presents a typical Sub-Saharan African (SSA) labor market dominated by the agriculture sector
and a high unemployment rate. Zambia’s agricultural employment accounts for 73% of the total labor force
compared to an average of 60% across the other SSA countries (ILO 2011). Industrial sector employment
makes up about 11% of the SSA population but only 9% in Zambia (ILO 2011; LFSR 2010).1
The agriculture
sector, even though large in terms of labor force, only accounts for around 20% of Gross Domestic Product
(GDP), while the less populated industry and service sectors account for 34% and 47%, respectively.
In 2008, prior to the global financial crisis, the Labor Force Survey Report (LFSR) shows that Zambia’s
unemployment was 15%. This was expected to have risen slightly during the crisis (LSB 2010). Zambia’s Labor
Statistics Branch (2010) reports the unemployment rate is 13% for men and 15% for women. Urban areas have
an unemployment rate of 36%, while the rural areas are below average at 6% (LSB 2010).
Generally, SSA is cited as facing “daunting decent work challenges,” and Zambia is no exception (ILO
2011). These major challenges include high rates of vulnerable employment and significant differences in labor
opportunities for men and women (ILO 2011). Vulnerable employment refers to own-account workers (self-
employed and without paid employees) and unpaid family workers (United Nations 2008). These workers are
classified as “vulnerable” because their employment lacks the institutional structures to provide insurance at
the time of shocks. Slightly more than 80% of Zambian workers can be classified as working in vulnerable
employment (LSB 2010).
This study looks at Zambia’s diverse labor market within the context of six major components:
informality, urban-rural divide and migration, international emigration, gender disparity, youth employment,
and health. First, Zambia’s workforce is increasingly informal. 90% of workers in Zambia are in the informal
sector (LSB 2010). As a result, the government is losing a vital source of tax income, firms are unable to access
much-needed credit, and many workers can only find menial labor for low and often unfair wages.
1
The LFSR disaggregates the industrial sector into mining and quarrying (1.8%); manufacturing (3.2%); electricity, gas, and
water (0.3%); construction (1.7%); and transportation and storage (1.9%). The 8.9% was derived from adding these
percentages together.
3. 3
Second, there is a distinct urban-rural divide. The urban economy is primarily composed of mining and
manufacturing in the formal sector and wholesale and retail trade in the informal sector. All of these
occupations yield higher average earnings than those in agriculture and other rural occupations. Furthermore,
urban labor unions (particularly in mining) secure above-market wages, widening the wage gap even further.
The opportunities for entrepreneurship in urban areas also far outpace those in rural areas. The large wage
differentials lead to a moderate flow of labor from the rural villages to the urban centers. Third, international
emigration appears to have some impact on the economy and labor market in the form of “brain drain”,
whereby skilled labor is leaving Zambia to neighboring countries and elsewhere in search of employment
without returning.
Fourth, women in Zambia, like in many SSA countries, experience lower wages and fewer employment
opportunities than men. Females without any education earn only 65% of their male counterparts, while
women who reach the tertiary level of education earn 95% of their male counterparts (Burger, Burger, and van
der Berg 2004). However, most women do not study beyond the primary level. Female access to financial and
legal institutions is also restricted resulting in a lack of resources for female entrepreneurs. As a result, there
are a disproportionate number of women employed in the informal sector.
Fifth, Zambia has an expanding youth labor force that is increasingly educated but lacks formal
employment opportunities. Youths suffer from comparatively high unemployment and underemployment, and
are predominantly working in agriculture and other informal sectors. Even with high unemployment, youths
are dropping out of school to pursue economic opportunities. Many female youths engage in commercial sex
work as a primary or supplementary form of income. The sex industry has contributed to the spread of
HIV/AIDS and other sexually transmitted infections (STIs) which have hurt labor productivity in Zambia.
In fact, Zambia has one of the highest prevalence of HIV/AIDS in the world along with alarmingly high
rates of tuberculosis and malaria. These severe health issues have far reaching effects. All three diseases can
greatly affect labor productivity and general economic growth.
4. 4
In addition to these six components, it is important to view Zambia within the developing country
landscape. This study utilizes data from the CIA World Factbook 2011 and development, labor, and Doing
Business 2011 indicators from the World Bank to compare how Zambia ranks to eight similar developing
countries. These countries – Bangladesh, Botswana, Burkina Faso, Lao PDR, Malawi, Paraguay, Uganda, and
Zimbabwe – were chosen by criteria based on similar demographics and geographic location as Zambia.
The remainder of this paper is organized into two sections. The first section will outline the current
labor market environment in Zambia using the above described characteristics. The second section presents
key findings of the comparative country study.
Key Characteristics of Zambia’s Labor Market
Zambia’s Informal Sector
Zambia’s labor market is dominated by informality, as defined by tax-based or employee-based
characteristics. At the firm level, Gatti and Honorati (2008) define informality as firms that are either partially
or fully noncompliant with a country’s tax code. They acknowledge that there are other operational definitions
for informality, and that the informal sector includes workers who can be independent of a firm’s status. They
argue that when firms operate outside the tax system, they contribute towards many of the other common
definitions of informality.
Gatti and Honorati’s (2008) research has indicated that the informal sector is a semi-functioning
economic sector, not too far removed from the formal sector, with the exception that it does not pay taxes.
Barriers to entry in the formal sector include burdensome regulations, government corruption, and high
registration fees. Furthermore, Amin’s (2009) findings suggest that the high costs of having to lease office
space are prohibitive. These costs of operations can all affect firms’ profits. If firm owners foresee a low
probability of being caught not paying taxes, they will often stay in the informal sector to make higher profits.
While informality is good for firms in the short-run, it can have negative effects on both firms and
overall economic development in the long-run. Gatti and Honorati (2008) found that a lack of tax compliance
barred firms from accessing credit. Informal firms usually cannot access formal credit because they are in
5. 5
violation of the country’s tax code. Gatti and Honorati’s regression results show that a one standard deviation
increase in formality yields a 2% increase in the probability that a firm can access formal credit. This is
especially important for larger firms, as they are often too big for informal lenders to accommodate their
financing demands. Easy access to credit allows firms to avoid the transaction costs of obtaining financing from
informal sources and allows them to invest in higher-return and longer-term projects. Furthermore, Gatti and
Honorati cite evidence that access to credit positively correlates with total factor productivity. More
productive workers coupled with higher returns on investment lead to higher profits and higher per-capita
income. They conclude that improving tax compliance is essential for better-functioning credit markets and
more productive firms. Without access to sufficient credit, firms’ productivity and growth will slow.
Improving tax compliance will also benefit Zambia’s economic development. Zambia’s Labor Statistics
Branch (LSB 2010) finds that informality has seriously hampered tax collection. Without sufficient revenues,
the Zambian government cannot invest in needed development projects like infrastructure and finance reform.
In addition to Gatti and Honorati’s tax-based definition, others have defined formality on provisions for
employees. According to the LSB (2010), “Informal sector employment is defined as employment where the
employed persons were not entitled to paid annual leave, social security, pension and/or gratuity and worked
in an establishment employing less than five persons.” This definition is less restrictive, and many more
workers and employers can fit into Zambia’s informal sector including some that are tax-compliant and
government-registered.
The informal economy is part of the larger non-observed economy along with illegal and underground
activities (LSB 2010). Government and industrial surveys usually omit these sub-economies from their labor
market studies, making it difficult to decipher what, or who, to look for when describing the informal sector.
The LSB (2010) provides a detailed list of the people engaged in work in the informal sector. 2
This list identifies
2
According to the LSB (2010), informal workers and employers are: (1) Own-account workers and employers who
have their own informal sector enterprises, usually characterized by lack of registration with national authority,
contributions to social security schemes, and entitlement to annual paid and sick leave by workers. (2) Contributing family
workers, irrespective of whether they work in the formal or informal sector enterprises. (3) Employees who have informal
jobs, whether employed in the formal sector enterprises, informal sector enterprises, or as paid domestic workers by
6. 6
Zambia’s informal workers by the features of their employment contracts, but neglects to include social
descriptors.
Amin (2009) found that across Africa, much of the informal sector has been populated by individuals
who could not find employment in the formal sector. This implies that the informal sector is a home for all
displaced wage seekers and serves as an employment level indicator in the formal economy. The LSB (2010)
also found that high unemployment in the formal sector yields high employment rates in the informal sector.
The LSB (2010) reported that the informal sector is populated by low-educated workers, but Amin
(2009) suspects that the informal sector also includes many educated entrepreneurs. He sees reason to
believe that educated workers who cannot find work in the formal sector would be wise to keep their skills and
knowledge fresh by finding employment in the informal sector.
Roughly 4.7 million (90%) of employed workers are in the informal sector (LSB 2010). This figure is 96%
in rural areas and 74% in urban areas. In urban areas, Tranberg-Hansen (2010) argues that one of the reasons
for massive growth in the informal sector was the change from a command economy to a free-market regime
in 1991. As the kwacha was allowed to float and imports became less restricted, a huge influx of workers
moved in to become informal traders. Furthermore, high unemployment rates have forced more and more
Zambians to take up work in the informal sector, including the well-educated. Others who could not find work
in urban centers returned to the rural areas to engage in informal agriculture.
Additionally, workers in the Zambian informal sector are chronically underemployed and paid
substantially less (LSB 2010). Among occupation groups, agriculture employed 99% of its workers in the
informal sector and 79% of all Zambia’s informal workers (LSB 2010). Meanwhile, professional and technical
services employed 79% of its workers in the formal sector. At the industry level, the LSB (2010) again found
households. Employees are considered to have informal jobs if their employment relationship is not subject to standard
labor legislation, taxation, social security or entitlement to certain employment benefits (advance notice dismissal,
severance pay, paid annual leave, etc.) for reasons such as: non-declaration of the jobs or employees; casual jobs;
employment by unregistered enterprises or by persons in households. (4) Members of informal producers’ cooperatives;
and (5) Persons engaged in the own-account production of goods exclusively for own final use by their household, such as
subsistence farming.
7. 7
that agriculture, forestry, and fishing employed the highest percentage of its workers in the informal sector at
98%, and these workers received the lowest average monthly pay at 319,293 kwacha. The transportation and
storage industry had the highest rate of formal employment at 49%, and it also had the highest average
monthly pay at 1.1 million kwacha. Wholesale and retail trade and hotels and restaurants had the longest
working day, averaging nine hours, while mining and quarrying averaged the shortest working day at five
hours.
Finally, further indication of how Zambia’s informal sector dominates its labor market can be found by
comparing rates of formalization across sectors. The government sector reports fully formalized employment,
and international organizations report about two-thirds formal employment, but these sectors employ few
Zambians relative to the overall labor force. The private sector and non-governmental organizations (NGOs)
employ more Zambians relative to the overall labor force, and report 76% and 58% informality, respectively.
NGO employees work an average of eight hours per day versus household workers who average only five (LSB
2010).
Urban-Rural Divide and Migration
When examining the urban-rural divide in the literature, several distinctions appear. First, previous
literature asserts that there is more labor in the urban sector compared to the rural sector (Deininger and
Olinto 1998, Kannappan 1985). Second, the urban sector is comprised of manufacturing and mining industries
versus agriculture dominating in the rural sector (Söderbom et al. 2003, Balat and Porto 2005). Third, income
generating activities between the two sectors vary significantly (Balat and Porto 2005). Fourth, labor unions in
the urban sector are disproportionately powerful compared to the rest of the labor market (Nelson 1991).
Due to perceptions of better job opportunities and better wage rates in urban areas, there is an excess
supply of labor (Kannappan 1985). The excess labor is also reported by the LSB (2010), which found higher
levels of unemployment in the urban sector. For example, in Lusaka the urban unemployment rate was 35%,
compared to 10% in rural areas (LSB 2010). This excess supply of labor in urban areas has two effects on the
labor market. First, it causes a significant portion of the population to enter the informal sector (Agenor 1998).
8. 8
Second, it depresses wages for unskilled workers (Kannappan 1985). For the rural sector, Deininger and Olinto
(1998) argue that labor markets are scarce or nonexistent. However, the LSB (2010) reveals that in rural areas,
there is actually a higher labor force participation rate than in the urban areas. This is because rural residents
can always work on the land and be counted as "working". Subsistence farming does not allow for the
traditional mechanisms of labor supply and demand. As a result, the supply and demand argument does not
apply to the majority of rural labor markets. For the urban sector, where there is a labor market (labor is
bought and sold with wage as the price), the low labor force participation rate and high unemployment can be
explained as labor supplied in excess of labor demanded.
As mentioned earlier, the urban sector is primarily comprised of manufacturing and mining industries.
Traditional economic literature states that manufacturing sectors should have a strong impact on income
generation. However, in Zambia, Söderbom et al. (2003) found there is no evidence that manufacturing
exports helped stimulate growth. In fact, despite having manufacturing exports, Zambia had the lowest
underlying growth rates when compared to other countries such as Mauritius, South Africa, Botswana, Ghana,
Nigeria, Tanzania, and Kenya.
In developing countries, labor movements tend to be small, weak, and fragmented, but in Zambia,
unions in strategic sectors may exercise considerable economic and political clout. For example, copper miners
have a strong union in which they can leverage the government to maintain higher wages (Nelson 1991).
These wages tend to be markedly out of line with the rest of the economy. As a result, the copper sector wage
differential has distorting effects such as preventing government reform within the sector (Nelson 1991).
Labor unions continue to be powerful in Zambia even after structural adjustment reforms and market
liberalization. The most powerful mining union in Zambia is the Mine Workers Union of Zambia (MUZ). Over
the past few years, they have been able to use their power and clout to dissuade foreign investments.
Specifically, the MUZ has worked to prevent Brazilian investment in the copper industry (Chansa 2010).
While there is a rural-urban divide, high transaction costs diminish productivity in both areas
(Söderbom et al. 2003, Arnold et al. 2008, Jayne et al. 2003, Balat and Porto 2005). In the rural sector, one
9. 9
important input is fertilizer. Fertilizer provides better soil quality as well as increased output per acre of land.
In Zambia, infrastructure such as transportation, extension programs, and irrigation are lacking (Jayne et al.
2003, Balat and Porto 2005). This increases the difficulty of accessing fertilizer and diminishes its usability.
Janye et al. (2003) found that small-scale farmers opt not to use fertilizers because of the difficulty in obtaining
it. Other forms of high rural transaction costs are limited R&D and poor health services (Jayne et al. 2003, Balat
and Porto 2005). Lack of R&D in agriculture limits the productivity of crops, while poor health services limit the
productivity of labor.
For the urban sector, high transaction costs are associated with inappropriate government policies and
lack of infrastructure (Söderbom et al. 2003). Arnold et al. (2008) ran a regression across various African
countries, including Zambia, testing to see how service inputs affected firm productivity. The service inputs
that were tested included access to electricity, telecommunications, and the banking system. They found a
negative relationship between the three service inputs and a firm’s productivity level, showing that higher
transaction costs are reflected by a lack of service inputs.
High wage differentials between urban and rural areas impact the level of migration, as people from
rural communities move to urban centers to increase their income (Donge 1984; Pottier 1983; Ogura 1991).
Even though the LSB (2010) revealed that job creation in urban centers has stagnated, migrants frequently seek
employment in cities, like Lusaka, because of perceived employment opportunities. Ogura (1991) argues that
despite the lack of job opportunities in urban centers, the rural-urban wage differential is large enough to
incentivize migration. As a result, most laborers in the high-wage copper industry migrate back to their villages
when the industry comes under duress (Ogura 1991). Rural to urban migrants seeking wage employment tend
to be subsistence farmers in need of a more reliable source of income (Donge 1984, Ogura 1991). Subsistence
agriculture fails to provide insurance for agricultural shocks, such as droughts and changes in government
fertilizer policies (Ogura 1991, Jayne et al. 2003).
There are stark gender differences in who migrates. For example, Donge (1984) found that in Mwase
Lundazi, Eastern Province, 68% of all male households had engaged in migration for a median time of six years.
10. 10
In Mambwe, Eastern Province, 41% to 45% of males migrated on average (Pottier 1983). In Siavonga District,
Southern Province, only 23% of the migrants were females (Ito 2010).
Migration is also determined by non-economic factors. For example, Cliggett (2000) and Donge (1984)
argue that migration can act as a way of resolving social problems in villages such as fightingamongst family
members (Cliggett 2000). Another social custom that drives migration is the practice of polygamy in parts of
Zambia. In polygamous societies, young men have to compete with older men for wives and the capital
associated with multiple wives.3
To avoid this competition, young men choose to migrate out of the village to
urban centers where such social customs would not inhibit them from establishing themselves (Donge 1984).
Ito (2010) found that migration destinations were chosen based on the ability to send remittances back
to one’s village. The easier it is to send remittances home, the more likely one will migrate there. Remittances
are mostly sent by temporary migrants and provide a better and more equitable distribution of income
throughout large parts of Zambia (Amin and Mattoo 2006). Remittances also act as a method of reserving
one’s right to return to the village (Cliggett 2000).
Migration, particularly of unskilled labor, tends to be temporary. Pottier (1983) and Ogura (1991) both
argue that most rural to urban migrants stayed in urban centers only until they retired, lost their jobs, or gave
up finding work. These returning migrants remained semi-peasant and semi-proletarian and in turn hedged
their incomes by keeping all avenues of income generation open.
International Emigration
A different aspect of migration is international emigration. International emigration can lead to ‘brain
drain,’ a phenomenon referring to skilled workers migrating out of developing countries for better job
opportunities that are suited to their particular skill sets. This depletes developing countries of vital skilled
labor. Amin and Mattoo (2006) argue that Zambia, compared to some of its African counterparts,4
has a
relatively low level of skilled labor emigration at a rate of 26.5% per annum. If this emigration of skilled labor
3
In Zambia, women generally own cattle and oxen (Donge 1984). This is seen as capital for those engaged in agriculture
as it increases the productivity of the land through the ability to plow the land.
4
For some perspective, consider the following data on skilled labor emigration from other African countries: South Africa
61.1%, Zimbabwe 47.1%, and Mozambique 33.7% (Amin and Mattoo 2006).
11. 11
remains permanent, it may pose a problem to Zambia because the country does not have the capacity to
replace the lost skilled labor (Amin and Mattoo 2006).
As for emigration of unskilled labor, Zambia has a much lower rate compared to its regional partners,5
with only 0.1% per annum (Amin and Mattoo 2006). Unskilled workers who temporarily migrate would gain
access to better education and experiences that are transferrable back to Zambia upon return (Amin and
Mattoo 2006). This transfer of knowledge and skills would greatly improve Zambia’s local labor market.
Gender Issues in Zambia
Gender issues play an important role in all aspects of an economy. A major factor is the country’s
male-dominated social structure which leads to higher rates of poverty among Zambian women. Zambia’s
colonial history helped to entrench this social structure by introducing cash crops to many areas, which gave
men a source of income and helped delineate clear divisions of labor between the sexes (Taylor 2006). Women
became more responsible for daily subsistence while men became the breadwinners. The increased
engagement of women in the informal sector did not help improve their domestic status since men remained
in control of women’s additional income (Floro 1998).
Gender wage differentials are very pronounced but can be mediated through education. For example,
females with no education earn 65% of their male counterparts. In contrast, tertiary-educated females earn
95% of males with the same level of schooling (Burger, Burger, and van der Berg 2004). Education is therefore
essential for increasing gender equality. Evidence shows that educated women have lower fertility rates and
are better able to engage in productive activities, find formal sector employment, and earn higher incomes
(ZSCGA 2004).
The gender gap in educational achievement is big in Zambia. The literacy rate, an important indicator
of access to education and an essential component of formal sector employment, is 60% for women compared
to 76% for men. Enrollment in secondary school and university is much lower for girls. One third of boys
5
South Africa .4%, Mozambique .5%, and Zimbabwe .2%.
12. 12
attend secondary school compared to 28.7% of girls in the same age group. Moreover, girls constitute less
than 30% of the total student population at institutions of higher learning (ZSCGA 2004).
Traditional gender roles significantly limit women’s employment prospects. For example, more than 3
out of 4 labor immigrants to more populated areas are men (Ito 2010), which greatly affects the availability of
formal sector jobs for women as the majority are located in larger urban centers. Greater concentrations of
men in urban areas, coupled with a more difficult labor market for women in general, continues to result in
lower female participation. Recent national representative labor survey data has shown that even though
labor force participation rates are similar for rural men and women, male participation in urban areas was
recorded at 75% compared to female participation of 58% (LSB 2010). Women’s employment is largely in the
informal sector. For example, 22% of men were paid employees versus 12% of women, and while 26% of men
were unpaid family workers, 53% of women were unpaid family workers (LSB 2010).
It should be noted that women’s total labor contribution is always underreported in the traditional
labor survey because many of the labor activities women participate in (e.g. housework and subsistence
activities) are not recorded. Therefore, greater access to employment opportunities for women outside of the
home will not only increase economic output, but also lead to a substitution of unrecorded female labor in the
home with recorded female labor in the economy, making women’s labor visible (ZSCGA 2004).
Lack of access to banks and other finance institutions also limits the ability of women to start or expand
small businesses, which means they are often forced to participate in economic activities that produce limited
returns. This helps to reinforce the stereotype of men as the breadwinners and women as financially
dependent. Women also lack access to political/legal resources, including “effective legal rights to jointly own
farms and household property” (ZSCGA 2004).
Youth Employment in Zambia
SSA has the second highest youth (ages 15 to 24) labor force participation rate in the world, and the
annual growth rate of employable youths in SSA shows no signs of slowing down (Elder et al. 2010). Yet as the
ILO cautions, a mismatch between growing numbers of young job seekers with stagnant or declining numbers
13. 13
of available employment opportunities leads to decreased productivity. This is reflected by higher rates of
poverty and low-productivity employment of youths in SSA. According to the LFSR 2010, youths represented
approximated 21% of the total population of Zambia. Youths were almost always (97%) employed in the
informal sector and specifically in informal agriculture (83%). Zambian youths are chronically underemployed
(79%) and less than 2% of Zambian youths had any technical skills training (LSB 2010).
Youths had an average unemployment rate of 28%, compared to the national average of 15%, and rural
youths had comparatively lower rates of unemployment than urban youths (11% and 53%, respectively) (LSB
2010). Unemployment among youths with some education was above average. In rural areas, A-level
graduates and youths with education up to grade 12 experienced comparatively high barriers to employment.
Urban youths had high rates of unemployment regardless of educational achievement. Hoppers (1985)
investigated the impact of education on rural youths, finding that school drop-outs preferred wage
employment, but remained in agriculture and rural life at high frequencies. Hoppers argued that rural youth
eventually become typical rural workers rather than agents of change. In the LFSR 2010, rural youths with low
levels of education still tended to follow Hoppers’ findings and embrace agriculture; however, there is a large
percentage of A-level males unemployed in rural areas. Urban youths who have completed G8 through A-level
education experienced higher levels of unemployment.
Bajaj (2010) found that both middle-aged and school-aged students viewed secondary education as an
avenue for wage employment. This view contradicts the realities of limited wage employment in Zambia.
While surveys have shown that youths prefer wage employment and hope that education will lead to
employment, the job market in Zambia lacks opportunities for educated youths. Hoppers (1985) addressed
this misconception, claiming that the school system gave youths a false-hope in acquiring wage employment.
He called for more targeted rural education programming that fit the needs of rural youths and provides them
with the skills needed to rise above the subsistence level. In addition, his article argued a need for
infrastructural adjustments and a framework in which rural youth can apply their skills and desires for self-
employment.
14. 14
Jensen and Nielsen (1997) and Nielsen and Westergård-Nielsen (2001) both studied education
attendance using the 1993 Priority Survey II data. Jensen and Nielsen investigated labor demands as
motivation for 7 to 18 year-olds dropping out of school. They found that female students were most
vulnerable to dropping out due to work demands, pregnancy, marriage, or economic hardship at home. Older
children were also likely to drop out due to increasing wage incentives in the labor market. Children who
engaged in agricultural production were less likely to drop out because work did not interfere with school
attendance.
Nielsen and Westergård-Nielsen (2001) looked at characteristics of youths who return to schooling
after entering the workforce. Urban youths were less likely to return to school, but those who worked in the
informal sector were more likely to return than those engaged in the formal sector. For rural residents, those
who held wage employment were more likely to return to school than those who were self-employed.
Due to gender disparities discussed previously and education disincentives discussed in this section,
female youths often turn to commercial sex as a profession or to augment their wages. Ndubani et al. (2009)
conducted a behavioral surveillance survey of female sex workers (FSWs) in Zambia from 2000-2009. They
found that while the median age of FSWs was 25, over one-third were between the ages of 20 to 24 years old.
However, the median age at which respondents first exchanged sex for income was 18 years old. Almost all of
their respondents achieved primary education (96.4%) and over half had completed secondary or higher
education (55.8%). Approximately 30% of their sample engaged in other forms of employment and used
commercial sex to augment their income. The most common types of employment were market vendors and
border or street vendors.
Ndubani et al. (2009) found that FSWs are like most other youths. They have the potential for self-
employment as market vendors and/or street vendors but lack the financial support and entrepreneurial skills.
This mechanism could help offset the opportunity cost of moving from commercial sex to other sectors of
work. Ndubani et al. recommend providing access to financial and material support, as well as skills training to
reduce dependency on commercial sex. Programs targeted at training and improving access to capital for
15. 15
females are especially important given the HIV/AIDS situation in Zambia. With HIV prevalence at around 14%
(UNAIDS 2010), commercial sex workers provide a conduit through which HIV transmission can occur. Ndubani
et al. (2009) found that while FSWs are aware of HIV prevention measures, there is a lack of consistent condom
use.
HIV/AIDS Prevalence
SSA has the highest prevalence rate of HIV/AIDS in the world. In 2009, there were an estimated 22.5
million people with HIV/AIDS (PLWHA) in SSA, two-thirds of the total number of PLWHA in the world. 1.3
million Africans were estimated to have died from AIDS-related illness in 2009 (Sub-Saharan Africa HIV & AIDS
statistics, 2010). In 2002, the United Nations reported that at least one in five people in Zambia have HIV/AIDS
(Mushingeh et al. 2002). This number has decreased to one in seven today, but 15% of the working age
population (15-49) in Zambia is still infected with HIV/AIDS, the seventh highest rate in the world (CIA World
Factbook 2010). Over the past 20 years, Zambia’s HIV/AIDS prevalence rate has bounced between 15% and
20% of the working-age population. Although these rates are higher among the urban population, HIV/AIDS
has affected both rural and urban areas and will have far reaching effects in both Zambia and SSA (Drinkwater
et al. 2006). Though better understood, confusion still surrounds the impact of HIV/AIDS on the economy
(Drinkwater et al. 2006). It is projected that Zambia will see a 6% decrease in GDP per capita and will lose 20%
of its labor force due to HIV/AIDS by 2020 (Garbus 2003).
From 2000 to 2005, Zambians had a life expectancy of 32 years, which was the lowest in the world
(Garbus 2003). In 2008, life expectancy increased to 45 years (Life Expectancy 2010), but is projected to
decrease by 26% to 29% by 2050 because of AIDS (Garbus 2003). AIDS patients are expected to occupy 45% of
hospital beds by 2014, placing a large constraint on the nation’s health budget (Garbus 2003).
HIV/AIDS causes those infected to be more susceptible to tuberculosis and other opportunistic
infections. In Zambia and South Africa, 55% to 70% of tuberculosis patients are also infected with HIV (Bond et
al. 2009). The prevalence rate of tuberculosis has increased five times since the 1990s to around 40,000 people
infected (Drinkwater et al. 2006). The Zambian government provides free treatment for both tuberculosis and
16. 16
HIV. However, treatment is known to be inadequate as patients are often treated too late (Bond et al. 2009).
The highest rates of HIV/AIDS are found in urban and commercialized areas, but there has been an increasing
trend of urban HIV/AIDS patients moving back to rural areas. While there is free governmental care in rural
areas, severe problems exist in detecting, reacting to, and treating HIV/AIDS patients (Drinkwater et al. 2006).
There are several different studies on the effect of HIV/AIDS on the agriculture sector. One study
shows that the New Variant Famine (NVF) hypothesis6
is false and that HIV/AIDS does not directly result in a
decrease in agricultural production. However, the study does show that the indirect effects of HIV/AIDS do
impact farm production (Mason et al. 2007). Other studies show HIV/AIDS has more direct effects on
agricultural production at the micro-level. There is evidence that rural households suffer the worst when the
male head-of-household is infected with HIV/AIDS (Chapoto and Jayne 2008). Families cope with the burden of
an HIV-positive male head-of-household by placing the oldest son in charge of daily farming operations. This is
referred to as primary producer succession. Other coping strategies are for men to work the land of their
neighbors or in-laws to earn more income when a family member is infected (Drinkwater et al. 2006).
Another firm-level study showed that HIV/AIDS presents a general problem to productive employment
in Zambia. The study showed that employees who were sick reported illnesses most commonly associated
with HIV/AIDS (Tuberculosis 46.8%, diarrhea 12.9%, and STDs 5.8%). As a result, employers experienced staff
shortages, decreased productivity, and increased costs (Guinness, Walker, Ndubani, Jama, & Kelly, 2003).
There is a stigma associated with HIV/AIDS in Zambia. Age, gender, and socio-economic status are all
contributing factors, and women tend to be stigmatized more than men. As a result, those with HIV/AIDS
suffer from social and physical isolation, name-calling, gossip, loss of decision-making power, and the right to
access resources (Nyblade et al. 2003). Children will not admit that they or their parents have HIV/AIDS due to
fear of being stigmatized (Mushingeh et al. 2002), and those infected with HIV/AIDS often choose not to seek
medical attention to avoid being pinpointed as having the disease (Nyblade et al. 2003).
6
A hypothesis proposed by activist Alex de Waal that says HIV/AIDS is eroding rural livelihoods and making rural
households more vulnerable to drought and other transitory shocks
17. 17
Labor markets in Zambia and other Developing Countries: a Comparative Study
While studying the key features of Zambia’s labor market is essential for understanding the complexity
of the issues facing Zambian leaders, studying aggregated data helps to provide substantive insights into
Zambia’s unique opportunities and constraints it faces as a country. This section provides a comparative
analysis of Zambia and other developing countries.
This study was conducted to examine the geographic, macro-economic, institutional, and labor market
features of selected countries that are comparable to Zambia. Through preliminary “compare and contrast”
work, we aim to gain more insights into the Zambian economy, and more importantly, to identify the possible
explanatory variables for its labor market outcomes.
Selection Criteria
To construct a broad group of comparable countries, the selection was based on several key economic,
social, and geographic criteria.
First, all countries, except the neighboring countries, are screened by income level. They are either low
or lower-middle income groups according to the World Bank. Second, those countries with landlocked
geographic features and British colonial history are given priority. Third, neighboring countries sharing close
cultural and historical characteristics are selected as comparisons. Specifically, the chosen neighboring
countries are mostly landlocked African nations that are members of the South African Development
Community (SADC) and former British colonies. These countries have equal footing in terms of trade, and
share certain institutional legacies of their colonial past. As a result, five other African countries, two Asian
countries, and one Latin-American country are included in this comparative study. Table 1 summarizes the key
characteristics of Zambia and the selected comparative countries: Bangladesh, Botswana, Burkina Faso, Lao
PDR, Malawi, Paraguay, Uganda, and Zimbabwe.
18. 18
Table 1: Characteristics of Zambia and Comparison Countries (CIA World Factbook, 2011)
Country
GDP/capita
(US$, PPP,
2010 est.) Location
Income
level Landlocked
Population
(million
people,
2010 est.) Area (square km) Natural Resources Colonial History
Bangladesh 1,700 Southern Asia Low No 156 143,998
Natural gas, arable land,
timber, coal British
Botswana 13,100 Southern Africa
Upper
Middle Yes 2 581,730
Diamonds, copper, nickel, salt,
soda ash, potash, coal, iron ore,
silver British
Burkina Faso 1,200 Western Africa Low Yes 16.2 274,200 Gold French
Lao PDR 2,400 Southeast Asia Low Yes 6.4 236,800
Timber, hydropower,
gypsum, tin, gold, gemstones French
Malawi 900 Southern Africa Low Yes 15.4 118,484
Limestone, arable land,
hydropower, unexploited
deposits of uranium, coal, and
bauxite British
Paraguay 4,900
Central South
America
Lower
Middle Yes 6.4 406,752
Hydropower, timber,
iron ore, manganese, limestone Spanish
Uganda 1,200 Eastern Africa Low Yes 33.4 241,038
Copper, cobalt,
hydropower, limestone,
salt, arable land, gold British
Zambia 1,500 Southern Africa Low Yes 13.5 752,618
Copper, cobalt,
zinc, lead, coal,
emeralds, gold, silver,
uranium, hydropower British
Zimbabwe 400 Southern Africa Low Yes 11.7 390,757
Coal, chromium ore,
asbestos, gold, nickel, copper,
iron ore, vanadium, lithium, tin,
platinum, group metals British
19. 19
Out of the nine selected countries, two are in the middle income group: Botswana (upper middle) and
Paraguay (lower middle). The rest belong to the lower income group, with Zimbabwe having the lowest GDP
per capita in purchasing power parity of $400 per person per year. In the low-income group, Zambia is
performing moderately better with a GDP per capita of $1500 per person per year. With regard to geography,
all the listed countries are landlocked except for Bangladesh. Their population sizes vary from 2 million
(Botswana) to over 150 million (Bangladesh).
Zambia has the largest land mass (more than 750,000 square km), which is more than 5 five times
larger than Malawi (115,000 square km). Countries like Botswana, Zimbabwe and Zambia possess a wide
variety of natural resources while others such as Burkina Faso, Lao PDR, and Bangladesh are more poorly
endowed. Furthermore, all nine countries are former European colonies.
Basic Economic and Development Indicators
The following section will focus on analyzing basic economic and development indicators which provide
useful information on the economic performance of the selected countries in past decades.
Figure 1 shows the trend of GDP growth rates of six African countries between the years 2000 and
2009. These economies experienced fluctutating growth rates throughout the decade. From 2008 to 2009,
-15
-10
-5
0
5
10
15
2000 2001 2002 2003 2004 2005 2006 2007 2008 2009
Percent
Year
Source: World Bank 2010
Figure 1: GDP Growth Rates of Selected African Countries 2000-2009
Botswana
Burkina Faso
Malawi
Uganda
Zambia
Zimbabwe
20. 20
growth slowed down signifcantly as a result of the global recession. While Zimbabwe constantly experienced
negative growth rates since 2000, Botswana did not have negative growth until 2009. Zambia’s performance
was relatively stable throughout this same period, with GDP growth varying from 2.5% to 5% per year since
2000. Uganda experienced a similar trend but with a slightly higher rate. Malawi, though achieving a lower
average rate of GDP growth, has converged with Zambia in recent years.
Figure 2 provides a snapshot on the economic structures of the selected countries for this study. The
service sector accounts for the highest share in GDP (value-added) across all countries. Relative to other
economies, Zambia has a small service sector in terms of value-added GDP contribution. The share of the
agriculture sector is relatively low despite the fact that most of these economies rely heavily on agriculture and
have large rural populations. For Zambia, agriculture accounts for the smallest share (19.7%) in total GDP,
while service takes the largest share (46.6%). For an agriculture-based economy, this strongly implies low
productivity and reliance on subsistence farming in the agriculture sector. The industrial sector contributes
0
10
20
30
40
50
60
70
80
90
100
Banglades
h
Botswana Burkina
Faso
Lao PDR Malawi Paraguay Uganda Zambia Zimbabwe
Agriculture 18.4 2.3 30.1 29.8 33.4 21.8 23.6 19.7 19.5
Industry 28.7 45.8 20.7 31.7 21.7 18.2 24.5 33.7 24
Service 52.9 51.9 49.2 38.5 44.9 60.1 51.9 46.6 56.6
Percent
Country
Source: CIA World Factbook 2011
Figure 2: GDP (Value Added, %) by Sector of
Selected Developing Countries, 2009
21. 21
high values to total GDP in Botswana (45%) and Zambia (over 33%). When assessing Zambia relative to other
nations, we find that Zambia is the 2nd
most industrious country in terms of value added GDP behind Botswana.
Labor Market Outcomes
This study used two key outcomes – labor force participation and labor productivity (measured by GDP
per person employed in U.S. dollars) to assess Zambia’s employment and labor productivity performance.
Some comparative countries were omitted due to missing data.
Figure 3 shows the labor participation rate of all individuals that are at least 15 years of age . Males
tend to have a larger participation rate than females in Zambia. A similar trend is visible in other countries
within this study. Among the African countries, Zambia has the largerst difference between the male and
female labor participation ratios (over 78% and nearly 60% respectively). In addition, the participation rates of
both genders in the Zambian labor market are significantly lower than those in most of the other countries.
Burkina
Faso
Banglades
h
Botswana Lao PDR Malawi Paraguay Uganda Zambia Zimbabwe
Female 77.7 58.3 72 77.8 75.1 55.9 78.4 59.9 59.9
Male 90.9 82.8 80.6 78.7 78.6 87.5 90.6 78.5 73.5
0
10
20
30
40
50
60
70
80
90
100
Percent
Source: World Bank 2010
Figure 3: Labor Participation Rate (population ages 15+) in
Selected Developing Countries, 2008
Female
Male
22. 22
Malawi, Zambia, and Zimbabwe are the three countries with both low labor participation rates and low
labor productivity, while Burkina Faso, Uganda, and Bangladesh all did well in these two categories. There
could be a correlation between participation rate and productivity of labor. Since improvements in these two
outcomes are important for enhancing the efficiency of Zambia’s labor market, it would be useful to look at
other indicators that could affect them in either a direct or indirect way. The following sections will look into
the Employing Workers and Doing Business Indicators by the World Bank.
Employing Workers Indicator
The regulation of employment affects the hiring and redundancy of workers as well as the rigidity of
working hours. This Rigidity of Employment Indicator developed by the World Bank is comprised of four key
indices: the difficulty of hiring, rigidity of hours, difficulty of redundancy, and redundancy cost. Each of the
indices includes several subindices as shown in the index tables. Within the four broad categories of
Employment Rigidity, Zambia ranks near the middle. Since labor regulation can be an important determinant
of employment at the firm level, it could affect the labor participation and employment rate at the national
level.
0
500
1000
1500
2000
2500
3000
3500
4000
3722
2531
1546
2527
1833
1502US$
Source: World Bank 2010
Figure 4: Labor Productivity of
Selected Developing Countries, 2008
GDP per Person Employed
2008 (constant 1990 PPP $)
23. 23
Difficulty of Hiring
The difficulty of hiring index measures “i) whether fix-term contracts are prohibited for permanent
tasks; ii) the maximum cumulative duration of fixed-term contracts; and iii) the ratio of the minimum wage for
a trainee or fist-time employee to the average value added per worker (World Bank 2011).”
Among the selected countries, Zambia stands in the middle group in terms of employee hiring
difficulty. While Bangladesh, Malawi, and Paraguay prohibit fixed-term contracts for permanent tasks, Zambia
and the rest do not have such regulation. No countries put a maximum length on fixed-term contracts, but
several of them set a limit for single fixed-term ones. For example, in Burkina Faso, the duration is 24 months
for national workers, while in Paraguay, the limit is 12 months for laborers, and 60 months for employees.
For minimum wage requirements, Zambia also stands at the median point among the listed countries,
with $63.7 per month as the lowest possible wage for a 19-year-old (first time) worker or an apprentice.
Paraguay again has the strictest regulation in this category, with a minimum wage of $168.6 per month, while
Uganda sets it at only $3.1 per month. Like Botswana and Uganda, Zambia ‘s required ratio of mimimum wage
to value added per worker is low at 0.4. In contrast, Zimbabwe sets their required ratio at 1.8, followed by
Burkina Faso at 0.79.
Rigidity of Hours
The Rigidity of Hours index measures:
“i) whether there are restrictions on night work; ii) whether there are
restrictions on weekly holiday work; iii) whether the workweek can consist of
5.5 days or is more than 6 days; iv) whether the workweek can extend to 50
hours or more (including overtime) for 2 months a year to respond to a seasonal
increase in production; and v) whether the average paid annual leave for a
worker with 1 year of tenure, a worker with 5 years and a worker with 10 years
is more than 26 working days or fewer than 15 working days (World Bank
2011).”
Zambia, Burkina Faso, and Paraguay impose the strictest limit on working hours – 8 hours per day (in
normal circumstances). Botswana, Bangladesh, and Zimbabwe allow for 8-9 hours per day; while the rest,
including Malawi and Uganda, set looser standards, up to 10 and 12 hours per day respectively. Lao PRD
24. 24
regulations were flexible in certain manufacturing industries. For working days per week, Zambia requires at
most 5.5 days while all the other listed countries accept 6 days. Most countries allow for 20 hours of overtime
per week under normal circumstances, but data was not available for Malawi, Zambia and Zimbabwe. In case
of increased production, all of these countries make the 50-hour workweek legal for up to 2 months per year.
Zambia, Lao PDR and Paraguay have specific regulations on the premium for night work and work on
weekly rest days (as % of hourly pay), which is 4% and 100%, 15% and 150%, and 30% and 100% respectively.
Out of that, Paraguay is the only country that sets major restrictions on night work and weekly holidays in case
of continuous operation.
Zambia’s regulation allows for the longest duration of paid annual leave - 24 working days per year, and
also treats workers in different tenures (9 months, 1 year, 5 years, 10 years and 20 years) equally while all the
remaining countries put a lower limit on workers with 9 months of tenure. On average, Botswana, Lao PDR and
Malawi have the least demanding requirements on paid leave.
Difficulty of Redundancy
The Difficulty of Redundancy index has 8 components:
“i) whether redundancy is disallowed as a basis for terminating workers; ii)
whether the employer needs to notify a third party (such as a government
agency) to terminate 1 redundant worker; iii) whether the employer needs to
notify a third party to terminate a group of 9 redundant workers; iv) whether
the employer needs approval from a third party to terminate 1 redundant
worker; v) whether the employer needs approval from a third party to
terminate a group of 9 redundant workers; vi) whether the law requires the
employer to reassign or retrain a worker before making the worker redundant;
vii) whether priority rules apply for redundancies; and viii) whether priority rules
apply for reemployment (World Bank 2011).”
All of the case countries, by law, allow for dismissal due to redundancy, yet they all have different
procedure requirements. Burkina Faso and Uganda require neither notification nor approval of a third party if
one worker is dismissed. For Zambia, notification is needed for any number of workers dismissed but not for
approval. Lao PRD, Paraguay, and Zimbabwe impose the strictest regulations in this category. Among the nine
25. 25
countries, Malawi, Uganda and Zambia do not have any regulations on necessary retraining/reassignment
obligations before redundancy as well as priority rules for redundancies or employment. Meanwhile, labor
regulations in other countries such as Botswana, Burkina Faso and Bangladesh cover all these issues.
Redundancy Cost
The Redundancy Cost index measures “the cost of advance notice requirements, severance payments,
and penalties due when terminating a redundant worker, expressed in weeks of salary. The average value of
notice requirements and severance payments applicable to a worker with 1 year of tenure, a worker with 5
years, and a worker with 10 years, is used to assign the scores (World Bank 2011).”
Zimbabwe requires the longest notice period on average for redundancy dismissal (13 hours), followed
by Uganda (8.7 hours), and Malawi (7.5 hours). Zambia, Burkina Faso and Malawi have the laxest regulations
of 4.3 hours on average for all tenure workers. Zimbabwe has the highest requirement for severance due to
redundancy dismissal – 69.3 salary weeks. Zambia ranks second at 46.2 salary weeks. Uganda does not set the
regulations for this category. Some other countries including Bangladesh, Burkina Faso, Malawi and Zambia do
not require severance payment for redundancy dismissal for workers with tenure up to 9 months.
Doing Business Indicator
In this study, indicators of doing business provide useful implications for labor markets. They can have
significant impacts on employment decision-making. High costs of doing business are more likely to lead to
less job creation in the formal sector and pose downward pressures on wages.
In the World Bank Doing Business Report 2011, Zambia was ranked 76th
out of 183 countries in terms of
ease doing business. This is an improvement from 2010’s ranking of 84th
.7
This aggregate ranking by itself does
not provide the full story and limits the scope of analysis. This study looked at various individual doing business
indicators in Zambia and compared them across the different case-study countries. The indicators in this
7
For a comparison of the ease of doing business across our country sample, Appendix 5 has a useful table.
26. 26
section will include: starting a business, dealing with construction permits, registering property, getting credit,
protecting investors, paying taxes, trading across borders, enforcing contracts, and closing a business.
Starting a Business
There are three categories that affect entrepreneurs’ ability to start a business. These include the
number of procedures required, the number of days to start a business, and the cost of opening a business as a
percentage of income per capita. In 2010/2011, it took Zambian entrepreneurs six bureaucratic steps to open
a business. Compared to other countries within the sample, there are fewer required steps to start a business
in Zambia. Bangladesh, Lao PDR and Paraguay required seven bureaucratic steps to start a business. Burkina
Faso (4 steps) is the only country in which there are less steps required to start a business.. The rest, Botswana
(10 steps), Malawi (10 steps), Uganda (18 steps) and Zimbabwe (9 steps) require their entrepreneurs to go
through more steps than Zambia.
The second component of determining the ease of starting a business is the number of days it takes to
do so. In 2010/2011, it took the average Zambian 18 days to open a business. This measure was almost halved
since 2004 when it took 35 days. In comparison, proprietors in Burkina Faso can start a business quicker than
Zambia, taking only 14 days. Bangladesh was close to Zambia, taking 19 days. The rest of the countries took
much longer to start a business, with three countries standing out in particular: Botswana (61 days), Zimbabwe
(90 days) and Lao PDR (100 days).
The third component of starting a business is the cost of doing so as a percentage of per capita income.
For Zambia, the cost of opening a business in 2011 was 27.9%, ranking it high in the list of countries. Only
Botswana (2.2%) and Lao PDR (11.3%) had lower costs. As for the rest of the sample countries, there was a
large range from 33.3% (Bangladesh) to 182.8% (Zimbabwe). for Uganda (94.4%), it almost costs a business its
entire income just to start. For Malawi and Zimbabwe, the costs of starting a business are greater than its
income revenue. With costs being so high, there is little incentive to start a business, at least within the formal
sector.
27. 27
Overall, it is relatively easy for Zambians to start a business compared to citizens of other countries
such as Malawi, Uganda, and Zimbabwe. However, Zambia could continue to work towards achieving the
standards of Burkina Faso by lowering the number of procedures and days needed to open a business.
Table 2: Starting a Business
Country
Procedures (number) Time (days) Cost
Bangladesh 7 19 33.3
Botswana 10 61 2.2
Burkina Faso 4 14 49.8
Lao PDR 7 100 11.3
Malawi 10 39 108.4
Paraguay 7 35 55.1
Uganda 18 25 94.4
Zambia 6 18 27.9
Zimbabwe 9 90 182.8
Source: Doing Business 2011
Dealing with Construction Permits
The World Bank also measures the time and cost of obtaining construction permits, which is critical to
building business infrastructure.
The first component of this variable is how long aspiring business owners must wait to receive their
construction permit. Zambians had to wait 254 days in 2011. This waiting period has not changed since 2006,
and is one of the longest of the studied countries. Only Zimbabwe took significantly longer to obtain a permit,
1,012 days. Bangladesh (231 days) and Malawi (268 days) are roughly in the same range as Zambia. Among
the rest of the countries, the next closest in terms of waiting is Paraguay (179 days).
The second component of this variable is the cost, as a percentage of one’s income, of obtaining a
construction permit. In 2011, it cost Zambians 2,454% of their income to obtain a construction permit. While
this is very high, it cost Zambians 4,520% of their income in 2006. Across our sample, Zambia was the second
most expensive country in terms of obtaining a construction permit. Zimbabwe was more expensive with the
cost being 8,020%. Botswana had the most affordable construction permit cost, 264% of one’s income.
28. 28
Table 3: Dealing with Construction Permits
Country Time (days) Cost (% of income)
Bangladesh 231 558.1
Botswana 167 264.5
Burkina Faso 122 576.1
Lao PDR 172 131.3
Malawi 268 1,316.7
Paraguay 179 298.9
Uganda 171 1,287.8
Zambia 254 2,454.2
Zimbabwe 1,012 8,020.6
Source: Doing Business 2011
Overall, it is difficult for Zambians to obtain construction permits. It takes a very long time and it is
expensive. These regulations create disincentives to start a business in Zambia, which turns people to the
informal sector. There is room for Zambia to focus on improving the ease of obtaining construction permits in
order to stimulate businesses within the formal sector.
Figure 5 aggregates the costs associated with constructing a business in terms of percent of income per
capita. As illustrated, while other countries tend to have relatively low costs, Zambia and Zimbabwe, tend to
0
1000
2000
3000
4000
5000
6000
7000
8000
9000
FIgure 5: Cost (% of income per capita) to
Construct a Business
Cost (% of income per
capita)
Source: Dpoing Business 2011
29. 29
have significantly higher costs. This is an important variable to examine due to trends associated with startup,
especially in the formal sector.
Registering Property
The third variable in determining the ease of doing business within a country is the ability to register
property. There are three components within this variable: the number of procedures needed to register
property, how long it takes to register property, and the cost of registering property as a percentage of the
property value. In 2011, Zambians had to go through five procedures to register their property. Compared to
the rest of the case countries, Zambia had relatively similar number of procedures associated with registering
property. Botswana and Zimbabwe also had five steps, Burkina Faso had four, and Malawi and Paraguay had
six steps. Uganda stands out as having the most steps (13) to register property.
The second component is how long it takes to register property. In 2011, it took Zambians 40 days to
have their property registered. The wait period dropped significantly from 70 days in 2005. Zambia, in
comparison to the rest of the sample, does not necessarily stand out. Only Botswana takes significantly less
time to register property (16 days). Laos (135 days) and Bangladesh (245 days) stand out as countries that take
significantly more time to have property registered.
The third component of this variable is the cost of registering property, computed as a percentage of
the total value of the property being registered. In Zambia in 2010/2011, it cost 6.6% of the total property
value to have it registered. It was relatively expensive for Zambians to register their property compared to
other countries. Bangladesh had the same cost for registration. Only in Zimbabwe (8.5%) and Burkina Faso
(13.1%) had higher costs associated with registering property. For the rest of the case countries, the range of
costs associated with registering property was between 5% for Botswana and 1.9% for Paraguay. For Zambia,
the most difficult or constraining part of registering property is the cost, which could cause Zambians not to
register their property at all.
30. 30
Table 4: Registering Property
Country Procedures
(number)
Time
(days)
Cost
(% of property value)
Bangladesh 8 245 6.6
Botswana 5 16 5
Burkina Faso 4 59 13.1
Lao PDR 9 135 4.1
Malawi 6 49 3.2
Paraguay 6 46 1.9
Uganda 13 77 3.2
Zambia 5 40 6.6
Zimbabwe 5 31 8.5
Source: Doing Business 2011
Getting Credit
Another measure of doing business within a country is the availability of formal credit for firms. The
World Bank Group measures this variable in two parts: the strength of legal rights and depth of credit
information. The strength of legal rights is an index measure ranging from 0 to 10. A score of 0 represents
absolutely no legal rights protection, while a 10 is complete protection of one’s legal rights. For Zambia, the
strength of legal rights had a score of 9 in 2011, indicating that legal rights are well protected. In comparison to
the other case countries, Zambia had the strongest legal rights protection. Burkina Faso and Paraguay had the
weakest legal rights protection with scores of 3.
The second component of this variable is the depth of credit information. Similar to the previous
component, this is also an index measure. It is scaled 0 to 6, with 0 being absolutely no credit information
available to 6 being total credit information available. In 2011, Zambia had a depth of credit information score
of 5. This is a significant improvement from 2009 when it had a score of 0. Again, Zambia was situated at the
top of this measure. Only Paraguay has a better depth of credit information index score of 6. Malawi,
Paraguay and Zimbabwe had no credit information.
According to the World Bank, the ability to access formal credit is correlated to one’s legal rights
protection and the depth of credit history. Zambians, theoretically, should have access to formal credit as both
31. 31
credit measures are high. Also according to the data, access to formal credit for firms should be easier in
Zambia than compared to other countries.
Table 5: Getting Credit
Country Strength of legal rights
index (0-10)
Depth of credit information index
(0-6)
Bangladesh 7 2
Botswana 7 4
Burkina Faso 3 1
Lao PDR 4 0
Malawi 7 0
Paraguay 3 6
Uganda 7 4
Zambia 9 5
Zimbabwe 6 0
Source: Doing Business 2011
Paying Taxes
The sixth aggregate variable used by the World Bank Group is paying taxes It has four components: the
number of times a firm has to pay taxes per year, how much of the profit is taxed, the labor tax, and the total
tax rate. In 2011, Zambian businesses made 37 tax payments. Only Burkina Faso and Zimbabwe require more
tax payments per year with 46 times and 49 times respectively. Botswana and Malawi businesses have to
make the least amount of tax payments per year with 19 installments.
The second component of paying taxes is how much of a firm’s profit is taxed. In 2011, the average
profit tax in Zambia was 1.7%. Compared to the rest of our sample, Zambian firms have the lowest profit tax.
The only other country with single digit profit taxes is Paraguay at 9.6%. The highest profit tax was in
Bangladesh at 25.7%, closely followed by Lao PDR at 25.2%. Uganda and Malawi were tied at third with a profit
tax of 23.3%.
The third component of this variable is the labor tax. For Zambia in 2011, the labor tax rate was 10.4%.
Zambia was roughly in the middle when compared to our sample of countries. Uganda (11.3%), Paraguay
32. 32
(18.6%), and Burkina Faso (22.6%) had higher labor tax rates. On the other end of the extreme were
Bangladesh and Botswana which had no labor taxes whatsoever.
The final component of paying taxes is the total tax rate. This measure incorporates the profit tax,
labor tax and other individual taxes that firms faced within their respective country. For Zambia in 2011, the
total tax rate was 16.1%. Zambia had the lowest overall tax rate compared to the rest of the studied countries.
Only Botswana was close with a total tax rate of 19.5%. The highest overall tax rate belonged to Burkina Faso
at 44.9%.
In summary, Zambia does not have the highest total tax rate compared to the rest of the countries, especially
Burkina Faso, which had the highest tax rate. Because firms are allowed to retain most of their profits, one
would think that Zambia is an ideal location to start a business. However, a heavy emphasis on labor-related
taxes could cause firms to be more capital driven versus labor-orientated. This is problematic because Zambia
has a significant number of urban unemployed people.
Table 6: Paying Taxes
Country Payments (number per
year)
Profit tax
(%)
Labor tax Total tax
rate
Bangladesh 21 25.7 0 35
Botswana 19 15.9 0 19.5
Burkina Faso 46 16.1 22.6 44.9
Lao PDR 34 25.2 5.6 33.7
Malawi 19 23.3 1.1 25.1
Paraguay 35 9.6 18.6 35
Uganda 32 23.3 11.3 35.7
Zambia 37 1.7 10.4 16.1
Zimbabwe 49 24 6.2 40.3
Source: Doing Business 2011
33. 33
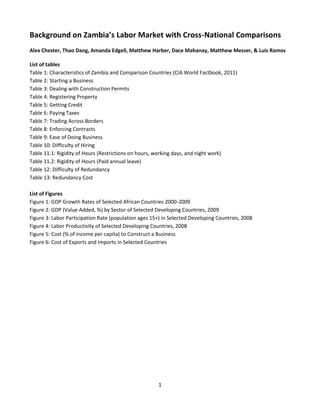
Trading Across Borders
The next variable within the Doing Business Report is trading across borders. This is relevant for
manufacturing firms who have to take into consideration export and import issues. There are four components
to this variable: time taken to export goods, the cost of exporting, time taken to import goods, and the cost of
importing. For Zambia in 2011, the average time required to export a good was 44 days. The only case country
in which it took longer to export goods was Lao PDR (48 days) and Zimbabwe (53 days). Bangladesh and
Botswana exported goods the quickest at 25 days and 28 days respectively.
The second component to this variable was the cost of exporting goods. This component was
measured in US dollars per container. For Zambia, the cost of exporting one container of goods was $2,664.
Only in Uganda, Botswana and Zimbabwe were the costs of exporting goods more expensive. The rest of our
sample was below Zambia, with Bangladesh being the cheapest at $985.
The third component of trade across borders is the time it takes to import goods. For Zambia in 2011,
it took 56 days. Similar to the time it takes to export goods out of Zambia, it also took longer to import goods.
Only in Zimbabwe did it take longer for goods to be imported (73 days). Bangladesh imported goods the
quickest (31 days).
The final component of this variable was the cost of importing goods. Similar to the cost of exporting
goods, this was measured in US dollars per container of imported goods. To import goods into Zambia, it cost
$3,315 per container. Compared to the rest of the countries, it was also expensive to import goods into
Zambia. It was only more expensive in Botswana, Burkina Faso and Zimbabwe. It was cheapest to import
goods into Bangladesh at a cost of $1,390 per container.
34. 34
-
Trading across borders seems to be a problem for Zambia. The data revealed that it takes long periods
of time to export and import goods, and it is very costly to do so. This is most likely due to the lack of
infrastructure associated with carrying cross-border trade. As a landlocked country, export and import
infrastructure is important to Zambia’s economic growth and productivity.
Table 7: Trading Across Borders
Country
Time to export
(days)
Cost to export
(US$ per container)
Time to import
(days)
Cost to import
(US$ per container)
Bangladesh 25 985 31 1,390
Botswana 28 3,010 41 3,390
Burkina Faso 41 2,412 49 4,030
Lao PDR 48 1,860 50 2,040
Malawi 41 1,713 51 2,570
Paraguay 33 1,440 33 1,750
Uganda 37 2,780 34 2,940
Zambia 44 2,664 56 3,315
Zimbabwe 53 3,280 73 5,101
Source: Doing Business 2011
0
1000
2000
3000
4000
5000
6000
Source: Doing Business 2011
Figure 6: Cost of Exports and Imports in Selected Countries
US $ per Container
(Exports)
US $ per Container
(Imports)
35. 35
Enforcing Contracts
The next variable in the Doing Business Report was enforcing contracts. The two components in this
variable were the time required to enforce a contract and the cost of the claim. The time required to enforce a
contract was measured in the number of days after the initial claim was filed. For Zambia, it took 471 days to
enforce a contract in 2011. Compared to the rest of the case countries, Zambia was not an outlier. Burkina
Faso, Lao PDR, Uganda, and Zimbabwe all have enforcement time lags in the 400 day range. Bangladesh took
the longest, 1,442 days, to enforce a contract.
The second component of enforcing contracts was the cost of the claim. This component was
measured as a percentage of the claim. For Zambia, the cost of filing a claim in 2011 was 38.7% of the cost of
the claim. This is low compared to other case study countries. Botswana (28.1%), Paraguay (30%) and Lao PDR
(31.6%) had similar low filing costs. Zimbabwe had the highest, 113.1%, which was more than the claim itself.
Table 8: Enforcing Contracts
Country Time (days) Cost (% of claim)
Bangladesh 1,442 63.3
Botswana 625 28.1
Burkina Faso 446 81.7
Lao PDR 443 31.6
Malawi 312 94.1
Paraguay 591 30
Uganda 490 44.9
Zambia 471 38.7
Zimbabwe 410 113.1
Source: Doing Business 2011
For this variable, it seems that Zambia neither stands out in a positive or negative way. Compared to
most of the other countries, Zambia is an average case. However, Zambia could always work towards lowering
36. 36
the days it takes to enforce a contract, like its neighbor Malawi. Zambia could also work towards bringing
down the cost of filing a claim to level that is more comparable with Botswana.
Conclusion
The labor force in Zambia exhibits many characteristics that are common to developing countries in
sub-Saharan Africa and elsewhere. There is a strong divide between the rural and urban economies, with rural
economies largely dependent on agriculture but with less pronounced rates of unemployment. Urban centers
face chronic unemployment, which affects women and youths the most. Overall, women in Zambia face fewer
economic opportunities than men, and Zambian youths continue to follow in their parents’ footsteps as
subsistence farmers. The few who do make it out and migrate to urban centers usually end up working in the
informal economy or are unemployed. These urban migrants send remittances back home, but research has
shown that this flow of knowledge and wealth from urban to rural is only consistent when migration is
temporary. There are few employment opportunities for youths with education between G8 and A-level. The
Zambian economy continues to be reliant on informal trade and copper. While informal trade is not inherently
bad, it limits the ability of the Government of Zambia to collect tax revenues. Reliance on copper exports
makes Zambia vulnerable to market fluctuations and health factors further complicate the already burdened
labor market.
Comparisons between Zambia and a sample of similar developing countries shows that Zambia is
overall an average developing country. While the labor markets could see an improvements from various
different sectors or activities, the overall status of Zambia relative to other African nations tends to compare
rather favorably. Zambia tends to be rather balanced when it comes to its stratification of economic sectors in
which Agriculture takes a small percentage, manufacturing takes a slightly larger portion, and the service sector
being the largest employer within the nation. The only problems that were noted (or potential problems) from
this comparison arose from the labor policies within the nation that tended to be rather rigid with the
possibility of offsetting formal business creation. This comes to mind especially when looking at the slightly
37. 37
prohibited taxes within the nation in terms of labor taxes which might be a disincentive to registering a
business. In the end however, these variables will be explored heavily statistically in order to understand their
relations and effects on Zambia’s labor market.
38. 38
World Bank Doing Business 2011 Appendix (Source: World Bank 2011)
Table 9: Ease of Doing Business
Country 2010 2011
Bangladesh 111 107
Botswana 50 52
Burkina Faso 154 151
Lao PDR 169 171
Malawi 132 133
Paraguay 105 106
Uganda 129 122
Zambia 84 76
Zimbabwe 156 157
Table 10: Difficulty of Hiring
Country
Fixed-term
contracts
prohibited for
permanent
tasks?
Maximum length of a
single fixed-term contract
(months)
Maximum length of
fixed-term contracts,
including renewals
(months)
Minimum wage for
a 19-year old
worker or an
apprentice
(US$/month)
Ratio of
minimum wage
to average value
added per
worker
Bangladesh Yes No limit No limit 23.2 0.30
Botswana No No limit No limit 110.5 0.13
Burkina Faso No 24 months for national
workers - Art. 54,labor
code, 2008
No limit 65.1 0.79
Lao PDR No No limit No limit 63.9 0.51
Malawi Yes No Limit No Limit 22.6 0.49
Paraguay Yes 12 months for laborers;
60 months for employees
(Art. 49)
No Limit 168.6 0.54
Uganda No No limit No limit 3.1 0.04
Zambia No No limit No limit 63.7 0.40
Zimbabwe No No limit No limit 90.0 1.80
39. 39
Table 11.1: Rigidity of Hours (Restrictions on hours, working days, and night work)
Country
(*) Standard workday in manufacturing
(hours)
50-hour
workweek
allowed for
2 months a
year in case
of increase
in
production?
Maximum
working
days per
week
Premium
for night
work (%
of hourly
pay)
Premium
for work on
weekly rest
day (% of
hourly pay)
Major
restrictions
on night work
in case of
continuous
operations?
Major
restrictions
on weekly
holiday in
case of
continuous
operations?
Bangladesh 8 or 9 hours Yes 6.0 0% 0% No No
Botswana
8 or 9 hours
(Sect. 95(1)(b) of the Employment Act sets a
maximum of 8 hrs/day, or for 5-day
workweek 9 hrs/day.
Sect. 4 of the Manf. Reg. of Wages Order
sets a maximum of 9 hrs/day.
Yes 6.0 0% 100% No No
Burkina
Faso
8 hours Yes 6.0 0% 0% No No
Lao PDR
8 hours – other restrictions apply in different
sectors of manufacturing.
Yes 6.0 15% 150% No No
Malawi
8 hours - for guards, shift workers and
workers on 6 day workweeks. 12 hours for
workers on 5 day workweeks. Sect. 37
Yes 6.0 0% 100% No No
Paraguay 8 hours Yes 6.0 30% 100% Yes No
Uganda 8 hours (But can agree to 10) Yes 6.0 0% 0% No No
Zambia 8 hours/day Yes 5.5 4% 100% No No
Zimbabwe 8 1/2 hours Yes 6.0 0% 0% No No
40. 40
Table 11.2: Rigidity of Hours (Paid annual leave)
Country
Paid annual leave for a
worker with 9 months
of tenure (in working
days)
Paid annual leave for a
worker with 1 year of
tenure (in working
days)
Paid annual leave for a
worker with 5 years of
tenure (in working days)
Paid annual leave for a
worker with 10 years of
tenure (in working days)
Paid annual leave
for a worker with
20 years of tenure
(in working days)
Bangladesh 0.0 17.0 17.0 17.0 17.0
Botswana 11.3 15.0 15.0 15.0 15.0
Burkina Faso 0.0 22.0 22.0 22.0 24.0
Lao PDR 11.0 15.0 15.0 15.0 15.0
Malawi 11.3 15.0 15.0 15.0 15.0
Paraguay 0.0 12.0 18.0 30.0 30.0
Uganda 14.0 21.0 21.0 21.0 21.0
Zambia 24.0 24.0 24.0 24.0 24.0
Zimbabwe 0.0 22.0 22.0 22.0 22.0
41. 41
Table 12: Difficulty of Redundancy
Country
Dismissal due to
redundancy allowed
by law?
Notification of a third
party required if 1
worker is dismissed?
Approval of a third
party required if 1
worker is dismissed?
Notification of a third
party required if 9
workers are
dismissed?
Approval of a third
party required if 9
workers are
dismissed?
Retraining or
reassignment
obligation before
redundancy?
Priority rules
for
redundancies?
Priority rules
for
reemployment?
Bangladesh Yes Yes No Yes No No Yes Yes
Botswana Yes Yes No Yes No No Yes Yes
Burkina
Faso
Yes No No Yes No No Yes Yes
Lao PDR Yes Yes Yes Yes Yes No No No
Malawi Yes Yes No Yes No No No No
Paraguay Yes Yes Yes Yes Yes No No Yes
Uganda Yes No No No No No No No
Zambia Yes Yes No Yes No No No No
Zimbabwe Yes Yes Yes Yes Yes Yes No No
42. 42
Table 13: Redundancy Cost
Country
Notice
period for
redundancy
dismissal
(for a
worker
with 9
months of
tenure, in
salary
weeks)
Notice
period for
redundancy
dismissal
(for a
worker
with 1 year
of tenure,
in salary
weeks)
Notice
period for
redundancy
dismissal
(for a
worker
with 5
years of
tenure, in
salary
weeks)
Notice
period for
redundancy
dismissal
(for a
worker
with 10
years of
tenure, in
salary
weeks)
Notice
period for
redundancy
dismissal
(for a
worker
with 20
years of
tenure, in
salary
weeks)
Notice period
for redundancy
dismissal
(average for
workers with 1,
5 and 10 years
of tenure, in
salary weeks)
Severance
pay for
redundancy
dismissal
(for a
worker
with 9
months of
tenure, in
salary
weeks)
Severance
pay for
redundancy
dismissal
(for a
worker
with 1 year
of tenure,
in salary
weeks)
Severance
pay for
redundancy
dismissal
(for a
worker
with 5
years of
tenure, in
salary
weeks)
Severance
pay for
redundancy
dismissal
(for a
worker
with 10
years of
tenure, in
salary
weeks)
Severance
pay for
redundancy
dismissal
(for a
worker
with 20
years of
tenure, in
salary
weeks)
Severance
pay for
redundancy
dismissal
(average
for workers
with 1, 5
and 10
years of
tenure, in
salary
weeks)
Bangladesh 0.0 4.3 4.3 4.3 4.3 4.3 0.0 5.0 25.0 50.0 100.0 26.7
Botswana 4.3 4.3 4.3 6.0 6.0 4.9 1.8 2.4 12.0 36.0 84.0 16.8
Burkina
Faso
4.3 4.3 4.3 4.3 4.3 4.3 0.0 1.1 5.4 11.9 29.3 6.1
Lao PDR 6.4 6.4 6.4 6.4 6.4 6.4 3.9 5.2 39.0 78.0 156.0 40.7
Malawi 4.3 4.3 4.3 4.3 4.3 4.3 0.0 2.0 10.0 30.0 80.0 14.0
Paraguay 5.0 5.0 7.5 10.0 15.0 7.5 2.1 2.1 10.7 42.9 85.7 18.6
Uganda 2.0 4.3 8.7 13.0 13.0 8.7 0.0 0.0 0.0 0.0 0.0 0.0
Zambia 3.3 4.3 4.3 4.3 4.3 4.3 6.5 8.7 43.3 86.7 173.3 46.2
Zimbabwe 13.0 13.0 13.0 13.0 13.0 13.0 0.0 13.0 65.0 130.0 433.3 69.3
43. 43
References
Agenor, Pierre-Richard. 1998. “Stabilization Policies, Poverty and the Labour Market:
Analytical Issues and Empirical Evidence.” Collaborative Research Project: Poverty, Income
Distribution and Labour Market Issues in Sub-Saharan Africa. CR-2-3.1
Amin, Mohammad and Aaditya Mattoo. 2006. “Migration from Zambia: Ensuring
Temporariness through Cooperation.” The World Bank.
Amin, Mohammad. 2009. “Labor Productivity in the Informal Sector: Necessity vs.
Opportunity Firms.” World Bank Enterprise Surveys. Note 17.
Arnold, Jens Matthias, Aaditya Mattoo, and Gaia Narciso. 2008. “Services Inputs and Firm
Productivity in Sub-Saharan Africa: Evidence from Firm-Level Data.” Journal of African
Economics 17: 578-599.
AVERT. 2010. Worldwide HIV & AIDS Statistics. <http://www.avert.org/africa-hiv-aids-
Statistics.htm>.
AVERT. 2010. HIV and AIDS in Zambia. <http://www.avert.org/aids-zambia.htm>.
Bajaj, M. 2010. “Intergenerational perspectives on education and employment in the Zambian
Copperbelt.” Comparative Education Review 54: 175-197.
Balat, Jorge F. and Guido G. Porto. 2005. “Globalization and Complementary Policies:
Poverty Impacts in Rural Zambia.” NBER Working Paper Series No. 11175.
Bond, V., M. Chileshe, C. Sullivan, and B. Magazi. 2009. “The Converging Impact of
Tuberculosis, HIV/AIDS, and Food Insecurity in Zambia and South Africa.” International
Food Policy Research Institute.
<http://www.ifpri.org/sites/default/files/publications/zambiasafinalreport.pdf.>.
Burger, Ronelle, Rulof Burger, and Servaas van der Berg. 2004. “A Note on Trends in the
Zambian Labour Market Between 1991 and 1998.” Matieland, South Africa: Stellenbosch
University.
Central Statistical Office Zambia. 2006. <http://www.zamstats.gov.zm/>.
Chansa, Mwilia. “MUZ opposes investment by Brazil’s cooper giant Vale.” The Post Newspapers Zambia
July 19, 2010. Accessed February 23, 2011. http://www.postzambia.com/post-
print_article.php?articleId=11715
Chapoto, A., and T.S. Jayne. 2008. “Impact of AIDS-Related Mortality on Farm Household
Welfare in Zambia.” Economic Development and Cultural Change 56: 327-374.
CIA World Factbook. 2010. The World Factbook: Zambia.
<https://www.cia.gov/library/publications/the-world-factbook/geos/za.html>.
44. 44
Cliggett, Lisa. 2000. “Social Components of Migration: Experiences from Southern Province,
Zambia.” Human Organization 59: 125-135.
Deininger, Klaus, and Pedro Olinto. 1998. “Asset Ownership and Working Capital Constraints
in a Post-Reform Environment: Implications for Second Generation Reforms in Zambia.”
Prepared for American Agricultural Economics Association Annual Meeting.
Donge, Jan Kees van. 1984. “Rural-Urban Migration and the Rural Alternative in Mwase
Lundazi, Eastern Province Zamiba.” African Studies Review 27: 83-96.
Drinkwater, M., M. McEwan, and F. Samuels. 2006. “The Effects of HIV/AIDS on
Agricultural Production Systems in Zambia: A Restudy 1993-2005.” International Food
Policy Research Institute.
Elder, S. 2010. Global Employment Trends for Youth. International Labor Organization.
Floro, Maria Sagrario. 1998. “Restructuring of Labor Markets in the Philipines and Zambia:
The Gender Dimension.” Journal of Developing Areas 33: 73-98.
Garbus, L. 2003. “Country AIDS Policy Analysis Project.” University of California San
Francisco.
Gatti, Roberta and Maddalena Honorati. 2008. “Informality Among Formal Firms: Firm Level,
Cross-Country Evidence on Tax Compliance and Access to Credit.” World Bank
Development Group. Policy Research Working Paper.
Hoppers, W. 1985. “New Perspectives for Rural Youth in Zambia.” Training for agriculture
and rural development 33: FAO Economic and Social Series.
International Labour Office. 2011. Global Employment Trends 2011. Geneva: ILO.
Ito, Chihiro. 2010. “The Role of Labor Migration to Neighboring Small Towns in Rural
Livelihoods: A Case Study in Southern Province, Zambia.” African Studies Quarterly
12: 45-73.
Jayne, T.S., J. Govereh, M. Wanzala, and M. Demeke. 2003. “Fertilizer market
development: a comparative analysis of Ethopia, Kenya, and Zambia.” Food Policy 28: 293-
316.
Jensen, P., and H.S. Nielsen. 1997. “Child labor and school attendance? Evidence from
Zambia.” Journal of Popular Economics, 10: 407-424.
Kannappan, Subbiah. 1985. “Urban Employment and the Labor Market in Developing
Nations.” Economic Development and Cultural Change 33: 699-730.
Kayizzi-Mugerwa, Steve. 1991. “External Shocks and Adjustment in a Mineral Dependent
Economy: A Short-Run Model for Zambia.” World Development 19: 851-865.
45. 45
Labor Statistics Branch of Zambia. 2010. Labor Force Survey Report: 2008. Lusaka: Central
Statistical Office.
Mason, N.M., A. Chapoto, T.S. Jayne, and R.J. Myers. 2007. “HIV/AIDS and Rural
Livelihoods in Zambia: A test of the new variant famine hypothesis. Department of
Agricultural Economics, Michigan State University.
Mushingeh, A., A. Mkandawire, M. Nkula, R. Chinkupula, R. Kalomo, and E. Nachinga. 2002.
“HIV/AIDS and child labour in Zambia: A Rapid assessment on the case of the Lusaka,
Copperbelt and Eastern Provinces.” United States Department of Labor, Paper No. 5.
Muula, A., E. Rudatsikira, and S. Siziya. 2010. Occupational Illnesses in the 2009 Zambian
labourforce survey. University of Malawi, Department of Health.
Ndubani, Phillimon, Joseph Kamanga, Joseph Simbaya, and Seter Siziya. 2009. “Female sex
workers in border and transportation routes with trend analysis 2000-2009.” Behavioral
Surveillance Survey Zambia, 2009: Round 4. Zambia Corridors of Hope HIV/AIDS
Prevention Initiative (COH II) with consultants.
Nelson, Joan. 1991. “Organized labor, politics, and labor market flexibility in developing
countries.” The World Bank Research Observer 6: 37-56.
Nielsen, H.S., and N. Westergård-Nielsen. 2001. “Returns to schooling in less developed
countries: new evidence from Zambia.” Economic Development and Cultural Change
49: 365-394.
Nyblade, L., P. Rohini, M. Sanyukta, M. Kerry, K. Ross, and B. Hailom. 2003. STIGMA:
Disentangling HIV and AIDS in Ethiopia, Tanzania and Zambia. International Center for
Research on Women.
Ogura, Mitsu. 1991. “Rural-Urban Migration in Zambia and Migrant Ties to Home Villages.”
The Developing Economies 29: 145-165.
Pottier, Johan. 1983. “Defunct Labor Reserve? Mambwe Villages in the Post-Migration
Economy.” Africa: Journal of the International African Institute 53: 2-23.
Söderbom, Måns and Francis Teal. 2003. “Are Manufacturing Exports the Key to Economic
Success in Africa?” Journal of African Economics 12: 1-29.
Taylor, Scott. 2006. Culture and Customs of Zambia. Westport, CT: Greenwood Press.
Tranberg-Hansen, Karen. 2010. “Changing Youth Dynamics in Lusaka’s Informal Economy in
the Context of Economic Liberalization.” Africa Studies Quarterly 11: 13-27.
UNAIDS. 2010. Aidsinfo Database. Joint United Nations Programme on HIV/AIDS.
<http://www.aidsinfoonline.org/>.
46. 46
United Nations. 2008. “Vulnerable Employment.” Methodology Sheets, Economic
Development. <http://www.un.org/esa/sustdev/natlinfo/indicators/methodology_sheets/econ_
development/vulnerable_employment.pdf>.
World Bank Doing Business Indicators. 2011. The World Bank. <http://www.doingbusiness.org/data>
World Development Indicators. 2010. The World Bank.
< http://data.worldbank.org/data-catalog/world-development-indicators?cid=GPD_WDI>.
Zambia Demographic and Health Survey Key Findings. 2007.
<http://www.measuredhs.com/pubs/pdf/FR211/FR211%5Brevised-05-12-
2009%5D.pdf>.
Zambia Society and Culture Complete Report. 2010. Petaluma, CA: World Trade Press.
Zambia Strategic Country Gender Assessment. 2004. The World Bank.