These are the summary results of a survey of over 40 college of business Deans. In it we explore what curricula and services they are offering to support student career development
1. Summary Report – CBA Dean’s Survey on Career & Professional Development
The College of Business Dean’s survey was developed to gather baseline information on current career
development activities being utilized by business schools to help undergraduate students secure post-
graduate employment. Specifically, I was interested in information on the inclusion of career
development curricula, and “in-house” career services programs.
To this end, a 34-question survey was developed and distributed to 220 College of Business Deans in the
US. All colleges were AACSB accredited and currently have at least one undergraduate business degree
program. In total, 44 responses were collected and analyzed.
This white paper is a summary of those results.
Environment
One-third of the colleges are located in what would be considered “college towns;” communities where
the University dominates the local economy. Just over 40% of colleges are located in communities that
had diverse economies with multiple industries and 58% of colleges have local access to employers with
more than 250 employees.
In a strong majority of colleges (88%), students enter the University as Freshman. Further, almost two-
thirds of colleges report they have some interaction with their students starting in the first year.
Average enrollment for the colleges surveyed is 3288. The smallest college has 311 students and the
largest program has 8479. In general, most colleges come in between 1000 and 5000 students.
Career Classes
Seventy percent of the schools responding offer career classes of some sort and of those, seventy
percent say their courses are required for all majors in the college. Sixty-five percent of colleges with
career classes require the completion of extra-curricular activity in their classes and of those who use it,
sixty percent say the activity is self-selected by students.
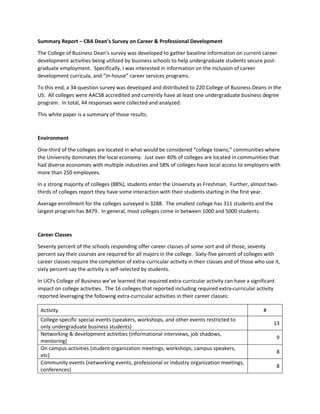
In UCFs College of Business we’ve learned that required extra-curricular activity can have a significant
impact on college activities. The 16 colleges that reported including required extra-curricular activity
reported leveraging the following extra-curricular activities in their career classes:
Activity #
College-specific special events (speakers, workshops, and other events restricted to
only undergraduate business students)
13
Networking & development activities (informational interviews, job shadows,
mentoring)
9
On campus activities (student organization meetings, workshops, campus speakers,
etc)
8
Community events (networking events, professional or industry organization meetings,
conferences)
8
2. Community service (volunteerism, special projects, service learning) 6
On campus leadership (special boards or councils, program directing, student
government)
5
Professional development at work (licenses, certifications, professional organizations,
job enlargement or special projects)
3
On average each program reported 3.25 activities.
Career Services
Not surprising, 97% of colleges reported that their students have access to a University-administered,
campus-wide career services department. Additionally, 78% of colleges have their own “in house”
career services support. The types of activity colleges of business offer to their students break down in
the following way:
Career
Coaching
College-
specific Events
Job Posting
System
College-
specific Fairs
Employer
Outreach
Percent of
CBAs w/ in-
house career
services that
offer this svc.
82% 93% 96% 71% 66%
For those colleges that offer special events for their students, 73% say attendance at college events is
better than average, but half of those who feel this way say that they tend to attract the same students
repeatedly.
Sixty-one percent of colleges with “in-house” career services offer at least four out of these five services.
One third of the colleges offer all five services.
Employment & Impressions
On average, colleges reported an average six-month employment rate of 83.2%. According to the
National Association of Colleges and Employers (NACE) Final Destination reports for 2016 and 2017,
approximately 81% of graduates were employed or pursuing graduate school six months after
graduation so these results, though self-reported, appear to have some validity. Responses ranged
between a low of 60% and a high of 98% with a standard deviation of 11.3. Almost all responses were
within the standard deviation.
In-house career services and programs fared better than University services with 61% of respondents
saying they are satisfied with what they do “in-house” versus 47% who say they are satisfied with what
the University does. Ultimately, 82% of respondents feel that their undergraduate students are
prepared and supported to achieve their post-graduate professional goals.
3. At the end of the survey, I asked for one thing that could be implement today to support your
undergraduate students. After reviewing responses, I categorized them four ways; programmatic,
curricular, resources, and aspirational. Of the 29 respondents who chose to make a comment, just over
40% had a programmatic request and 27.6% had curricular requests.
Programs and Curricula can be considered the “controllables” and accounted for 69% of the requests.
Only 20.7% of requests were for additional resources. Though not completely “uncontrollable,” budgets
are one thing that we can less directly influence. Our college of business has found that development
activity can be enhanced by linking career class extra-curricular activity and alumni and community
involvement.
Finally, three of the responses stood out because they were more “aspirational” than anything else:
• Get undergrads to start thinking about and working on career development earlier in college.
• Need to be sure that the jobs they take are indeed what they wanted -- and that they are happy.
We can, and soon will, provide more employment options to all students.
• Broader engagement by students in the opportunities we provide
This is the impetus for vision and strategy that is ultimately reflected in programs and curricula.
Analysis
To see if employment performance is more closely related to what we do or how we feel, I compared
responses from colleges that answered “Yes” to being satisfied with their “in-house” career services
programs and feeling their undergraduates are sufficiently prepared to those who answered “No” to
both of these questions. Twenty-two colleges feel they are doing well while six colleges responded in a
way that indicates they feel they are not.
On average, the “No” colleges are a little smaller; 2900 students versus 3500. However, there are large
and small colleges in both pools. Location doesn’t seem to be a differentiator; half of “No” colleges are
located in economies with diverse industries and/or large companies while roughly 60% of “Yes”
colleges are located similarly.
On the subject of career classes, 72.7% of the “Yes” colleges offer career classes and all of them require
those classes. On the other hand, only half of the colleges that answered “No” offer classes and of
those, only 33% (one respondent) say that their classes are required. In terms of curriculum, 75% of the
“Yes” colleges say that their class curriculum includes graded extra-curricular activity and just over half
of them say that the activity is self-selected by the student. For the “No” colleges, two-thirds say their
career class curriculum includes graded extra-curricular activity and none of them allow selection by the
student. This difference is reflected in the type and diversity of activities that their students complete.
The “Yes” colleges included examples of all types of activity with college-specific events and community
networking topping the list. On average, “Yes” colleges picked at least 2 activities from the list. For the
“No” colleges, activities are limited to college and campus activities and they only selected one activity.
4. Extra-Curricular Activity(ies) – select all that apply All “Yes” “No”
College-specific special events (speakers, workshops, and other events
restricted to only undergraduate business students)
25.0% 25.6% 50.0%
Networking & development activities (informational interviews, job
shadows, mentoring)
17.3% 18.0% 50.0%
On campus activities (student organization meetings, workshops,
campus speakers, etc)
15.4% 12.8% 0
Community events (networking events, professional or industry
organization meetings, conferences)
15.4% 15.4% 0
Community service (volunteerism, special projects, service learning) 11.5% 10.3% 0
On campus leadership (special boards or councils, program directing,
student government)
9.6% 10.3% 0
Professional development at work (licenses, certifications, professional
organizations, job enlargement or special projects)
5.8% 7.7% 0
In-house career services is another area where these two groups differ. Unlike career classes, a majority
of both groups offer some level of in-house career services; 86.3% of the “Yes” schools and 66.7% of the
“No” colleges. The differences lie in the types of services they offer. All colleges in both groups have a
job posting system and roughly three-quarters of colleges conduct college-specific job fairs. These
services are both less resource intensive than the others; in many cases job fairs are net revenue
generators and one of the main services offered to employers in the college/employer relationship
portfolio. Conversely, strong majorities of “Yes” colleges said they offered coaching services (94.7%)
and outreach to employers (81%) while minorities of the “No” colleges said they did (25% and 33%
respectively).
Coaching Events Job Posts Fairs Outreach
All CBAs 82% 93% 96% 71% 66%
“Yes” Colleges 95% 95% 100% 74% 81%
“No” Colleges 25% 75% 100% 75% 33%
Almost all (94.7%) of “Yes” colleges also said they provide college-specific events for their students while
75% of “No” colleges said they did. However, their main difference seems to be their satisfaction with
attendance at these events. Only one-third of “No” colleges felt their attendance was above average
and those tended to be the same students attending most events. On the other hand, 77.75% of the
“Yes” colleges felt their event attendance was above average.
Based on this comparison, it appears that the satisfaction doesn’t necessarily come from simply having
classes or offering services; it’s the format of the classes, the behaviors they drive, and types of services
that are offered that differentiates the respondents.
5. Employment
Ultimately, the goal of career-focused curriculum and programs is graduate employment. For colleges
responding “Yes” the average six-month employment rate is 87.2% with a low of 70%, high of 98%, and
standard deviation of 9.27. For “No” colleges that average is 73.5% with a low of 65%, high of 88%, and
standard deviation of 7.95%.
Adjusted for other factors in the survey (whether or not career classes and career services are offered),
employment numbers seem to be driven more by satisfaction than services.
6-month
Employment
High Low Std Dev
All CBAs 83.2% 98% 60% 11.3
“Yes” Colleges 87.2% 98% 78% 9.27
“No” Colleges 73.5% 88% 65% 7.95
Has Career Class 82.4% 98% 60% 11.4
Has Career Svcs 83.9% 98% 60% 10.7
Conclusion
Programs Curriculum Resource requests Aspirational
All Responses 41.4% 27.6% 20.7% 10.3%
“Yes” Colleges 43.7% 18.7% 31.3% 6.25%
“No” Colleges 60.0% 20.0% 20.0% 0.0%
The purpose of this report is not to offer curricular or programmatic recommendations. Further analysis
of the data collected is required and ultimately, the culture of a college and diversity of its offerings
come down to decisions made by a college’s leadership and faculty based on a variety of factors
including student demographics, physical location, an institutional needs assessment, and availability of
resources. However, it does appear that colleges that are satisfied with their performance are doing
things differently from those that aren’t and feel better about the post-graduation prospects of their
graduates.
Fortunately, our industry not only provides substantial opportunities for practice-sharing but embraces a
culture of collegiality and collaboration that doesn’t always exist in the industries hiring our students.
We are not each other’s competition in as much as we are each other’s benchmarks. By engaging each
other on this topic at every opportunity, we can learn more about each other, do more with the
resources we have, and ultimately have a positive impact on the professional lives of our students. I
hope this survey is the impetus for many productive conversations in the future!