Formation of diamonds in laser-compressed hydrocarbons at planetary interior ...
Poster_v2
1. Infrared Spectroscopy on Phosphorus Ices: Sample Mount Creation
Logan Breton and Heather Abbott-Lyon
Department of Chemistry and Biochemistry, Kennesaw State University, Kennesaw, GA 30144
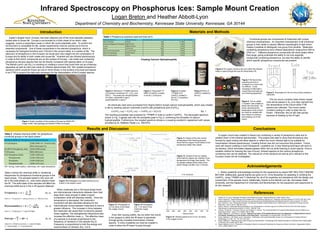
Materials and Methods
References
Jupiter’s largest moon, Europa, has been deemed one of the most plausible planetary
bodies able to house life. Europa is surrounded by a thick sheet of ice which, data
suggests, covers a subsurface ocean in which life could potentially exist. To confirm the
environment is compatible for life, certain experiments must be carried out to find its
essential components. One of these components is the element phosphorus, which is
necessary for biological functions and, if found in the correct ratios, is a marker of life. The
discovery of phosphorus in the Europan ice would give new insight into the composition of
Europa and its ability to both create and house life. Scientist will use infrared spectroscopy
in order to find which compounds are on the surface of Europa. Lab made ices containing
phosphorus will give spectra that can be directly compared with spectra taken on Europa.
The Abbott-Lyonn Lab (ALL) is working on creating a mount that could both act as a freezing
apparatus as well as hold ices inside an infrared spectrometer (IR). We created phosphorus
solutions which would be frozen as ices to mimic those on the surface of Europa and placed
in an FTIR to acquire the data sets necessary for the interpretation of the Europan spectra.
1. Carlson, R. W., et al. "Hydrogen Peroxide on the Surface of Europa." Science 283.5410 (1999): 2062-4. Print.
2. Hazen, Robert M. "Paleomineralogy of the Hadean Eon: A Preliminary Species List." American Journal of Science 313 (2013): 807-843. Print.
3. Image adapted from: https://www2.chemistry.msu.edu/faculty/reusch/virttxtjml/Spectrpy/InfraRed/infrared.htm Date accessed: 7/21/2016
4. Kee, Terence P., et al. "Phosphate Activation Via Reduced Oxidation State Phosphorus (P). Mild Routes to Condensed-P Energy Currency
Molecules." Life 3.3 (2013): 386-402. Print.
5. Marion, Giles M. "Carbonate Mineral Solubility at Low Temperatures in the Na-K-mg-Ca-H-Cl-SO4-OH-HCO3-CO3-CO2-H2O System."
Geochimica et Cosmochimica Acta 65.12 (2001): 1883-96. Print.
6. Orlando, Thomas M., Thomas B. McCord, and Gregory A. Grieves. "The Chemical Nature of Europa Surface Material and the Relation to a
Subsurface Ocean." Icarus 177.2 (2005): 528-33. Web.
7. Pasek, Matthew A., and Dante S. Lauretta. "Aqueous Corrosion of Phosphide Minerals from Iron Meteorites: A Highly Reactive Source
of Prebiotic Phosphorus on the Surface of the Early Earth." Astrobiology 5.4 (August 2005): 515-535. Print.
8. Pasek, Matthew A., MA Pasek, and R. Greenberg. "Acidification of Europa's Subsurface Ocean as a Consequence of Oxidant Delivery."
Astrobiology 12.2 (02): 151; 151,159; 159. Print.
9. Pasek, Matthew A. "Rethinking Early Earth Phosphorus Geochemistry." Proceedings of the National Academy of Sciences of the United States
of America 105.3 (2008): 853-8. Web.
10. Pasek, Matthew A, et al. "Production of Potentially Prebiotic Condensed Phosphates by Phosphorus Redox Chemistry." Angewandte Chemie
120.41 (2008): 8036-8. Print.
Introduction
Results and Discussion
L. Breton gratefully acknowledges funding for this experience by award NSF-REU KSU CBSURE
#431408. Additionally, special thanks are given to Dr. Chris Alexander for assisting in verifying the
CaHPO3 using 31PNMR and TJ Beckman for all of his expertise and assistance with the design and
construction of the sample mount. Additionally, thanks to the Abbott-Lyon lab, Kennesaw State
University, and the Department of Chemistry and Biochemistry for the equipment and opportunity to
do this research.
Acknowledgements
Conclusions
A copper mount was created to freeze ices containing a variety of phosphorus salts and to
position them in the infrared spectrometer. This project was able to show that amorphous ices
formed by rapid cooling will either absorb or reflect too much infrared light to be suitable for
transmission infrared spectroscopy. Creating thinner ices did not overcome this problem. Future
work will require creating a more transparent, crystalline ice. A new freezing technique will have to
be develop, which eliminates trapped gasses within the ice while freezing to avoid opacity. Once a
suitable method for freezing the ices is found, infrared spectra on the various phosphorus-
containing ices can be obtained. The natural pH of the solutions as well as pH’s relevant to the
Europan ocean will be investigated.
Figure 1 Artist’s rendition of the surface of Europa by NASA/JPL.
Image Credit: http://geology.com/stories/13/life-on-europa/
Table 1 Phosphorus solutions used and their pH’s
Functional groups are components of molecules with unique
chemical characteristics. An important characteristic of all functional
groups is their ability to absorb different wavelengths of light which
makes it possible to distinguish one group from another. Molecules
containing phosphorus have infrared absorptions ranging from 900 to
2700 cm-1. Different phosphorus compounds will show peaks within
that range, giving scientists the ability to not only separate
compounds containing phosphorus, but also the ability to identify
which specific phosphorus compounds are present.
Figure 6 The copper mount is set up to allow the infrared
beam to pass through the ices for transmission IR.
Table 2 Infrared chemical shifts* for phosphorus
functional groups in the liquid phase.3
𝑭𝒓𝒆𝒒𝒖𝒆𝒏𝒄𝒚 = 𝝊 =
𝟏
𝟐𝝅
𝒌
𝝁
Eq. (2)
where υ = frequency, k = spring constant , μ = effective mass
𝑾𝒂𝒗𝒆𝒏𝒖𝒎𝒃𝒆𝒓𝒔 = 𝝊 =
𝝊
𝒄
∗
𝟏 𝒎
𝟏𝟎𝟎 𝒄𝒎
Eq. (3)
where υ = frequency, c = speed of light
𝑬𝒏𝒆𝒓𝒈𝒚 =
𝒉𝒄
𝝀
= 𝒉 𝝊 ∗ 𝒄 Eq. (4)
where h = Plank’s constant, c = speed of light,
λ = wavelength, 𝜐 = wavenumbers
Figure 10 Photograph of a water solution as it is
frozen in the copper mount.
Creating Calcium Hydrophosphite
Figure 2 Reference 31P NMR spectrum
of a solution containing Fe2+, H2O2, and
HPO3
2-. The peaks are orthophosphate
(6.5 ppm), phosphite (4 ppm),
pyrophosphate (-4 ppm).9
Figure 3 Decoupled 31P
NMR of CaHPO3 created
in the ALL (3.80 ppm).
All chemicals used were purchased from Sigma Aldrich except calcium hydrophosphite, which was created
in lab by reacting calcium hydroxide (CaOH) with phosphorus acid (H3PO3).
𝐶𝑎 𝑂𝐻 2 𝑎𝑞 + 𝐻3 𝑃𝑂3 𝑎𝑞 → CaHPO3 (s) + 2H2O (l) Eq. 1
The resulting precipitate was analyzed by 31PNMR in order to confirm CaHPO3. The decoupled spectrum
shown in Fig. 3 agrees well with the phosphite peak in Fig. 2, confirming the formation of calcium
hydrophosphite. Furthermore, the coupled spectrum shows a J-coupling constant in agreement with values
provided by Dr. Matthew Pasek (i.e., 550-670).
Figure 5 Photo of
CaHPO3 created by
the ALL.
Figure 4 Coupled
31P NMR of of
CaHPO3 created in
the ALL (J-coupling =
570 Hz).
Table 2 shows the chemical shifts or vibrational
frequencies for phosphorus functional groups in the
liquid phase. The samples tested in this work will
be in the solid phase (i.e., ices) when placed inside
the IR. The solid state of the samples will affect the
chemical shifts found in the in IR spectra obtained.
When molecules are in the liquid phase there
are intermolecular interactions between them that
keep them close enough to attain a liquid
composition while still allowing mobility. Once the
temperature is decreased, the molecule’s
movement will also decrease allowing for the
intermolecular forces between molecules to have a
greater influence. The increase in force between
the molecules will cause them to become packed
closer together. The strengthened interactions also
increase the effective mass, μ. The effective mass
of a sample is inversely proportional to the
frequency of vibrations in the sample (Eq.2).
Frequency is proportional to both the energy and
wavenumbers of vibration (Eq. 3 & 4).
Figure 7 We found that
exporting ice from a
container to a mount was
too difficult. It was
necessary to fabricate a
mount that could also act
as a freezing apparatus.
Figure 8 The so-called
“L-System” was created to
freeze the ices slowly. By
slowly decreasing the
temperature more uniform
ice could be created with
less chance of cracking
and breaking out of the
mount.
Figure 9 Schematics for the ice mount were created in
LibreCAD.
Even with varying widths, the ice within the mount
is too opaque to allow the IR beam to penetrate
through giving unusable transmission infrared
spectra. A more crystalline ice must be created in
order to allow the IR beam to pass through.
y = 2.2976x - 13.392
R² = 0.9563-16
-14
-12
-10
-8
-6
-4
-2
0
2
4
0 1 2 3 4 5 6 7 8
Temperature(ºC)
Time (Minute)
Copper Mount Ice Melting
y = -3.2932x + 24.591
R² = 0.9838
-25
-20
-15
-10
-5
0
5
10
15
20
25
30
0 2 4 6 8 10 12 14
Temperature(ºC)
Time (Minute)
Copper Mount Ice Freezing
y = -1.3319x + 20.021
R² = 0.9553
-15.0
-10.0
-5.0
0.0
5.0
10.0
15.0
20.0
25.0
0 5 10 15 20 25
Time(Minute)
Temperature (ºC)
Plastic Flange Cap Ice Freezing
y = 2.0206x - 2.2024
R² = 0.6572
-8.0
-6.0
-4.0
-2.0
0.0
2.0
4.0
6.0
8.0
10.0
12.0
0 1 2 3 4 5 6 7
Time(Minute)
Temperature (ºC)
Plastic Flange Cap Ice Melting
Figure 11 Graphs of the time versus
temperature of the freezing process
show that the copper mount attains a low
temperature faster than plastic.
Figure 12 Graphs of the ice melting
show that the copper can maintain a low
temperature for longer than plastic. The
ice started melting off the sides of the
plastic flange cap after only 2 minutes.
Figure 14 Photograph
of a 1 mL block of ice
inside the copper
mount.
Figure 13 Photograph of
a 4 mL block of ice inside
the copper mount.
Figure 15 Infrared spectrum of a 4 mL ice block
in the copper mount.
*Str= strong, med=medium, shp=sharp, wk= weak absorptions
The ice mount contains holes where copper
rods will be placed in N2 (l) to help maintain the
low temperature of the mount while FTIR
spectra are collected. The mount needs
constant cooling in order to keep the ice
frozen. Otherwise, the ice will melt quickly
because of heating by the IR light.