[Research] Detection of MCI using EEG Relative Power + DNN
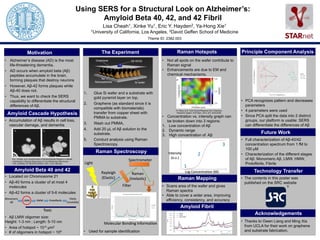
Amyloid Beta Poster
1. Using SERS for a Structural Look on Alzheimer’s:
Amyloid Beta 40, 42, and 42 Fibril
Lisa Cheah1, Xinke Yu1, Eric Y. Hayden2, Ya-Hong Xie1
1University of California, Los Angeles, 2David Geffen School of Medicine
Theme ID: 2382.003
• Alzheimer’s disease (AD) is the most
life-threatening dementia.
• AD occurs when amyloid beta (Aβ)
peptides accumulate in the brain,
forming plaques that destroy neurons
• However, Aβ-42 forms plaques while
Aβ-40 does not.
• Thus, we want to check the SERS
capability to differentiate the structural
differences of Aβ.
• Accumulation of Aβ results in cell loss,
vascular damage, and dementia
• Located on Chromosome 21
• Aβ-40 forms a cluster of at most 4
molecules
• Aβ-42 forms a cluster of 5-6 molecules
• Aβ LMW oligomer size:
Height: 1-3 nm ; Length: 5-10 nm
• Area of hotspot ~ 10-5 μm2
• # of oligomers in hotspot ~ 104
Motivation
1. Glue Si wafer and a substrate with
gold pyramid layer on top.
2. Graphene (as standard since it is
compatible with biomaterials)
transfer from copper sheet with
PMMA to substrate.
3. Wash out PMMA.
4. Add 20 μL of Aβ solution to the
substrate.
5. Conduct analysis using Raman
Spectroscopy.
• Used for sample identification
The Experiment
• Not all spots on the wafer contribute to
Raman signal
• Enhancements are due to EM and
chemical mechanisms.
• Concentration vs. intensity graph can
be broken down into 3 regions:
1. Low concentration of Aβ
2. Dynamic range
3. High concentration of Aβ
• Scans area of the wafer and gives
Raman spectra
• Able to cover a wider area, improving
efficiency, consistency, and accuracy
Raman Hotspots
• PCA recognizes pattern and decreases
parameters
• 4 parameters were used
• Since PCA split the data into 2 distinct
groups, our platform is usable: SERS
can differentiate the differences of Aβ
• Full characterization of Aβ-40/42
concentration spectrum from 1 fM to
100 μM
• Characterization of the different stages
of Aβ: Monomeric Aβ, LMW, HMW,
Protofibrils, Fibrils
• The contents in this poster was
published on the SRC website
• Thanks to Owen Liang and Ming Xia
from UCLA for their work on graphene
and substrate fabrication.
Principle Component Analysis
Amyloid Cascade Hypothesis
Raman Spectroscopy
Technology Transfer
Acknowledgements
R.H. Christie, et al. Growth Arrest of Individual Senile Plaques in a Model
of Alzheimer’s Disease Observed by In Vivo Multiphoton Microscopy.
THE JOURNAL OF NEUROSCIENCE. 2001, 21(3), 858-864.
Amyloid Beta 40 and 42
Monomeric
Aβ
LMW HMW Protofibrils
Fibrils
(insoluble)
Toxic
Pu Wang, et al. Giant Optical Response from Graphene-
Plasmonic System. ACS Nano. 2012, 6(7), 6244-6249.
Future Work
Log Concentration (M)
Intensity
(a.u.)
1
2
3
Filter
Rayleigh
(Elastic)
Light
Raman
(Inelastic)
Spectrometer
Molecular Bonding Information
Raman Mapping
Amyloid Fibril
Si wafer
Au
Nanoparticles
Graphene Aβ 40/42
AB 40
AB 42
AB 42 Fibril