1. BACKGROUND
Conductivity is a measure of how well a solution
conducts electricity. To carry a current a solution must
contain charged particles, or ions. Most conductivity
measurements are made in aqueous solutions, and
the ions responsible for the conductivity come from
electrolytes dissolved in the water. Salts (like sodium
chloride and magnesium sulfate), acids (like
hydrochloric acid and acetic acid), and bases (like
sodium hydroxide and ammonia) are all electrolytes.
Although water itself is not an electrolyte, it does have
a very small conductivity, implying that at least some
ions are present. The ions are hydrogen and hydroxide,
and they originate from the dissociation of molecular
water. See Figure 1.
Conductivity is not specific. It measures the total
concentration of ions in solution. It cannot distinguish
one electrolyte or ion from another.
Not all aqueous solutions have conductivity. Solutions
of non-electrolytes, for example sugar or alcohol, have
no conductivity because neither sugar nor alcohol
contains ions nor do they produce ions when
dissolved in water.
APPLICATIONS OF CONDUCTIVITY
Conductivity measurements are widely used in industry.
Some important applications are described below.
• Water treatment. Raw water as it comes from a lake,
river, or the tap is rarely suitable for industrial use. The
water contains contaminants, largely ionic, that if not
removed will cause scaling and corrosion in plant
equipment, particularly in heat exchangers, cooling
towers, and boilers. There are many ways to treat
water, and different treatments have different goals.
Often the goal is demineralization, which is the
removal of all or nearly all of the contaminants. In
other cases the goal is to remove only certain contam-
inants, for example hardness ions (calcium and
magnesium). Because conductivity is a measure of
the total concentration of ions, it is ideal for monitoring
demineralizer performance. It is rarely suitable for
measuring how well specific ionic contaminants are
being removed.
Conductivity is also used to monitor the build up of
dissolved ionic solids in evaporative cooling water
systems and in boilers. When the conductivity gets
too high, indicating a potentially harmful accumula-
tion of solids, a quantity of water is drained out of the
system and replaced with water having lower conductivity.
• Leak detection. Water used for cooling in heat
exchangers and surface condensers usually contains
large amounts of dissolved ionic solids. Leakage of
the cooling water into the process liquid can result in
potentially harmful contamination. Measuring conduc-
tivity in the outlet of a heat exchanger or in the con-
denser hotwell is an easy way of detecting leaks.
• Clean in place. In the pharmaceutical and food and
beverage industries, piping and vessels are periodical-
ly cleaned and sanitized in a procedure called clean-
in-place (CIP). Conductivity is used to monitor both the
concentration of the CIP solution, typically sodium
hydroxide, and the completeness of the rinse.
• Interface detection. If two liquids have appreciably
different conductivity, a conductivity sensor can detect
the interface between them. Interface detection is
important in a variety of industries including chemical
processing and food and beverage manufacturing.
• Desalination. Drinking water desalination plants,
both thermal (evaporative) and membrane (reverse
osmosis), make extensive use of conductivity to moni-
tor how completely dissolved ionic solids are being
removed from the brackish raw water.
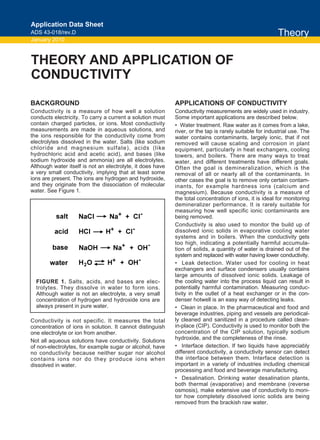
THEORY AND APPLICATION OF
CONDUCTIVITY
Theory
Application Data Sheet
ADS 43-018/rev.D
January 2010
FIGURE 1. Salts, acids, and bases are elec-
trolytes. They dissolve in water to form ions.
Although water is not an electrolyte, a very small
concentration of hydrogen and hydroxide ions are
always present in pure water.
NaCl Na+ + Cl-
salt
acid HCl H+ + Cl-
base NaOH Na+ + OH-
water H2O H+ + OH-
2. 2 Rosemount Analytical
UNITS
The units of conductivity are siemens per cm (S/cm).
Derived units are µS/cm (one millionth of a S/cm) and
mS/cm (one thousandth of a S/cm). S/cm is the same
as the older unit mho/cm. Certain high purity water
industries, primarily semiconductor and pharmaceuti-
cal, use resistivity instead of conductivity. Resistivity is
the reciprocal of conductivity. The units are MΩ cm.
Figure 2 shows the approximate conductivity of some
typical electrolyte solutions.
MEASUREMENT OF CONDUCTIVITY
There are two types of conductivity measurement:
contacting and inductive. The choice of which to use
depends on the amount of conductivity, the corrosiveness
of the liquid, and the amount of suspended solids.
Generally, the inductive method is better when the
conductivity is high, the liquid is corrosive, or suspended
solids are present.
Contacting Conductivity
Most contacting conductivity sensors consist of two
metal electrodes, usually stainless steel or titanium, in
contact with the electrolyte solution. See Figure 3. The
analyzer applies an alternating voltage to the elec-
trodes. The electric field causes the ions to move back
and forth producing a current. Because the charge
carriers are ions, the current is called an ionic current.
The analyzer measures the current and uses Ohm’s
law to calculate the resistance of the solution (resis-
tance = voltage/current). The conductance of the solu-
tion is the reciprocal of the resistance.
The ionic current depends on the total concentration of
ions in solution and on the length and area of the solu-
tion through which the current flows. The current path
is defined by the sensor geometry, or cell constant,
which has units of 1/cm (length/area). Multiplying the
conductance by the cell constant corrects for the effect
of sensor geometry on the measurement. The result is
the conductivity, which depends only on the concen-
tration of ions.
Although the cell constant has a geometric interpreta-
tion (length divided by area), it is rarely calculated
from dimensional measurements. In most designs the
electric field is not confined between the electrodes,
so the actual length and area are greater than predict-
ed. In practice, the cell constant is measured against a
solution of known conductivity. The cell constant is the
ratio of the known conductivity (µS/cm) to the mea-
sured conductance (µS).
The usual conductivity range for a contacting sensor is
0.01 to 50,000 uS/cm. Because a given cell constant
can be used only over a limited range, two, possibly
three, cell constants are required to cover the entire
range. Common cell constants are 0.01/cm, 0.10/cm,
1.0/cm, and 10/cm. Higher conductivity samples
require larger cell constants.
Typically, the cell constant is measured at the factory,
and the user enters the value in the analyzer when the
sensor is first put in service. Cell constants change
very little during the life of the sensor; however, the
cell constant should be periodically checked, and
the sensor recalibrated if necessary.
Some contacting sensors have four electrodes. See
Figure 4. In the four electrode measurement, the ana-
lyzer injects an alternating current through the outer
electrodes and measures the voltage across the inner
electrodes. The analyzer calculates the conductance
of the electrolyte solution from the current and voltage.
Because the voltage measuring circuit draws very little
current, charge transfer effects at the metal-liquid
interface are largely absent in four-electrode sensors.
As a result, a single four-electrode sensor has a much
wider dynamic range than a two-electrode sensor,
roughly 1 to 1,4000,000 µS/cm. Like the two-electrode
sensor, the four-electrode sensor has a cell constant,
which depends on the area, spacing, and arrangement
of the current and voltage electrodes.The cell constant
.01 .1 1 10 100 1 10 100 1
µS/cm µS/cm µS/cm µS/cm µS/cm mS/cm mS/cm mS/cm S/cm
I I I I I I I I I
Ultra
Pure Water
Good Quality
Distilled Water
Excellent
Quality
Raw Water
.05% NaCl
Sea Water
30% H2SO4
FIGURE 2. The graph shows the conductivity of
pure water, distilled water, and typical electrolytes
at 25°C. Distilled water has greater conductivity than
pure water, because it is always contaminated with
atmospheric carbon dioxide, which dissolves in
water to form the weak electrolyte, carbonic acid.
FIGURE 3. In the two electrode conductivity mea-
surement, the motion of ions in the electric field
carries current through the solution. Coupling of
the ionic and electronic current occurs at the inter-
face between the metal electrode and the solution.
The interface can be thought of as a capacitor with
the metal electrode being one plate and the adja-
cent electrolyte being the other. The alternating
voltage causes the capacitor to charge and dis-
charge, allowing the current to cross the interface.
electrolyte solution
electrodes
A
electronic
current
ACvoltage
ionic
current
+
3. Rosemount Analytical 3
is measured at the factory, and the user enters the
value in the analyzer at startup.
Contacting conductivity measurements are restricted
to applications where the conductivity is fairly low
(although four-electrode sensors have a higher end
operating range) and the sample is non-corrosive and
free of suspended solids. Two-electrode sensors are
ideal for measuring high purity water in semi-conductor,
steam electric power, and pharmaceutical plants.
Inductive Conductivity
Inductive conductivity is sometimes called toroidal or
electrodeless conductivity. An inductive sensor con-
sists of two wire-wound metal toroids encased in a
corrosion-resistant plastic body. One toroid is the drive
coil, the other is the receive coil. The sensor is
immersed in the conductive liquid. The analyzer
applies an alternating voltage to the drive coil, which
induces a voltage in the liquid surrounding the coil.
The voltage causes an ionic current to flow proportion-
al to the conductance of the liquid. The ionic current
induces an electronic current in the receive coil, which
the analyzer measures. The induced current is directly
proportional to the conductance of the solution. See
Figure 5.
The current in the receive coil depends on the number
of windings in the drive and receive coils and the physical
dimensions of the sensor, which defines the volume of
sample through which the ionic current flows. The
number of windings and the dimensions of the sensor
are described by the cell constant. As in the case of
contacting sensors, the product of the cell constant
and conductance is the conductivity.
The walls of the tank or pipe in which the sensor is
installed also influence the cell constant—the so-called
wall effect. A metal (conducting) wall near the sensor
increases the induced current, leading to increased
conductance and a corresponding decrease in the cell
constant. A plastic or insulating wall has the opposite
effect. Normally, wall effects disappear when the dis-
tance between the sensor and wall reaches roughly
three-fourths of the diameter of the sensor. See Figure
6. Because some degree of wall effect is present in
most installations, factory-determined cell constants are
of little use. For accurate results, the user must calibrate
the sensor in place in the process piping.
The inductive measurement has several benefits.
First, the toroids do not need to touch the sample.
Thus, they can be encased in plastic, allowing the
sensor to be used in solutions that would corrode
metal electrode sensors. Second, because inductive
sensors tolerate high levels of fouling, they can be
used in solutions containing high levels of suspended
solids. As long as the fouling does not appreciably
change the area of the toroid opening, readings will be
accurate. By contrast, even a light coating of deposit
on a contacting sensor will cause an error. Finally,
inductive sensors are ideal for measuring solutions
having high conductivity. High conductivity solutions
produce a large, easily measured induced current in
the receive coil.
Inductive sensors do have drawbacks. Chiefly, they
are restricted to samples having conductivity greater
than about 15 µS/cm. They cannot be used for
measuring low conductivity solutions.
current
electrodes
voltage
electrodes
V
current
electrode
current
electrode
FIGURE 4. In the four electrode conductivity mea-
surement, the analyzer injects current between the
outer electrodes and measures the voltage drop
caused by the resistance of the electrolyte
between the inner electrodes.
apparent
conductivity
distance to wall
metal walls
plastic walls
3/4 of sensor
diameter
FIGURE 6. For typical sensors, wall affects disap-
pear when the clearance between the sensor and
wall is 1 – 1 ½ in (25 – 37 mm).
drive receive
toroid
wire
ionic current
in sample
analyzer measures
current induced in
the receive coil
analyzer
generates AC
drive voltage
FIGURE 5. Both coils are encased in a single sensor
body and overmolded with plastic. The coils must be
completely submerged in the process liquid.
4. 4 Rosemount Analytical
TEMPERATURE AND CONDUCTIVITY
Increasing the temperature of an electrolyte solution
always increases the conductivity. The increase is
significant, between 1.5 and 5.0% per °C. To compen-
sate for temperature changes, conductivity readings
are commonly corrected to the value at a reference
temperature, typically 25°C. All process conductivity
sensors have integral temperature sensors that allow
the analyzer to measure the process temperature and
correct the raw conductivity. Three temperature cor-
rection algorithms are in common use.
• Linear temperature coefficient
• High purity water or dilute sodium chloride
• Cation conductivity or dilute hydrochloric acid
No temperature correction is perfect. Unless the com-
position of the process liquid exactly matches the
model used in the correction algorithm, there will be
an error. In addition, errors in the temperature
measurement itself will lead to errors in the corrected
conductivity.
Linear temperature coefficient
The linear temperature correction is widely used. It is
based on the observation that the conductivity of an
electrolyte changes by about the same percentage for
every °C change in temperature. The equation is
C25 is the calculated conductivity at 25°C, Ct is the raw
conductivity at t°C, and α is the linear temperature
coefficient expressed as a decimal fraction. Although a
single temperature coefficient can be used with rea-
sonable accuracy over a range of 30° or 40°C, accura-
cy can be improved by calculating a coefficient specifi-
cally for the sample temperature. Approximate ranges
for linear temperature coefficients are shown below:
High purity water
The high purity water correction assumes the sample
is pure water contaminated with sodium chloride
(NaCl). The measured conductivity is the sum of the
conductivity from water and the conductivity from the
sodium and chloride ions.
Figure 7 also shows how the high purity water correc-
tion works. Point 1 is the raw conductivity. The first
step is to subtract the conductivity of pure water at the
measurement temperature from the raw conductivity.
The result is point 2, the conductivity of sodium and
chloride. Next, the conductivity of sodium and chloride
is converted to the value at 25°C, point 3. Finally, the
conductivity of pure water is added to the result to give
the corrected conductivity at 25°C, point 4.
Cation conductivity
The cation conductivity temperature correction is
unique to the steam electric power industry. Cation
conductivity is a way of detecting ionic contamination
in the presence of background conductivity caused by
ammonia or neutralizing amines, which are added to
the condensate and feedwater to elevate the pH and
reduce corrosion. In cation conductivity, the amines
are removed and the ionic contaminant is converted
to the equivalent acid, for example sodium chloride is
converted to hydrochloric acid.
The cation conductivity model assumes the sample is
pure water contaminated with hydrochloric acid. The
correction algorithm is more complicated than the
high purity water correction because the contribution
of water to the overall conductivity depends on the
amount of acid present. Hydrochloric acid suppress-
es the dissociation of water, causing its contribution
to the total conductivity to change as the concentra-
tion of hydrochloric acid changes.
CALIBRATION
There are two ways to calibrate conductivity sensors.
The sensor can be calibrated against a solution of
known conductivity or it can be calibrated against a
previously calibrated sensor and analyzer. Normally,
the sensor should be calibrated at a point near the
midpoint of the operating range calibration changes
the cell constant.
Calibration against a standard solution
Calibration against a standard solution is straightfor-
ward. Place the sensor in the standard and adjust the
analyzer reading to match the known conductivity. To
eliminate temperature related errors, disable tempera-
ture compensation and calibrate using the conductivity
acids 1.0 – 1.6 % per °C
bases 1.8 – 2.2 % per °C
salts 1.8 – 3.0 % per °C
FIGURE 7. The total conductivity is the sum of the
conductivity from water and sodium chloride ions.
The large increase in the conductivity of water as
temperature increases is caused primarily by the
increased ionization of water at high temperature.
C25 =
Ct
––––––––
1 + α(t-25)
5. of the standard at the measurement temperature.
Most conductivity standards are solutions of potassium
chloride, so even if temperature and conductivity data
are not on the label, the data are readily available in
reference books.
Conductivity standards are susceptible to contamination
from atmospheric carbon dioxide. Carbon dioxide
dissolves in water forming carbonic acid and increas-
ing the conductivity by as much as 1.5 µS/cm. To
minimize contamination errors, avoid using standards
with conductivity less than about 150 µS/cm.
Calibration against a referee sensor
and analyzer
The best way to calibrate a process sensor against a
referee is let the process liquid flow through the
sensors connected in series and adjust the process
reading to match the referee analyzer. Turning off
temperature compensation in both analyzers elimi-
nates temperature compensation errors. To ensure
the temperature is the same at both sensors, keep
sample flow high and tubing runs short. Use clean
interconnecting tubing to avoid contamination.
Because the system is protected from atmospheric
contamination, the method is ideal for calibrating
sensors used to measure low conductivity samples.
An alternative procedure is to take a grab sample of
the process liquid and measure its conductivity in the
shop or laboratory. Because the sample temperature
is likely to change during the measurement, tempera-
ture compensation is required. It is important that the
temperature measurement in both the process and
referee analyzers be accurate and that the tempera-
ture correction algorithms be identical. Grab sample
calibration is, of course, unsuitable for samples having
low conductivity.
MEASURING CONCENTRATION
Although conductivity is non-specific, if certain
conditions are met, it can be used to measure the
concentration of electrolyte solutions. Examples are
measuring the concentration of CIP (clean in place)
chemicals and measuring the concentration of acid
and caustic solutions used to regenerate ion exchange
demineralizers.
To infer concentration from conductivity several
requirements must be met:
1. The liquid must contain a single electrolyte or the
electrolyte of interest must be the major contributor to
the conductivity. For example, when cation exchange
resin is regenerated with sulfuric acid, the concentrat-
ed acid is diluted with service water to between 2 and
12% (90,000 to 490,000 µS/cm). The highest the ser-
vice water conductivity is likely to be is 800 µS/cm,
making the worst case error about 1%.
2. There must be a measurable change in conductivity
over the concentration range, and the conductivity
must be increasing or decreasing over the range.
Figure 8 shows a graph of conductivity versus
concentration for a typical electrolyte and the range
over which concentration can be inferred from con-
ductivity. Not all curves have the maximum shown
in the graph, but many do. Some electrolytes, for
example, sulfuric acid, have curves with two maxima.
3. Sufficient data must be available to allow a
temperature coefficient to be estimated. If the data
are not available in reference books, they must be
determined experimentally.
SENSORS, ANALYZERS, AND TRANSMITTERS
Rosemount Analytical offers contacting and inductive
sensors, analyzers, and transmitters to meet most
industrial needs and applications. For more informa-
tion consult the product data sheets listed below and
on the next page.
measurable measurable
CONTACTING SENSORS (All two-electrode except 410VP)
Model Description PDS
140 General purpose, retractable 71-140 series
141 General purpose, screw in 71-140 series
142 General purpose, screw in 71-140 series
400 and 400VP General purpose, screw in 71-400
402 and 402VP General purpose, retractable 71-400
403 and 403VP Sanitary flange 71-403
404 Flow through 71-400
410VP Four-electrode sanitary flange 71-410VP
INDUCTIVE (TOROIDAL) SENSORS
Model Description PDS
225 Sanitary flange 71-225
226 General purpose, large toroid opening 71-226/228
228 General purpose, small toroid opening 71-226/228
222 Flow through w/bolted flange connections 71-222
242 Flow through w/bolted flange connections 71-242
245 Flow through with sanitary connections 71-245
Rosemount Analytical 5
FIGURE 8. Conductivity can be used to measure
concentration over either of (but not both of) the
two ranges shown.