SlideShare a Scribd company logo
1 of 1
Aims & Objectives
Aims:
- To investigate expression levels of various cytokines such as TNF-α and IL-6
- To investigate expression of TLR2, TLR4 and NOD2
- To Investigate the effects of LPS stimulation on receptor and cytokine expression
Objectives:
 Culture a cell line of J774 murine macrophages
 Stimulate J774 cell cultures with Lipopolysaccharide
 Extract RNA from J774 cells using the Phenol-chloroform extraction method
 Investigate the purity and quantity of extract RNA via Biophotometry
 Quantify extracted RNA through RT-PCR using specifically designed primers
 Optimise the RT-PCR technique to produce high quality results on an agarose gel
 Prepare and run gel electrophoresis to identify and visualise various DNA fragments to determine
levels of cellular expression of various cytokines
Materials & Methods
Cell Culturing
Two flasks of J774 Macrophage cultures were used, these flasks sub-cultured into three samples; a control, baseline and an LPS incubated sample. The LPS
incubated cell sample was inoculated by adding 1µg/ml of LPS and incubating the sample for 24 hours.
Cell counts were carried out to further prove confluency and viability of each cell sample using a haemocytometer.
RNA extraction & Biophotometry
Phenol-chloroform extraction method was used to extract total RNA from all three cell samples. Biophotometry was used to test the purity and
concentration of each sample, alongside the Biophotometer readings an RNA agarose gel electrophoresis was run to further confirm the purity and
concentration of the total RNA in each sample.
Primer Design & RT-PCR
Primers were designed against the desired gene coding sequence using NCBI software tools such as GenBank™. Primer3 was used to design primer
sequences against this gene, and lastly Primer-BLAST was used to find out further information about the primers such as product size.
Table 1. Showing Primer forward and reverse sequences synthesised from Invitrogen®
Gel electrophoresis of DNA fragments
RT-PCR was carried out on all three cell samples (control, baseline and LPS incubated cells) using the primers in table 1 above. However first, the primer
annealing temperatures were calculated empirically through gradient RT-PCRs and then bands were observed on an agarose gel to confirm which
temperature produced the highest quality bands for each primer pair. Once annealing temperatures had been established for each primer, RT-PCRs were
performed on all three samples and the agarose gel readings are shown in the results section below.
References
Argiés, J. M., Bogdan, C., Celada, A., Comalada, M., Lloberas, J., López-Soriano et al. (2000). LPS induces
apoptosis in macrophages mostly through the autocrine production of TNF-α. Blood, 95(12), 3823-3831.
Cody, J. M., Hirschfeld, M., Michalek, S. M., Qureshi, N., Salkowski, C. A., Toshchakov, V. et al. (2001). Signalling
by Toll-like receptor 2 and 4 agonists results in differential gene expression in murine macrophages. Infection
and immunity, 69(3), 1477-1482.
Fengchun, Z., Hang, Y., Jing, L. & Wang, X. (2013). Toll-like receptors as therapeutic targets for autoimmune
connective tissue diseases. Pharmacology & therapeutics, 138(3), 441-451.
George, T., Good, D. W. & Watts, B. A. (2012). Toll-like receptor 2 is required for LPS-induced Toll-like receptor 4
signalling and inhibition of ion transport in renal thick ascending limb. The journal of Biological Chemistry,
287(24), 20208-20220.
Holzmann, B. & Weighardt, H. (2008). Role of toll-like receptor responses for sepsis pathogenesis.
Immunobiology, 212(10), 715-722.
Liu, Y., Ohashi, P. S. & Yeh, W. (2008). LPS/TLR4 signal transduction pathway. Cytokine, 42(2), 145-151.
Discussion
Aims and Objectives were met as expression levels of all cytokines (TNF-α & IL-6) and receptors (TLR2, TLR4 &
NOD2) were observed on the gels. TNF-α primers produced fragments around 115bp, TLR2 has fragments with
a size of around 200bp and TLR4 had fragments around 406bp in size. Whereas NOD2 and IL-6 had fragments
with sizes that were different to what was expected, NOD2 had fragments around 300bp where it should have
been 515bp and IL-6 had fragments of 250bp in size where they should have been 129bp
LPS stimulation showed to increase expression of TNF-α, TLR2 and TLR4. whereas NOD2 and IL-6 bands for LPS
samples were very feint or not present. Reasons for LPS bands to not be present could be down to samples
having relatively low concentrations of RNA as well as LPS having the potential to trigger apoptosis in some
macrophages through TNF-α autocrine production by activating TNF receptor 1-associated death domains
(TRADD) on the cell membrane triggering apoptosis through caspase 8 activation (Argilés et al, 2000).
Increase in TLR2 and TLR4 expression when exposed to identified in this project has also been identified in
other pieces of literature, Cody et al (2001) also discovered that TLR2 and TLR4 expression was increased with
LPS stimulation but found out that different cytokines are produced as end results of each receptor being
activated. TLR2 and TLR4 are often activated together in response to LPS as knock-out studies of TLR2 have
shown that this causes an impairment in MyD88 recruitment leading to an impaired response to LPS by TLR4
ligation (George, Good, & Watts, 2012).
It is also important to note that IL-6 bands were not in the correct location on the gel due to them being a
different size of 250bp instead of the expected size of 129bp. Reasons why this may have happened could be
down to the wrong concentration of agarose gel being used to run the fragments on as well as the possibility
that there was some genomic DNA contamination that had a similar sequence to the IL-6 RNA sequence,
therefore the primers would have bound to this and amplified the genomic DNA instead of the IL-6 RNA.
NOD2 primers also had a hairpin detected in forward primer which caused the bands on the gel to be weaker
due to the primer not working effectively in amplifying up NOD2 RNA. Hairpins in a primer sequence can also
cause non-specific bands to appear on the gel as primers bind to non-specific sequences as well as primers
dimerizing with each other.
Overall bands for all primers were quite weak and not very well defined, this could be down to the annealing
temperature not being perfectly calculated or the MgSO4 (salt) concentration being incorrect as this can cause
smearing of the bands as well as non specific bands to appear on the gel.
Sources of error which could have contributed to some of the bands being poor quality could be down to
protein/DNA contamination when extracting RNA during phenol-chloroform extraction method, as it is required
to pipette out the top aqueous layer containing RNA and not the bottom organic layer which contains protein
and DNA. Therefore incorrect pipetting leads to protein/DNA being pipetted into the extracted RNA sample. To
reduce this chance of contamination, using a RNA extraction kit instead of doing the process manually would be
better despite the kit being far more expensive. Not only this but incorrect handling of the macrophage cell
samples can lead to lower RNA concentrations as leaving macrophages in unfavourable conditions causing them
to undergo apoptosis reducing the amount of cells to extract RNA from.
Future work that could be undertaken if there was more time would be to have more repeats of each sample to
increase the validity of each result so more accurate conclusions can be drawn about Toll-like receptor derived
cytokine expression.
investigate the effects of different MgSO4 (salt) concentrations on the bands formed on the agarose gel. Also
investigating different concentrations of LPS effect on RNA purity and concentration after a 24 hour incubation
would be useful to find out the optimum concentration which elicits a response but has minimal levels of
macrophage apoptosis.
To conclude, LPS did show to increase cytokine and TLR2, TLR4 and NOD2 receptor expression when compared
to baseline and control samples however various sources of errors and contributing factors such as low
concentrations of RNA from LPS incubated samples due to apoptosis of some macrophages limiting the
conclusions that could be drawn from the results.
Introduction
Toll-like receptors (TLRs) are comprised of three main components, one of these being an intracellular signalling
domain. Once a PAMP or DAMP has bound to the TLR on the cell surface or intracellularly, on an endosomal
membrane intracellular signalling pathways are activated as the TLR dimerizes. This dimerization causes
recruitment of various adaptor proteins which bind to the signalling domain of the TLR, adaptor proteins
involved in TLR signalling are Myeloid differentiation primary response gene factor 88 (MyD88) and Toll/IL-1-
receptor domain-containing adapter inducing IFN (TRIF) (Holzmann & Weighardt, 2008). It is important to note
that different TLRs use specific adaptor proteins, figure 1 displays the general intracellular signalling pathway
within an immune cell.
Figure 1. Showing an overview of intracellular signalling pathways within an immune cell for a TLR mediated
response once a PAMP/DAMP has bound to the receptor (Fengchun, Hang, Jing & Wang, 2013).
The TLRs under investigation in this project are TLR2 and 4, TLR4 utilises both signalling pathways of MyD88 and
TRIF when its respective ligand (LPS) binds. The use of both pathways by TLR4 was investigated with the use of
gene-knockout mice studies examining the resistance to LPS-induced septic shock when one of the pathways
was knocked out (Liu, Ohashi & Yeh, 2008). TLR2 is the other key receptor under investigation, this receptor
binds peptidoglycan as its main agonist but has also shown to produce responses to some LPS variants as
knocking out TLR2 was shown to impair the recruitment of the MyD88 adaptor protein in response to LPS by
TLR4 ligation (George, Good, & Watts, 2012). It is important to note thatTLR2 is the only TLR class to exclusively
use the TRIF signalling pathway which leads to production of type I interferons.
Abstract
Pattern recognition receptors (PRRs) such as Toll-like receptors play a key role in the innate immune system, PRRs
are responsible for identifying pathogen associated molecular patterns (PAMPs) and damage associated
molecular patterns (DAMPs) which leads phagocytosis and cytokine production.
Macrophage stimulation through LPS incubation over 24 hours showed to increase expression of TNF-α, TLR2
and TLR4. These fragments were found at the correct location on the gel consequently having the correct size
calculated from Primer3 and Primer-BLAST. TNF-α primers produced fragments around 115bp in size, TLR2 had
fragments with a size of around 200bp and TLR4 had fragments around 406bp in size. Whereas NOD2 and IL-6
had fragments with sizes that were different to what was expected, NOD2 had fragments around 300bp where it
should have been 515bp possibly due to the fact that the forward NOD2 primer had a hairpin sequence detected
and IL-6 had fragments of 250bp in size where they should have been 129bp which could have been linked to
genomic DNA contamination. Also expression of IL-6 and NOD2 could not be measured correctly as no bands
were present for LPS incubated samples on the agarose gel. Other experiments which investigated LPS derived
cytokine expression showed that IL-6 levels should increase with LPS inoculation. Sources of error include LPS
possibly causing apoptosis in some macrophage cells leading to a lower RNA concentration. Pipetting of aqueous
layer during RNA extraction was another source of error as accidental pipetting of organic layer can occur
leading to protein/DNA contamination. Further work that could be carried out would include carrying out
replicates of each sample to increase the validity of the results as well as investigating the effects of different
concentrations of MgSO4 and LPS on the bands produced from RT-PCR.
Primer Forward Sequence (5’ To 3’) Reverse Sequence (5’ To 3’)
TNF-α GCCTCTTCTCATTCCTGCTTG CTGATGAGAGGGAGGCCATT
IL-6 ACGGCCTTCCCTACTTCACA CATTTCCACGATTTCCCAGA
NOD2 AGCAGAACTTCTTGTCCCTGA TCACAACAAGAGTCTGGCGT
TLR2 GTCTCTGCGACCTAGAAGTGGA CGGAGGGAATAGAGGTGAAAGA
TLR4 GCAATGTCTCTGGCAGGTGTA CAAGGGATAAGAACGCTGAGA
Results
Macrophage cell viability was confirmed through cell counts on a haemocytometer and extracted RNA from these cells was tested for purity and
concentration through Biophotometry. Before samples were used for RT-PCR, gel electrophoresis results were used alongside the biophotometer readings
to confirm the sample quality. The DNA products of RT-PCR of control, baseline and LPS incubated samples can be observed below.
Figure 3 showing TNF-α PCR products for control, baseline and LPS
incubated samples on a 2% gel. Well 1 contains a 100BP DNA
Ladder, well 3 contains control TNF-α DNA fragments, well 5 holds
baseline TNF-α DNA fragments and well 7 contains LPS incubated
samples TNF-α DNA fragments.
Figure 4 showing TLR4 and NOD2 PCR products for control,
baseline and LPS incubated samples on a 1.1% gel. Well 1 contains
a 100BP DNA Ladder, well 3 contains control TLR4 DNA fragments,
well 4 holds baseline TLR4 DNA fragments, well 5 contains LPS
incubated samples TLR4 DNA fragments, well 6 holds control
NOD2 DNA fragments, well 7 contains baselineNOD2 DNA
fragments and well 8 contains LPS incubated samples NOD2 DNA
fragments.
Figure 2 showing Baseline and RNA from LPS incubated samples
on a 1.1% agarose gel. Well 1 holds the 1KB DNA ladder, wells 3 to
5 hold the baseline RNA samples and wells 6 to 8 contain RNA
from LPS incubated cells
Figure 5 showing TLR2 and IL-6 PCR products for control, baseline
and LPS incubated samples on a 1.6% gel. Well 1 contains a 100BP
DNA Ladder, well 3 contains control TLR2 DNA fragments, well 4
holds baseline TLR2 DNA fragments, well 5 contains LPS incubated
samples TLR2 DNA fragments, well 6 holds control IL-6 DNA
fragments, well 7 contains baseline IL-6 DNA fragments and well 8
contains LPS incubated samples IL-6 DNA fragments.

More Related Content

What's hot

Effects of Collection, Preservation, and Sample Preparation Methods on the Qu...
Effects of Collection, Preservation, and Sample Preparation Methods on the Qu...Effects of Collection, Preservation, and Sample Preparation Methods on the Qu...
Effects of Collection, Preservation, and Sample Preparation Methods on the Qu...Nicole Petegorsky
 
Isothermal Nucleic Acid Amplification Techniques
Isothermal Nucleic Acid Amplification TechniquesIsothermal Nucleic Acid Amplification Techniques
Isothermal Nucleic Acid Amplification TechniquesAref Farokhi Fard
 
Role of transcriptomics in improving the tmperature stress tolerance in ornam...
Role of transcriptomics in improving the tmperature stress tolerance in ornam...Role of transcriptomics in improving the tmperature stress tolerance in ornam...
Role of transcriptomics in improving the tmperature stress tolerance in ornam...Sirividyadvg
 
Antisense RNA technology
Antisense RNA technologyAntisense RNA technology
Antisense RNA technologyPravin Sapate
 
Nested PCR,Fusion primers, Integrated PCR
Nested PCR,Fusion primers, Integrated PCRNested PCR,Fusion primers, Integrated PCR
Nested PCR,Fusion primers, Integrated PCRSani Jwel
 
Pcr and its types
Pcr and its typesPcr and its types
Pcr and its typesnirvarna gr
 
An Investigation Of The Rigor Of Interpretation Rules
An Investigation Of The Rigor Of Interpretation RulesAn Investigation Of The Rigor Of Interpretation Rules
An Investigation Of The Rigor Of Interpretation RulesNick Brown
 
Cloning and Characterization of Master Regulator of Systemic Acquired Resista...
Cloning and Characterization of Master Regulator of Systemic Acquired Resista...Cloning and Characterization of Master Regulator of Systemic Acquired Resista...
Cloning and Characterization of Master Regulator of Systemic Acquired Resista...Akhilesh Rawat
 
PhD; Qualification exam (mesele)2
PhD; Qualification exam (mesele)2PhD; Qualification exam (mesele)2
PhD; Qualification exam (mesele)2Mesele Tilahun
 
Nezih Cereb - HLA Typing in the 21st Century High Resolution Typing for Everyone
Nezih Cereb - HLA Typing in the 21st Century High Resolution Typing for EveryoneNezih Cereb - HLA Typing in the 21st Century High Resolution Typing for Everyone
Nezih Cereb - HLA Typing in the 21st Century High Resolution Typing for EveryoneSingapore Society for Haematology
 
Use of TGIRT for ssDNA-seq
Use of TGIRT for ssDNA-seqUse of TGIRT for ssDNA-seq
Use of TGIRT for ssDNA-seqDouglas Wu
 
Horrix et al. - 2010
Horrix et al. - 2010Horrix et al. - 2010
Horrix et al. - 2010Cristina Voss
 
Research Poster
Research PosterResearch Poster
Research PosterCody Wong
 
Tissue Culture and Cloning Work
Tissue Culture and Cloning WorkTissue Culture and Cloning Work
Tissue Culture and Cloning WorkSatrupa Das
 
4thFinalThesisDefense_PowerPoint_LauraJenkins
4thFinalThesisDefense_PowerPoint_LauraJenkins4thFinalThesisDefense_PowerPoint_LauraJenkins
4thFinalThesisDefense_PowerPoint_LauraJenkinsLaura Jenkins
 

What's hot (20)

PCR
PCRPCR
PCR
 
Effects of Collection, Preservation, and Sample Preparation Methods on the Qu...
Effects of Collection, Preservation, and Sample Preparation Methods on the Qu...Effects of Collection, Preservation, and Sample Preparation Methods on the Qu...
Effects of Collection, Preservation, and Sample Preparation Methods on the Qu...
 
Isothermal Nucleic Acid Amplification Techniques
Isothermal Nucleic Acid Amplification TechniquesIsothermal Nucleic Acid Amplification Techniques
Isothermal Nucleic Acid Amplification Techniques
 
Role of transcriptomics in improving the tmperature stress tolerance in ornam...
Role of transcriptomics in improving the tmperature stress tolerance in ornam...Role of transcriptomics in improving the tmperature stress tolerance in ornam...
Role of transcriptomics in improving the tmperature stress tolerance in ornam...
 
Antisense RNA technology
Antisense RNA technologyAntisense RNA technology
Antisense RNA technology
 
rli60 project FINAL
rli60 project FINALrli60 project FINAL
rli60 project FINAL
 
Nested PCR,Fusion primers, Integrated PCR
Nested PCR,Fusion primers, Integrated PCRNested PCR,Fusion primers, Integrated PCR
Nested PCR,Fusion primers, Integrated PCR
 
Pcr and its types
Pcr and its typesPcr and its types
Pcr and its types
 
3 prr
3 prr3 prr
3 prr
 
An Investigation Of The Rigor Of Interpretation Rules
An Investigation Of The Rigor Of Interpretation RulesAn Investigation Of The Rigor Of Interpretation Rules
An Investigation Of The Rigor Of Interpretation Rules
 
17
1717
17
 
Cloning and Characterization of Master Regulator of Systemic Acquired Resista...
Cloning and Characterization of Master Regulator of Systemic Acquired Resista...Cloning and Characterization of Master Regulator of Systemic Acquired Resista...
Cloning and Characterization of Master Regulator of Systemic Acquired Resista...
 
PhD; Qualification exam (mesele)2
PhD; Qualification exam (mesele)2PhD; Qualification exam (mesele)2
PhD; Qualification exam (mesele)2
 
Nezih Cereb - HLA Typing in the 21st Century High Resolution Typing for Everyone
Nezih Cereb - HLA Typing in the 21st Century High Resolution Typing for EveryoneNezih Cereb - HLA Typing in the 21st Century High Resolution Typing for Everyone
Nezih Cereb - HLA Typing in the 21st Century High Resolution Typing for Everyone
 
Use of TGIRT for ssDNA-seq
Use of TGIRT for ssDNA-seqUse of TGIRT for ssDNA-seq
Use of TGIRT for ssDNA-seq
 
Horrix et al. - 2010
Horrix et al. - 2010Horrix et al. - 2010
Horrix et al. - 2010
 
3 nod
3 nod3 nod
3 nod
 
Research Poster
Research PosterResearch Poster
Research Poster
 
Tissue Culture and Cloning Work
Tissue Culture and Cloning WorkTissue Culture and Cloning Work
Tissue Culture and Cloning Work
 
4thFinalThesisDefense_PowerPoint_LauraJenkins
4thFinalThesisDefense_PowerPoint_LauraJenkins4thFinalThesisDefense_PowerPoint_LauraJenkins
4thFinalThesisDefense_PowerPoint_LauraJenkins
 

Similar to 14098419ls12aboProjectPoster

project- Liron Schwartz
project- Liron Schwartzproject- Liron Schwartz
project- Liron SchwartzLiron Schwartz
 
Expression systems
Expression systemsExpression systems
Expression systemsBruno Mmassy
 
Nucleic acid recognition by the innate immune system
Nucleic acid recognition by the innate immune systemNucleic acid recognition by the innate immune system
Nucleic acid recognition by the innate immune systemANKUR SHARMA
 
Poster_RosanaLopez_SULI_Summer2011_aug8_final_2
Poster_RosanaLopez_SULI_Summer2011_aug8_final_2Poster_RosanaLopez_SULI_Summer2011_aug8_final_2
Poster_RosanaLopez_SULI_Summer2011_aug8_final_2Rosana Lopez
 
Molecular_bilogy_lab_report_2
Molecular_bilogy_lab_report_2Molecular_bilogy_lab_report_2
Molecular_bilogy_lab_report_2Elijah Willie
 
ONLY THE LAST QUESTION IS THE POINT OF POST. THE OTHER PAGES ARE B.pdf
ONLY THE LAST QUESTION IS THE POINT OF POST. THE OTHER PAGES ARE B.pdfONLY THE LAST QUESTION IS THE POINT OF POST. THE OTHER PAGES ARE B.pdf
ONLY THE LAST QUESTION IS THE POINT OF POST. THE OTHER PAGES ARE B.pdfamzonknr
 
ONLY THE LAST QUESTION IS THE POINT OF POST. THE OTHER PAGES ARE BAC.pdf
ONLY THE LAST QUESTION IS THE POINT OF POST. THE OTHER PAGES ARE BAC.pdfONLY THE LAST QUESTION IS THE POINT OF POST. THE OTHER PAGES ARE BAC.pdf
ONLY THE LAST QUESTION IS THE POINT OF POST. THE OTHER PAGES ARE BAC.pdfamzonknr
 
120802_NC_My Poster
120802_NC_My Poster120802_NC_My Poster
120802_NC_My PosterHenry Chen
 
Lydia Yeshitla, Research Scholar at the Neurobiology Section of UCSD
Lydia Yeshitla, Research Scholar at the Neurobiology Section of UCSDLydia Yeshitla, Research Scholar at the Neurobiology Section of UCSD
Lydia Yeshitla, Research Scholar at the Neurobiology Section of UCSDLydia Yeshitla
 
Lab Differential Expression Differential gene expression provides th.pdf
 Lab Differential Expression Differential gene expression provides th.pdf Lab Differential Expression Differential gene expression provides th.pdf
Lab Differential Expression Differential gene expression provides th.pdfrita892197
 
Lab Differential Expression Differential gene expression provides .pdf
 Lab Differential Expression Differential gene expression provides .pdf Lab Differential Expression Differential gene expression provides .pdf
Lab Differential Expression Differential gene expression provides .pdfbasilpaul63
 
Dann lab presentation
Dann lab presentationDann lab presentation
Dann lab presentationkaylaminniear
 
Hotspot mutation and fusion transcript detection from the same non-small cell...
Hotspot mutation and fusion transcript detection from the same non-small cell...Hotspot mutation and fusion transcript detection from the same non-small cell...
Hotspot mutation and fusion transcript detection from the same non-small cell...Thermo Fisher Scientific
 
POLYMERASE CHAIN REACTION
POLYMERASE CHAIN REACTIONPOLYMERASE CHAIN REACTION
POLYMERASE CHAIN REACTIONDr Qureshi
 
Gene Expression in Arabidopsis
Gene Expression in ArabidopsisGene Expression in Arabidopsis
Gene Expression in ArabidopsisC.B. Wolf
 
Kani chemical biology
Kani chemical biologyKani chemical biology
Kani chemical biologyLe Nghia
 
Determining the Interaction between ssSPTa Associated Proteins and Human ORM1...
Determining the Interaction between ssSPTa Associated Proteins and Human ORM1...Determining the Interaction between ssSPTa Associated Proteins and Human ORM1...
Determining the Interaction between ssSPTa Associated Proteins and Human ORM1...George Wu
 
12.03.13 - Journal Club
12.03.13 - Journal Club12.03.13 - Journal Club
12.03.13 - Journal ClubFarhoud Faraji
 

Similar to 14098419ls12aboProjectPoster (20)

project- Liron Schwartz
project- Liron Schwartzproject- Liron Schwartz
project- Liron Schwartz
 
Expression systems
Expression systemsExpression systems
Expression systems
 
Nucleic acid recognition by the innate immune system
Nucleic acid recognition by the innate immune systemNucleic acid recognition by the innate immune system
Nucleic acid recognition by the innate immune system
 
Poster_RosanaLopez_SULI_Summer2011_aug8_final_2
Poster_RosanaLopez_SULI_Summer2011_aug8_final_2Poster_RosanaLopez_SULI_Summer2011_aug8_final_2
Poster_RosanaLopez_SULI_Summer2011_aug8_final_2
 
Molecular_bilogy_lab_report_2
Molecular_bilogy_lab_report_2Molecular_bilogy_lab_report_2
Molecular_bilogy_lab_report_2
 
ONLY THE LAST QUESTION IS THE POINT OF POST. THE OTHER PAGES ARE B.pdf
ONLY THE LAST QUESTION IS THE POINT OF POST. THE OTHER PAGES ARE B.pdfONLY THE LAST QUESTION IS THE POINT OF POST. THE OTHER PAGES ARE B.pdf
ONLY THE LAST QUESTION IS THE POINT OF POST. THE OTHER PAGES ARE B.pdf
 
ONLY THE LAST QUESTION IS THE POINT OF POST. THE OTHER PAGES ARE BAC.pdf
ONLY THE LAST QUESTION IS THE POINT OF POST. THE OTHER PAGES ARE BAC.pdfONLY THE LAST QUESTION IS THE POINT OF POST. THE OTHER PAGES ARE BAC.pdf
ONLY THE LAST QUESTION IS THE POINT OF POST. THE OTHER PAGES ARE BAC.pdf
 
120802_NC_My Poster
120802_NC_My Poster120802_NC_My Poster
120802_NC_My Poster
 
Lydia Yeshitla, Research Scholar at the Neurobiology Section of UCSD
Lydia Yeshitla, Research Scholar at the Neurobiology Section of UCSDLydia Yeshitla, Research Scholar at the Neurobiology Section of UCSD
Lydia Yeshitla, Research Scholar at the Neurobiology Section of UCSD
 
Lab Differential Expression Differential gene expression provides th.pdf
 Lab Differential Expression Differential gene expression provides th.pdf Lab Differential Expression Differential gene expression provides th.pdf
Lab Differential Expression Differential gene expression provides th.pdf
 
Lab Differential Expression Differential gene expression provides .pdf
 Lab Differential Expression Differential gene expression provides .pdf Lab Differential Expression Differential gene expression provides .pdf
Lab Differential Expression Differential gene expression provides .pdf
 
Dann lab presentation
Dann lab presentationDann lab presentation
Dann lab presentation
 
Hotspot mutation and fusion transcript detection from the same non-small cell...
Hotspot mutation and fusion transcript detection from the same non-small cell...Hotspot mutation and fusion transcript detection from the same non-small cell...
Hotspot mutation and fusion transcript detection from the same non-small cell...
 
POLYMERASE CHAIN REACTION
POLYMERASE CHAIN REACTIONPOLYMERASE CHAIN REACTION
POLYMERASE CHAIN REACTION
 
Gene Expression in Arabidopsis
Gene Expression in ArabidopsisGene Expression in Arabidopsis
Gene Expression in Arabidopsis
 
Kani chemical biology
Kani chemical biologyKani chemical biology
Kani chemical biology
 
DNA fingerprinting
DNA fingerprintingDNA fingerprinting
DNA fingerprinting
 
Determining the Interaction between ssSPTa Associated Proteins and Human ORM1...
Determining the Interaction between ssSPTa Associated Proteins and Human ORM1...Determining the Interaction between ssSPTa Associated Proteins and Human ORM1...
Determining the Interaction between ssSPTa Associated Proteins and Human ORM1...
 
Hla typing
Hla typingHla typing
Hla typing
 
12.03.13 - Journal Club
12.03.13 - Journal Club12.03.13 - Journal Club
12.03.13 - Journal Club
 

14098419ls12aboProjectPoster

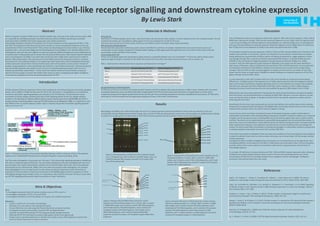
  • 1. Aims & Objectives Aims: - To investigate expression levels of various cytokines such as TNF-α and IL-6 - To investigate expression of TLR2, TLR4 and NOD2 - To Investigate the effects of LPS stimulation on receptor and cytokine expression Objectives:  Culture a cell line of J774 murine macrophages  Stimulate J774 cell cultures with Lipopolysaccharide  Extract RNA from J774 cells using the Phenol-chloroform extraction method  Investigate the purity and quantity of extract RNA via Biophotometry  Quantify extracted RNA through RT-PCR using specifically designed primers  Optimise the RT-PCR technique to produce high quality results on an agarose gel  Prepare and run gel electrophoresis to identify and visualise various DNA fragments to determine levels of cellular expression of various cytokines Materials & Methods Cell Culturing Two flasks of J774 Macrophage cultures were used, these flasks sub-cultured into three samples; a control, baseline and an LPS incubated sample. The LPS incubated cell sample was inoculated by adding 1µg/ml of LPS and incubating the sample for 24 hours. Cell counts were carried out to further prove confluency and viability of each cell sample using a haemocytometer. RNA extraction & Biophotometry Phenol-chloroform extraction method was used to extract total RNA from all three cell samples. Biophotometry was used to test the purity and concentration of each sample, alongside the Biophotometer readings an RNA agarose gel electrophoresis was run to further confirm the purity and concentration of the total RNA in each sample. Primer Design & RT-PCR Primers were designed against the desired gene coding sequence using NCBI software tools such as GenBank™. Primer3 was used to design primer sequences against this gene, and lastly Primer-BLAST was used to find out further information about the primers such as product size. Table 1. Showing Primer forward and reverse sequences synthesised from Invitrogen® Gel electrophoresis of DNA fragments RT-PCR was carried out on all three cell samples (control, baseline and LPS incubated cells) using the primers in table 1 above. However first, the primer annealing temperatures were calculated empirically through gradient RT-PCRs and then bands were observed on an agarose gel to confirm which temperature produced the highest quality bands for each primer pair. Once annealing temperatures had been established for each primer, RT-PCRs were performed on all three samples and the agarose gel readings are shown in the results section below. References Argiés, J. M., Bogdan, C., Celada, A., Comalada, M., Lloberas, J., López-Soriano et al. (2000). LPS induces apoptosis in macrophages mostly through the autocrine production of TNF-α. Blood, 95(12), 3823-3831. Cody, J. M., Hirschfeld, M., Michalek, S. M., Qureshi, N., Salkowski, C. A., Toshchakov, V. et al. (2001). Signalling by Toll-like receptor 2 and 4 agonists results in differential gene expression in murine macrophages. Infection and immunity, 69(3), 1477-1482. Fengchun, Z., Hang, Y., Jing, L. & Wang, X. (2013). Toll-like receptors as therapeutic targets for autoimmune connective tissue diseases. Pharmacology & therapeutics, 138(3), 441-451. George, T., Good, D. W. & Watts, B. A. (2012). Toll-like receptor 2 is required for LPS-induced Toll-like receptor 4 signalling and inhibition of ion transport in renal thick ascending limb. The journal of Biological Chemistry, 287(24), 20208-20220. Holzmann, B. & Weighardt, H. (2008). Role of toll-like receptor responses for sepsis pathogenesis. Immunobiology, 212(10), 715-722. Liu, Y., Ohashi, P. S. & Yeh, W. (2008). LPS/TLR4 signal transduction pathway. Cytokine, 42(2), 145-151. Discussion Aims and Objectives were met as expression levels of all cytokines (TNF-α & IL-6) and receptors (TLR2, TLR4 & NOD2) were observed on the gels. TNF-α primers produced fragments around 115bp, TLR2 has fragments with a size of around 200bp and TLR4 had fragments around 406bp in size. Whereas NOD2 and IL-6 had fragments with sizes that were different to what was expected, NOD2 had fragments around 300bp where it should have been 515bp and IL-6 had fragments of 250bp in size where they should have been 129bp LPS stimulation showed to increase expression of TNF-α, TLR2 and TLR4. whereas NOD2 and IL-6 bands for LPS samples were very feint or not present. Reasons for LPS bands to not be present could be down to samples having relatively low concentrations of RNA as well as LPS having the potential to trigger apoptosis in some macrophages through TNF-α autocrine production by activating TNF receptor 1-associated death domains (TRADD) on the cell membrane triggering apoptosis through caspase 8 activation (Argilés et al, 2000). Increase in TLR2 and TLR4 expression when exposed to identified in this project has also been identified in other pieces of literature, Cody et al (2001) also discovered that TLR2 and TLR4 expression was increased with LPS stimulation but found out that different cytokines are produced as end results of each receptor being activated. TLR2 and TLR4 are often activated together in response to LPS as knock-out studies of TLR2 have shown that this causes an impairment in MyD88 recruitment leading to an impaired response to LPS by TLR4 ligation (George, Good, & Watts, 2012). It is also important to note that IL-6 bands were not in the correct location on the gel due to them being a different size of 250bp instead of the expected size of 129bp. Reasons why this may have happened could be down to the wrong concentration of agarose gel being used to run the fragments on as well as the possibility that there was some genomic DNA contamination that had a similar sequence to the IL-6 RNA sequence, therefore the primers would have bound to this and amplified the genomic DNA instead of the IL-6 RNA. NOD2 primers also had a hairpin detected in forward primer which caused the bands on the gel to be weaker due to the primer not working effectively in amplifying up NOD2 RNA. Hairpins in a primer sequence can also cause non-specific bands to appear on the gel as primers bind to non-specific sequences as well as primers dimerizing with each other. Overall bands for all primers were quite weak and not very well defined, this could be down to the annealing temperature not being perfectly calculated or the MgSO4 (salt) concentration being incorrect as this can cause smearing of the bands as well as non specific bands to appear on the gel. Sources of error which could have contributed to some of the bands being poor quality could be down to protein/DNA contamination when extracting RNA during phenol-chloroform extraction method, as it is required to pipette out the top aqueous layer containing RNA and not the bottom organic layer which contains protein and DNA. Therefore incorrect pipetting leads to protein/DNA being pipetted into the extracted RNA sample. To reduce this chance of contamination, using a RNA extraction kit instead of doing the process manually would be better despite the kit being far more expensive. Not only this but incorrect handling of the macrophage cell samples can lead to lower RNA concentrations as leaving macrophages in unfavourable conditions causing them to undergo apoptosis reducing the amount of cells to extract RNA from. Future work that could be undertaken if there was more time would be to have more repeats of each sample to increase the validity of each result so more accurate conclusions can be drawn about Toll-like receptor derived cytokine expression. investigate the effects of different MgSO4 (salt) concentrations on the bands formed on the agarose gel. Also investigating different concentrations of LPS effect on RNA purity and concentration after a 24 hour incubation would be useful to find out the optimum concentration which elicits a response but has minimal levels of macrophage apoptosis. To conclude, LPS did show to increase cytokine and TLR2, TLR4 and NOD2 receptor expression when compared to baseline and control samples however various sources of errors and contributing factors such as low concentrations of RNA from LPS incubated samples due to apoptosis of some macrophages limiting the conclusions that could be drawn from the results. Introduction Toll-like receptors (TLRs) are comprised of three main components, one of these being an intracellular signalling domain. Once a PAMP or DAMP has bound to the TLR on the cell surface or intracellularly, on an endosomal membrane intracellular signalling pathways are activated as the TLR dimerizes. This dimerization causes recruitment of various adaptor proteins which bind to the signalling domain of the TLR, adaptor proteins involved in TLR signalling are Myeloid differentiation primary response gene factor 88 (MyD88) and Toll/IL-1- receptor domain-containing adapter inducing IFN (TRIF) (Holzmann & Weighardt, 2008). It is important to note that different TLRs use specific adaptor proteins, figure 1 displays the general intracellular signalling pathway within an immune cell. Figure 1. Showing an overview of intracellular signalling pathways within an immune cell for a TLR mediated response once a PAMP/DAMP has bound to the receptor (Fengchun, Hang, Jing & Wang, 2013). The TLRs under investigation in this project are TLR2 and 4, TLR4 utilises both signalling pathways of MyD88 and TRIF when its respective ligand (LPS) binds. The use of both pathways by TLR4 was investigated with the use of gene-knockout mice studies examining the resistance to LPS-induced septic shock when one of the pathways was knocked out (Liu, Ohashi & Yeh, 2008). TLR2 is the other key receptor under investigation, this receptor binds peptidoglycan as its main agonist but has also shown to produce responses to some LPS variants as knocking out TLR2 was shown to impair the recruitment of the MyD88 adaptor protein in response to LPS by TLR4 ligation (George, Good, & Watts, 2012). It is important to note thatTLR2 is the only TLR class to exclusively use the TRIF signalling pathway which leads to production of type I interferons. Abstract Pattern recognition receptors (PRRs) such as Toll-like receptors play a key role in the innate immune system, PRRs are responsible for identifying pathogen associated molecular patterns (PAMPs) and damage associated molecular patterns (DAMPs) which leads phagocytosis and cytokine production. Macrophage stimulation through LPS incubation over 24 hours showed to increase expression of TNF-α, TLR2 and TLR4. These fragments were found at the correct location on the gel consequently having the correct size calculated from Primer3 and Primer-BLAST. TNF-α primers produced fragments around 115bp in size, TLR2 had fragments with a size of around 200bp and TLR4 had fragments around 406bp in size. Whereas NOD2 and IL-6 had fragments with sizes that were different to what was expected, NOD2 had fragments around 300bp where it should have been 515bp possibly due to the fact that the forward NOD2 primer had a hairpin sequence detected and IL-6 had fragments of 250bp in size where they should have been 129bp which could have been linked to genomic DNA contamination. Also expression of IL-6 and NOD2 could not be measured correctly as no bands were present for LPS incubated samples on the agarose gel. Other experiments which investigated LPS derived cytokine expression showed that IL-6 levels should increase with LPS inoculation. Sources of error include LPS possibly causing apoptosis in some macrophage cells leading to a lower RNA concentration. Pipetting of aqueous layer during RNA extraction was another source of error as accidental pipetting of organic layer can occur leading to protein/DNA contamination. Further work that could be carried out would include carrying out replicates of each sample to increase the validity of the results as well as investigating the effects of different concentrations of MgSO4 and LPS on the bands produced from RT-PCR. Primer Forward Sequence (5’ To 3’) Reverse Sequence (5’ To 3’) TNF-α GCCTCTTCTCATTCCTGCTTG CTGATGAGAGGGAGGCCATT IL-6 ACGGCCTTCCCTACTTCACA CATTTCCACGATTTCCCAGA NOD2 AGCAGAACTTCTTGTCCCTGA TCACAACAAGAGTCTGGCGT TLR2 GTCTCTGCGACCTAGAAGTGGA CGGAGGGAATAGAGGTGAAAGA TLR4 GCAATGTCTCTGGCAGGTGTA CAAGGGATAAGAACGCTGAGA Results Macrophage cell viability was confirmed through cell counts on a haemocytometer and extracted RNA from these cells was tested for purity and concentration through Biophotometry. Before samples were used for RT-PCR, gel electrophoresis results were used alongside the biophotometer readings to confirm the sample quality. The DNA products of RT-PCR of control, baseline and LPS incubated samples can be observed below. Figure 3 showing TNF-α PCR products for control, baseline and LPS incubated samples on a 2% gel. Well 1 contains a 100BP DNA Ladder, well 3 contains control TNF-α DNA fragments, well 5 holds baseline TNF-α DNA fragments and well 7 contains LPS incubated samples TNF-α DNA fragments. Figure 4 showing TLR4 and NOD2 PCR products for control, baseline and LPS incubated samples on a 1.1% gel. Well 1 contains a 100BP DNA Ladder, well 3 contains control TLR4 DNA fragments, well 4 holds baseline TLR4 DNA fragments, well 5 contains LPS incubated samples TLR4 DNA fragments, well 6 holds control NOD2 DNA fragments, well 7 contains baselineNOD2 DNA fragments and well 8 contains LPS incubated samples NOD2 DNA fragments. Figure 2 showing Baseline and RNA from LPS incubated samples on a 1.1% agarose gel. Well 1 holds the 1KB DNA ladder, wells 3 to 5 hold the baseline RNA samples and wells 6 to 8 contain RNA from LPS incubated cells Figure 5 showing TLR2 and IL-6 PCR products for control, baseline and LPS incubated samples on a 1.6% gel. Well 1 contains a 100BP DNA Ladder, well 3 contains control TLR2 DNA fragments, well 4 holds baseline TLR2 DNA fragments, well 5 contains LPS incubated samples TLR2 DNA fragments, well 6 holds control IL-6 DNA fragments, well 7 contains baseline IL-6 DNA fragments and well 8 contains LPS incubated samples IL-6 DNA fragments.