Leadership Skills You Never Outgrow Newsletter_Communication
2016 Delta PAD Evaluation Results Report July 18 2016
1. 2016 Delta Region Project Achievement Day Evaluation Results
Delta PAD YOUTH Evaluation Results
The overall purpose of the evaluation is to describe youth experiences, identify
knowledge gained, and examine confidence levels of youth through the Delta Region
Project Achievement Day experience. The results of this survey can help identify ways
to improve the event and to increase participation among both youth and adult
volunteers. The data collected may inform existing PAD events statewide
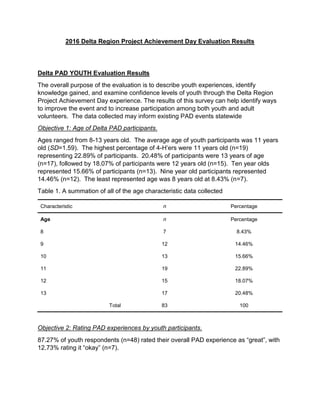
Objective 1: Age of Delta PAD participants.
Ages ranged from 8-13 years old. The average age of youth participants was 11 years
old (SD=1.59). The highest percentage of 4-H’ers were 11 years old (n=19)
representing 22.89% of participants. 20.48% of participants were 13 years of age
(n=17), followed by 18.07% of participants were 12 years old (n=15). Ten year olds
represented 15.66% of participants (n=13). Nine year old participants represented
14.46% (n=12). The least represented age was 8 years old at 8.43% (n=7).
Table 1. A summation of all of the age characteristic data collected
Characteristic n Percentage
Age n Percentage
8 7 8.43%
9 12 14.46%
10 13 15.66%
11 19 22.89%
12 15 18.07%
13 17 20.48%
Total 83 100
Objective 2: Rating PAD experiences by youth participants.
87.27% of youth respondents (n=48) rated their overall PAD experience as “great”, with
12.73% rating it “okay” (n=7).
2. Respondents rated individual PAD experiences at 67% or higher as “great”. These high
ratings could indicate that youth had positive experiences with all PAD offerings. See
Table 2 for summation of rated PAD experiences.
Table 2. A summation of rated PAD experiences
Experience n Percentage
Overall n Percentage
Great 48 87.27%
Okay 7 12.73%
Bad 0 0.00%
Total 55 100.00%
Registration n Percentage
Great 36 66.67%
Okay 18 33.33%
Bad 0 0.00%
Total 54 100.00%
Morning Assembly n Percentage
Great 40 74.07%
Okay 13 24.07%
Bad 1 1.85%
Total 54 100.00%
Contest(s) n Percentage
Great 43 76.79%
Okay 13 23.21%
Bad 0 0.00%
Total 56 100.00%
3. Table 2. (Continuation) A summation of rated PAD experiences
Experience n Percentage
Workshop na Percentage
Great 37 74.00%
Okay 11 22.00%
Bad 2 4.00%
Total 50 100.00%
Objective 3: Confidence and Comfort Levels pre and post PAD contests
When comparing the confidence and comfort levels before and after PAD, all three
items had an increase. Youth increased 71.05% in feeling very comfortable talking to
new people. There was a 46.66% increase in participant’s who felt very confident in
competing in a contest. Lastly, there was a 27.08% increase in participants who felt
very confident when making a decision after PAD. See Table 3 a summation of PRE-
PAD confidence and comfort levels of respondents and Table 4 for a summation of
POST-PAD confidence and comfort levels of respondents. Table 5 shows the percent
change of Very confident and comfortable pre and post PAD responses as reported
above.
Table 3. A summation of PRE-PAD confidence and comfort levels of respondents.
Experience n Percentage
Before your 4-H PAD contest(s),
how Confident were you in
competing in a contest?
na Percentage
Very 45 51.14%
A Little 41 46.59%
Not at all 2 2.27%
Total 88 100.00%
Before coming to 4-H PAD, how
Comfortable are you talking to
new people?
na Percentage
Very 38 44%
A Little 40 46%
4. Not at all 9 10%
Total 87 100.00%
Before your 4-H PAD contest(s),
how Confident were you making
a decision?
na Percentage
Very 48 55%
A Little 34 39%
Not at all 5 6%
Total 87 100.00%
Table 4. A summation of POST-PAD confidence and comfort levels of respondents.
Experience n Percentage
After your 4-H PAD contest(s),
how Confident were you in
competing in a contest?
na Percentage
Very 66 74%
A Little 21 24%
Not at all 2 2%
Total 89 100.00%
After coming to 4-H PAD, how
Comfortable are you talking to
new people?
na Percentage
Very 65 73%
A Little 19 21%
Not at all 5 6%
Total 89 100.00%
After your 4-H PAD contest(s),
how Confident were you making
a decision?
na Percentage
Very 61 71%
A Little 24 28%
5. Not at all 1 1%
Total 86 100.00%
Table 5. Percent Change when looking at pre and post PAD “Very Comfortable and
Confident” responses
Items Pre PAD
n
Post PAD
n
Percent
Change
Very Confident in competing in a contest 45 66 44.66%
Very Comfortable in talking to new
people
48 61 27.08%
Very Confident in making a decision 38 65 71.05%
Objective 4: Knowledge gained from competing in a PAD contest
Youth respondents were asked to name one thing they learned while studying for their
contest to measure knowledge gained. Responses are reported within five categories:
General, Life Skill Development, SET, Healthy Living, and Citizenship
Knowledge gained from studying for a PAD contest (What did you learn?) (n=67):
General Responses:
4-H Judging
Stuff
Life Skill Development Responses:
Be a team (n=10)
To be confident in what I do (n=4)
Do Your Best (n=2)
I learned not to be scared (n=2)
Have fun
Winning at Things
That family is good
Skills for future contests
Be prepared
Working
6. Frequent studying pays off
SET (Science, Engineering, and Technology) Responses:
Robots (n=12)
o How to program a robot (n=6)
o There are robots that stay permanently under water and track fish (n=2)
o Robots can work longer than humans
o Obstacle Avoidance Systems
More things about fashion (n=2)
Wildlife Judging (n=2)
Names of animals (n=2)
How to Bike
Cottage Cheese is Nasty
Ice Cream is very good
Good Archery
About photo editing
Hard food are for younger dogs and soft food is for older dogs
When my pigs got sick
How to understand prices and items
Different kinds of window covers
More about pet care
Transpiraterason (sp?) and runoff
How to take pictures
Horses have the largest eye of all land animals
The colors of horses
Healthy Living Responses:
Sodas are bad for you
Football
Citizenship Responses:
How public speaking works
I learned that you have to talk
That every city does not have 911
Objective 5: Knowledge gained from participating in a PAD workshop
Youth respondents (n=47) were asked to name one thing learned from the workshop
they attended to measure knowledge gained.
Knowledge gained from participating in a PAD workshop (What did you learn?):
General Workshop Responses:
7. o Workshops are cool (n=2)
o Having fun (n=2)
o Be nice (n=2)
o It is very hot outside
o To be good
o You can do anything you set your mind to
o Be a good sport
o Never give up
o Be safe
o Don’t be afraid to say what you want to
o Take a breath if you’re scared or nervous
Flip 4-Health Workshop (n=11)
o How to wash hands correctly (n=4)
o You have to drink and eat things that are healthy (n=2)
o How to make trail mix (n=2)
o Sugar is bad for you
o How to make fruit water
o Breathing through a drinking straw is better than a stirring straw
o Smoking is bad
#Techgoals (n=7)
o How to fly/control an airplane (n=5)
o Wind hurts flight (n=2)
Fun-N-Sun Fitness (n=4)
o Exercise is good and fun
o How to play a new game
o How to throw a Frisbee
o I am fairly fit
Ag Life (n=4)
o Shoot a Bow
o Animals (n=2)
o How different animal skins feel
8. Delta PAD ADULT Evaluation Results
The overall purpose of the evaluation is to describe adult experiences, identify
importance of experiences offered at PAD to child(ren)’s total 4-H experience, and
examine opinions on operations of the Delta Region Project Achievement Day. The
results of this survey can help identify ways to improve the event and to increase
participation among both youth and adult volunteers. The data collected may inform
existing PAD events statewide.
Objective 1: Rating PAD experiences by adult attendees
Adult respondents were asked to evaluate PAD experiences as “positive”, “okay”, or
“poor”.
94.12% adult participants rated their overall PAD experience as positive. Registration
had a 91.18% positive rating; morning assembly had 91.43% positive rating, contests
had a 91.18% positive rating, and workshops had an 80% positive rating. It is
interesting to note that “poor” was not reported by any respondent for any of the
experiences.
Table 1. A summation of adult rated PAD experiences
Experience n Percentage
Overall n Percentage
Positive 32 94.12%
Okay 2 5.88%
Poor 0 0%
Total 34 100.00%
Registration n Percentage
Positive 31 91.18%
Okay 3 8.82%
Poor 0 0%
Total 100.00%
Morning Assembly n Percentage
Positive 32 91.43%
Okay 3 8.59%
Poor 0 0%
9. Total 35 100.00%
Contest(s) n Percentage
Positive 31 91.18%
Okay 3 8.82%
Poor 0 0%
Total 34 100.00%
Workshop na Percentage
Positive 24 80%
Okay 6 20%
Poor 0 0%
Total 30 100.00%
Objective 2: Importance of PAD experiences related to child(ren)’s total 4-H experience
Adult respondents were asked to identify importance of PAD experiences offered to
child(ren)’s total 4-H experience.
92.98% of adult respondents expressed that Project Achievement Day was very
important to their child(ren)’s total 4-H experience. 94.4% of adult respondents felt that
preparing for a 4-H contest was very important to their child(ren)’s total 4-H experience.
85.96% of adult respondents felt that competing in a contest is very important to their
child(ren)’s total 4-H experience, while 14.04% reported that it was “somewhat
important”. Lastly, 92.45% of adult respondents felt that meeting new people (4-H’ers)
was very important to their child(ren)’s total 4-H experience.
Table 2. Adult feelings about experiences offered at 4-H PAD related to total 4-H
experience.
Experience n Percentage
Project Achievement Day’s
importance to child(ren)’s total
4-H experience
n Percentage
Not Important 0 0%
Somewhat Important 4 7.02%
Very Important 53 92.98%
10. Does Not Apply 0 0%
Total 57 100.00%
Preparing for a 4-H contest
importance to child(ren)’s total
4-H experience
n Percentage
Not Important 0 0%
Somewhat Important 3 5.56%
Very Important 51 94.44%
Does Not Apply 0 0%
Total 54 100.00%
Competing in a contest
importance to child(ren)’s total
4-H experience
n Percentage
Not Important 0 0%
Somewhat Important 8 14.04%
Very Important 49 85.96%
Does Not Apply 0 0%
Total 57 100.00%
Meeting new people (4-H’ers)
importance to child(ren)’s total
4-H experience
n Percentage
Not Important 0 0%
Somewhat Important 4 7.55%
Very Important 49 92.45%
Does Not Apply 0 0%
Total 53 100.00%
Objective 3: PAD Operations
Adult respondents were asked to rate PAD’s operations. 81.48% of respondents (n=44)
indicated they wanted to keep PAD on a weekday. Comments from respondents
11. indicated that strategies to increase participation should be explored. (See comments
section below for full list of comments)
Table 3: Keep Project Achievement Day on a weekday
n Percentage
Keep PAD on a weekday? n Percentage
Yes 44 81.48%
No 10 18.52%
Total 54 100.00%
Comments on PAD on a weekday: (n=14)
Weekends work for kids and parents (n=4)
Better on Friday (n=2)
Work conflict (n=2)
Church, other activities on weekend, or parents day off (n=2)
Either (n=2)
Unless we move it to the school year
It shows my son how important he is when I take off work
Summer
86% of respondents (n=43) indicated they wanted to keep PAD at current location in
Moorhead, MS. Comments from respondents indicated that the possibility of rotating
locations should be explored. (See comments section below for full list of comments)
Table 4: Keep Project Achievement Day at current location
n Percentage
Keep PAD at current location? n Percentage
Yes 43 86%
No 7 14%
Total 50 100.00%
Comments on PAD at current location: (n=14)
Have fluctuation across Northwest (n=4)
12. Northwest Community college in Senatobia (n=3)
Good central location; good hospitality, classrooms (n=3)
Could be closer to Desoto but I understand keeping in a central location
Possible DSU
Would like in Grenada or Oxford.
Combine both and have at MSU
Thanks to MDCC
It ok.
Objective 4: Suggestions to Improve PAD
Respondents were asked to give suggestions to improve PAD. Lunch improvements
and robotics suggestions led the responses. (See comments section below for full list
of comments)
Comments to Improve PAD: (n=19)
Lunch (n=5)
o Pay for lunch in advance/better payment system (n=3)
Lunch line wait
Better lunch for money
Robotics (n=5)
o To make sure we can get the robot board (course) months before actual
competition
o Don't change robotics items at last minute. All information about course
and how to do it should be uniformed for the 4-h'ers!
o Bigger place needed for robotics
o Adapt course maps to sensors
o Robotics needs a larger area. Too small!
We might need a different time of year to get numbers up
New projects
Well Organized.
If moved to DSU, could maybe use Grammy and DMI for workshops
Need a couple of events a year
At least rotate locations
Move it to July
Release schedule earlier
The outdoors activities this year were a great addition. (Keep those)
Better plans for workshops
Compiled by Laura Brumbaugh, Extension Agent, Tate County, July 8, 2016