Unlocking Business Value Through Ground Transportation
•
0 likes•20 views

Forward thinking companies are beginning to look at ways to bring their business value through their ground transportation program. This attachment shows how Enterprise Holdings can help.
Recommended

Recommended
More Related Content
Similar to Unlocking Business Value Through Ground Transportation
Similar to Unlocking Business Value Through Ground Transportation (20)
Recently uploaded
Recently uploaded (20)
Unlocking Business Value Through Ground Transportation
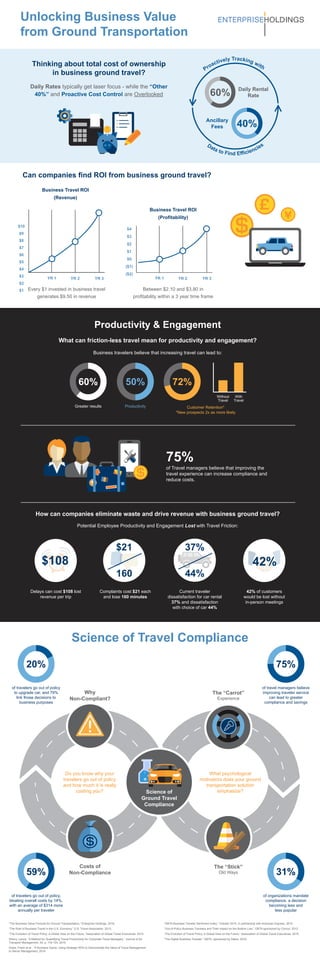
- 1. Can companies find ROI from business ground travel? Unlocking Business Value from Ground Transportation Science of Travel Compliance Productivity & Engagement What can friction-less travel mean for productivity and engagement? How can companies eliminate waste and drive revenue with business ground travel? Thinking about total cost of ownership in business ground travel? Potential Employee Productivity and Engagement Lost with Travel Friction: Business travelers believe that increasing travel can lead to: of Travel managers believe that improving the travel experience can increase compliance and reduce costs. Do you know why your travelers go out of policy and how much it is really costing you? Why Non-Compliant? The “Carrot” Experience Costs of Non-Compliance The “Stick” Old Ways 20% of travelers go out of policy to upgrade car, and 79% link those decisions to business purposes of travel managers believe improving traveler service can lead to greater compliance and savings 75% of travelers go out of policy, bloating overall costs by 14%, with an average of $314 more annually per traveler 59% of organizations mandate compliance, a decision becoming less and less popular 31% What psychological motivators does your ground transportation solution emphasize?Science of Ground Travel Compliance 75% Greater results 60% 50% Productivity 72% Customer Retention* *New prospects 2x as more likely Without Travel With Travel Between $2.10 and $3.80 in profitability within a 3 year time frame Business Travel ROI (Profitability) YR 1 YR 2 YR 3 ($2) $0 $1 $4 $2 $3 ($1) Every $1 invested in business travel generates $9.50 in revenue Business Travel ROI (Revenue) YR 1 YR 2 YR 3 Delays can cost $108 lost revenue per trip Complaints cost $21 each and lose 160 minutes Current traveler dissatisfaction for car rental 37% and dissatisfaction with choice of car 44% 42% of customers would be lost without in-person meetings $108 $21 160 42% 37% 44% $1 $3 $4 $7 $5 $6 $2 $10 $8 $9 Ancillary Fees 40% 60% Daily Rental Rate Proactively Tracking with Data to Find Efficiencies Daily Rates typically get laser focus - while the “Other 40%” and Proactive Cost Control are Overlooked “The Business Value Formula for Ground Transportation,” Enterprise Holdings, 2016. “The Role of Business Travel in the U.S. Economy,” U.S. Travel Association, 2013. “The Evolution of Travel Policy: A Global View on the Future,” Association of Global Travel Executives, 2015. Sherry, Lance, “A Method for Quantifying Travel Productivity for Corporate Travel Managers,” Journal of Air Transport Management, 42, p. 118-124, 2015. Dolce, Frank et al., “A Numbers Game: Using Strategic KPIs to Demonstrate the Value of Travel Management to Senior Management, 2014. “GBTA Business Traveler Sentiment Index,” October 2015, in partnership with American Express, 2015. “Out-of-Policy Business Travelers and Their Impact on the Bottom Line,” GBTA,sponsored by Concur, 2013. “The Evolution of Travel Policy: A Global View on the Future,” Association of Global Travel Executives, 2015. “The Digital Business Traveler,” GBTA, sponsored by Sabre, 2016.