127 African American Students’ Perceptions of Influentia.docx
Major Paper in Economics
1. Measuring the Effect of Education on White Americans’ Racial
Attitudes
By Kyle E. Taylor*
Access to education, particularly higher education, has been labeled a causal
factor in determining white Americans’ racial attitudes, although some scholars
disagree as to the direction of the effect. While many in sociology consider it an
“iron law” that education begets tolerance (Schaefer, 1996), others argue that it
instead makes dominant groups more aware of their collective interests and
enables them to better defend their privileged position in social hierarchy (Wodtke,
2012). Using cross-sectional data from the 1992-1994 Multi-City Study of Urban
Inequality, I create a metric to gauge white Americans’ attitudes of minority
groups, using a variety of rigorous controls to establish causality. I find that
education has a statistically significant, but immeasurable effect compared to other
variables, particularly those controlling for the setting of the interview and other
unobservable traits. (JEL J15, A14, I26)
This paper seeks to extend previous scholars’ work on the source(s) of whites’ racial attitudes
and further complicate the role education plays in eliminating or sustaining prejudice. While the
majority of previous research has focused exclusively on white-black racial attitudes, this
analysis includes whites’ perceptions of Latinos and Asian-Americans in addition to African-
Americans. By creating innovative measures to control for individual unobserved traits, the
regression analyses presented in this paper more precisely estimate the effect of additional years
of schooling on the favorability with which white Americans view nonwhite Americans
compared to previous studies.
“Racial attitudes” often serves as a catch-all to describe various, and sometimes unrelated,
emotions and perceptions survey respondents hold. Depending on the measure used, researchers
have alternately demonstrated positive trends in whites’ acceptance of other races or shown
*
Department of Economics, Davidson College, Davidson, NC. Thanks to Dr. Mark Foley, Robby Kuster, Sam
Martin, Pablo Zevallos, and other students and faculty who gave me new ideas and inspired me to see the project to
its conclusion.
2. TAYLOR: EDUCATION AND RACIAL ATTITUDES 2
whites to be no friendlier towards material racial equality than they ever have been.1
In my
analysis, “racial attitudes” will be defined narrowly along four equally-weighted categories:
perceptions of intelligence, laziness, amiability, and fairness. The purpose of this empirical
project is to establish a causal link between years of schooling and white survey respondents’
racial attitudes towards nonwhites.
I. Literature Review
National data collection on racial attitudes began in the late 1940’s and continued in earnest
through the Civil Rights Movement. Two reports motivated much of the early research: Gunnar
Myrdal’s An American Dilemma, published in 1944, and Hyman, Sheatsley, Greely, and
Taylor’s Scientific American reports, which began in 1956. Myrdal’s two-volume work cited
what he believed to be a fundamental hypocrisy in the “American Creed”: opportunity and social
mobility were only offered to a subset of the population; a black underclass was systematically
left out of the “creed” (Bobo et al., 2012). The Scientific American reports were more optimistic.
By the end of their second decade of research, scholars described a clear rise in integrationist and
pro-equality sentiment among a wide majority of Americans; educational attainment was
positively correlated with more favorable attitudes, while residence in the South and age were
negatively correlated with favorable attitudes towards blacks (Bobo et al., 2012).
1
Schuman, Steeh, and Bobo’s Racial Attitudes in America (1985) offers perhaps the most complete empirical
profile of the changing nature of racial attitudes, broadly defined, in recent history. The focus in this paper on
quantitative research is not intended to suggest that qualitative research in this field is of secondary importance or
provides less meaningful analysis. Eduardo Bonilla-Silva (2014) tackles the challenges of contemporary racism in
Racism Without Racists.
3. TAYLOR: EDUCATION AND RACIAL ATTITUDES 3
When Howard Schuman, Charlotte Steeh, and Lawrence Bobo published Racial Attitudes in
America in the mid-1980’s, they did so at an inflection point in American racial relations.2
Brown v. Board of Education and the Civil Rights Movement were fading from white
Americans’ collective memory; the new battles were being fought over school busing,
affirmative action, and housing discrimination. Many of the perceived gains from the Civil
Rights Movement were being reversed, and scholars and activists increasingly wondered whether
the attitude shifts seen in previous decades were meaningful changes or socially-pressured
survey responses which had little bearing on the material facts of everyday life.
To understand how and why racial attitudes in America had first shifted towards equality and
then away from it, Schuman and his colleagues combined survey data from the General Social
Surveys, Institute for Social Research, and Gallup. They divided up survey questions into four
categories: questions asking about respondents’ principled views on equality/integration; those
asking about respondents’ support for interventionist policies to increase racial equality; and
those asking about respondents’ comfort living in mixed-race neighborhoods and attending
mixed-race schools. Respectively, they labeled these categories principle, implementation, and
social distance; a fourth category was created for miscellaneous question items (Schuman et al.,
1985). Although Schuman and his colleagues found consistent positive trends in whites’ racial
attitudes on questions of principle across surveys and over time, their research did not establish a
positive trend in whites’ support for questions of implementation, controlling for education.
While the most-educated respondents tended to be on the leading edge of some survey responses,
they only did so on questions on principle or when asked about their feelings towards one or two
2
Other research published at this time includes Apostle et al.’s (1983) work, The Anatomy of Racial Attitudes. His
research team developed the Bay Area Survey, which was focused on identifying the sources of whites’ explanations
for racial inequality.
4. TAYLOR: EDUCATION AND RACIAL ATTITUDES 4
black families moving into their neighborhood. When the questions were related to
implementation or involved a larger proportion of black Americans, educated whites’ responses
converged towards the mean.
The gap between support for equality in principle vs. equality in practice among the most
educated quarters of white America has spawned two leading theories about the role education
plays in shaping racial attitudes. Those in favor of the enlightenment theory of education see it as
a liberalizing and democracy-reinforcing source of knowledge about the world and the historical,
social, and economic factors responsible for shaping it.3
Proponents of enlightenment theory cite
a wealth of survey data which suggests that more educated respondents are more likely to
recognize gender inequities, less likely to hold anti-Semitic views, and more likely to be aware
of environmental degradation, among other issues (Schaefer, 1996). Fundamentally, they argue
that additional years of education increase young people’s commitment to the democratic values
of tolerance and acceptance. Some empirical evidence supports this view: highly educated whites
are more likely to reject racist stereotypes and endorse egalitarian principles than less educated
whites (Schuman et al., 1985; Taylor & Mateyka, 2011; Wodtke, 2012).
Other scholars have taken a more critical view of the response data around questions of
implementation. Jackman (1984) argues provocatively that higher education, rather than
increasing commitment to democratic values, instead cements latent white supremacist
ideologies and allows whites to refine self-interested values, rather than challenge them. This
theoretical perspective, termed ideological refinement, “views education not as enlightening but
rather as an institution that endows dominant groups with a keen awareness of their group
3
See Wodtke (2012), Jackman & Muha (1984), and Schaefer (1996) for more in-depth discussion of the principle
assumptions undergirding the Enlightenment Theory. Wodtke (2014) and Jackman & Muha (1984) compare these
theoretical assumptions to those made by proponents of ideological refinement theory.
5. TAYLOR: EDUCATION AND RACIAL ATTITUDES 5
interests, more advanced cognitive skills, and a set of ideological commitments that enable them
to articulate an astute defense of their privileged position in the social hierarchy” (Wodtke,
2014). Even accepting that college campuses can instill democratic principles in their students,
democratic commitments to individualism and meritocracy may overwhelm more progressive
views on racial integration, especially when racial equality comes to mean equality of outcome at
the expense of equality of opportunity (Shaefer, 1996). Empirical evidence supports this
perspective as well: Bobo and Kluegel (1993) find that white Americans regardless of
educational background are more in favor of redistributive policies which favor the poor than
identically-designed policies which favor minorities, controlling for a variety of demographic
and character-based traits.
Wodtke (2012) and Jackman & Muha (1984) provide two of the most clearly contrasting and
empirically-grounded analyses of the role education plays in shaping racial attitudes. Jackman’s
work focuses broadly on the racial attitudes held by individuals who are members of a dominant
social class (whites, men, and the wealthy). Using 1974 in-person survey data from the Survey
Research Center of the University of Michigan, Jackman and Muha regress white respondents’
attitudes on education, controlling for age, region, and class background; 46 questions, most on a
9-point scale (with positive values suggesting more favorable attitudes), were split equally
between those on race, gender, and class (Jackman & Muha, 1984). All variables were
constructed as splines, with education broken down in component parts of less than high school,
some high school, full high school, some college, bachelor’s, and master’s degree. If education
were to instill egalitarian principles in people, than those should be more clearly expressed as
individuals stay in school longer and result in measurable and statistically significant responses
from research subjects.
6. TAYLOR: EDUCATION AND RACIAL ATTITUDES 6
However, Jackman and Muha (1984) find that increasing education positively affects only
one-fourth of the questions and negatively affects just as many. When controls were introduced,
the coefficients on education categories decrease measurably, and “a clear positive relationship
with education emerges as the exception rather than the rule [across all categories]” (Jackman &
Muha, 1984).
Notably, most of the positive coefficients are found on questions relating to race, which
suggests they may have overstated their claim. In fact, college graduation accounts for half or
more of a standard-deviation improvement in views towards integration, racial intelligence,
perceived laziness, and general feeling of warmth towards nonwhites compared to the omitted
category – less than a high school education (Jackman & Muha, 1984). Particularly, movement
up each additional education bracket measurably improves whites’ perceptions of nonwhites’
dependability and intelligence. Their survey design also has two other flaws: the dummy variable
for age includes only two brackets (younger or older than 34), and they ask respondents to self-
report class status, a procedure which has been widely documented to result in individuals over-
stating their class and increases the possibility of measurement error in the control variables.
Taken together, these arguments suggest that Jackman and Muha’s argument for ideological
refinement (1984) might be based more on respondents’ answers to questions about gender and
class disparities than on those related to racial attitudes.
Wodtke (2012) agrees with Jackman and Muha’s (1984) broad claim that increasing
education does not affect whites’ racial attitudes, but instead posits what he calls a “revised
group interest perspective” based on his empirical analysis. Using data from the General Social
Surveys and Multi-City Study of Urban Inequality, Wodtke compares responses on identical
questions using a logistic regression of negative stereotypes, perceptions of discrimination, and
7. TAYLOR: EDUCATION AND RACIAL ATTITUDES 7
policy preferences on educational attainment (again constructed as a spline). He collapses
whites’ responses from a 7-point scale to a binary scale, with all responses greater than or equal
to 5 assigned a “1”. He controls for political ideology (also on a 7-point scale), gender, age,
native status, parents’ education, income, city, race of the interviewer, and survey year (Wodtke,
2012). This broad set of controls yields more precise estimates than Jackman and Muha (1984)
because it takes into account familial background, the role of the local community, and the
setting of the interview, mitigating concerns of omitted variable bias if any of those traits is
correlated with an individual’s perception of other races. For the regression of whites’
perceptions of other races’ intelligence/work ethic, all coefficients are measurable, statistically
significant, and in the expected direction in both the GSS data and MCSUI (Wodtke, 2012).
Wodtke (2012) does note, however, that increasing education is not positively related to whites’
support for redistributive policies – only those perceived to be opportunity-enhancing. Based on
these mixed findings, he suggests that advanced education serves to marginalize ideas that are
challenging to dominant structures, even if it does also bring some liberalizing values as well.
These data suggest that the implementation-principle gap Schuman identified in the mid-
1980’s persists to the present day. They also point to the pitfall of omitted variable bias in
regression analysis; the interview setting and unobserved personal values may play a larger role
in determining survey respondents’ answers than an individual’s “true” opinions. Any analysis
which does not attempt to control for these unobserved values cannot reliably estimate the role of
education in shaping attitudes, particularly if an individual develops specific values
independently of their schooling (for example, in their families or at the workplace). My model
aims to confront the omitted variable bias problem and control for the setting of the interview to
reliably estimate the role of education in shaping racial attitudes.
8. TAYLOR: EDUCATION AND RACIAL ATTITUDES 8
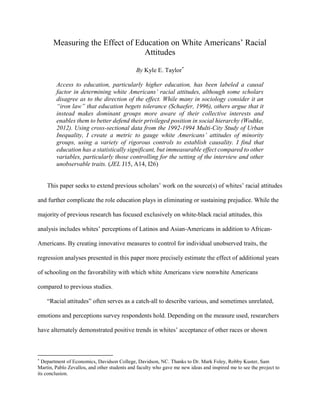
NOTE: a score of 16 indicates neither positive nor negative
favorability; scores below 16 are more favorable.
Table 1: Descriptive Statistics Table 2: Racial Attitudes Statistics
II. Data and Descriptive Statistics
Researchers administering the Multi-City Study of Urban Inequality conducted over 8000
interviews with residents of four cities in the period from 1992-1994.4
The questions they asked
about racial attitudes mirrored exactly those in the General Social Survey; the primary difference
between the two studies is that the GSS aims to provide a representative snapshot of America on
a biannual basis, while the MCSUI aimed more narrowly to capture the lives of Americans,
particularly nonwhite, low-income Americans, in four specific communities. The four cities they
chose – Atlanta, Boston, Detroit, and Los Angeles – had all in recent history been in the national
spotlight as a hotbed of racial unrest (Rodney King in Los Angeles being the most recent
example at that time). Their local emphasis allows for more contextual interpretations of survey
responses, while still making comparisons between GSS responses a worthwhile undertaking.
4
Although the data was collected over the span of three years, data are cross-sectional, not longitudinal.
TARGET
GROUP
RACE
RESPONDENT’S RACE
White Black Latino Asian
White 12.728
(3.353)
15.634
(3.879)
14.252
(4.041)
14.275
(3.230)
Black 16.251
(3.685)
14.628
(3.696)
17.799
(4.020)
18.114
(3.037)
Latino 16.018
(3.722)
16.340
(3.774)
14.731
(3.808)
17.298
(2.788)
Asian 13.448
(3.363)
15.703
(3.509)
14.723
(3.539)
11.678
(2.981)
Variable Mean Std. Dev.
Years of Education 14.229 2.551
Log(Politics) 1.291 0.455
Log(Income) 10.969 0.928
Age 43.192 15.244
Male 0.478 0.499
Log(Own Race
Attitudes)
2.502 0.301
Black Bias 0.005 0.759
Latino Bias 0.003 0.054
Asian Bias 0.015 0.123
Egalitarian Values 0.156 0.363
White Interviewer 0.741 0.438
Black Interviewer 0.083 0.276
Latino Interviewer 0.040 0.197
Asian Interviewer 0.134 0.341
Boston 0.294 0.455
Atlanta 0.244 0.429
Los Angeles 0.461 0.498
Observations 1379
9. TAYLOR: EDUCATION AND RACIAL ATTITUDES 9
In order to construct a single measure of “racial attitudes”, I took data from four survey
questions and added respondents’ answers in those four categories (intelligence, working ethic,
friendliness, and fairness). The survey questions asked respondents to what extent they believed
members of races on average shared particular traits; a response of 1 indicated a positive position
(“blacks are very intelligent”; “Latinos are very easy to get along with”), while a response of “7”
indicated a negative position (“Asians strongly prefer welfare”; “whites treat others very
unequally”). A score of “4” suggested that the particular race was “neither (positive trait) nor
(negative trait)”.
The result is a 24-point favorability index, with the lowest values indicating the greatest
favorability on average; a score of 16 indicates neither a favorable nor unfavorable view of a
particular group. Unlike other researchers who had run regressions on a question-by-question
basis, I chose to create this favorability rating metric because I think it captures more holistically
how individuals perceive members of other races, a valuable insight, I argue, because individuals
do not interact in the narrow categories defined by the GSS and MCSUI. Table 2 summarizes all
survey respondents’ answers to these questions about their own race and other races. Reading the
table horizontally compares how favorably one race is viewed by other races; reading the table
vertically compares how members of one race view other races on average. What is particularly
clear is not that respondents view other races unfavorably in an absolute sense – only that they
view other races less favorably than they view their own. White, black, and Asian respondents
demonstrate a consistent and statistically significant preference for their own race, while Latinos
are the only group who, on average, do not express a statistically significant difference between
how favorably they view their own race in comparison to any other race. Asians’ and Latinos’
10. TAYLOR: EDUCATION AND RACIAL ATTITUDES 10
ratings towards blacks are the most unfavorable scores, while whites’ rating of Asians represents
the most favorable score given to any race that is not the respondent’s own.
To narrow the focus on my analysis, I constricted my data set to white respondents who
answered each of the four questions about all races without skipping or indicating that they “did
not know/hadn’t thought about” an answer.5
This left just over 1350 respondents for my
regression analysis. The average age of these respondents was 43 years old, and just over half
were women. Adjusting for inflation, respondents’ average income was $57,500, and the average
political view was a 3.98 out of 7, evenly split between liberal (1-3) and conservative (5-7).
Educational attainment, expressed as the total number of completed years of schooling, is fairly
high among this group; the average respondent completed at least some college. On the whole,
these summary statistics suggest that respondents were somewhat more liberal than average
white voter during this time and better educated. Given these trends, we might expect these
respondents to have more favorable views of minorities than a representative survey of white
Americans.
III. Econometric Model & Results
I hypothesize a non-linear, negative (read: favorable – this is due to the nature of the
somewhat counter-intuitive favorability index) effect of education on whites’ racial attitudes
towards minorities, with the marginal influence of education increasing as whites continue
through school. I begin by positing the following base model to represent white racial attitudes,
using controls which follow previous scholars’ work:
5
Tossing out “don’t knows” as well as any skipped/missed answers fully eliminated Detroit (respondents were not
asked about Latinos or Asian-Americans). Bobo et al. (2012) argue that the rise in the number of “don’t know”
responses merits further analysis.
11. TAYLOR: EDUCATION AND RACIAL ATTITUDES 11
𝐹𝑎𝑣𝑜𝑟𝑎𝑏𝑖𝑙𝑖𝑡𝑦 = −𝛽1 𝐸𝑑𝑢𝑐𝑎𝑡𝑖𝑜𝑛 + 𝛽2 𝐴𝑔𝑒 + 𝛽3 𝐼𝑛𝑐𝑜𝑚𝑒 + 𝛽4 𝑃𝑜𝑙𝑖𝑡𝑖𝑐𝑠 − 𝛽5 𝐴𝑡𝑙𝑎𝑛𝑡𝑎 −
𝛽6 𝐵𝑜𝑠𝑡𝑜𝑛 − 𝛽7 𝐵𝑙𝑎𝑐𝑘𝐼𝑛𝑡𝑒𝑟𝑣𝑖𝑒𝑤𝑒𝑟 − 𝛽8 𝐿𝑎𝑡𝑖𝑛𝑜𝐼𝑛𝑡𝑒𝑟𝑣𝑖𝑒𝑤𝑒𝑟 − 𝛽9 𝐴𝑠𝑖𝑎𝑛𝐼𝑛𝑡𝑒𝑟𝑖𝑣𝑒𝑤𝑒𝑟 + 𝜀6
Again, because more favorable ratings are lower on the scale, I expect education to be
negatively related with whites’ favorability towards minorities. Similarly, I expect whites
interviewed by nonwhites to give more favorable answers about all nonwhite groups than they
would if they had a white interviewer. Because Los Angeles experienced the most recent racial
unrest, I excluded it from the analysis, assuming that respondents in Atlanta and Boston would
be more favorable towards minorities than would those in Los Angeles. High-income and
conservative politics I also assume will predict less favorable views. If education has a non-
linear effect on racial attitudes following enlightenment theory, we might predict:
𝐹𝑎𝑣𝑜𝑟𝑎𝑏𝑖𝑙𝑖𝑡𝑦 = −𝛽1 𝐸𝑑𝑢𝑐𝑎𝑡𝑖𝑜𝑛 − 𝛽2 𝐸𝑑𝑢𝑐𝑎𝑡𝑖𝑜𝑛2
+ (𝑐𝑜𝑛𝑡𝑟𝑜𝑙𝑠) + 𝜀
where the marginal effect of an additional year of education increases whites’ favorability of
nonwhites at an increasing rate.
Both the linear and nonlinear OLS models suffer from endogeneity problems as a result of
omitted variable bias. White respondents may feel pressure to provide socially acceptable
responses to their interviewers, or, alternately, may be compelled by unobserved values or
principles to view all races equally. Finally, it is possible that respondents have prejudices
towards certain races which may influence their response. If these social pressures, values, and
prejudices are positively correlated with indicating favorability in a survey response, then the
base model will overestimate the role of education in explaining the variance in racial attitudes.
6
In the regression, covariates include: eeduyrs = years of schooling; ln_inc is the log of income; ln_pol is the log of
political ideology; (race)_intv is the race of the interviewer; ln_wav is the log of whites’ favorability of their own
race. Other covariates are self-explanatory.
12. TAYLOR: EDUCATION AND RACIAL ATTITUDES 12
I construct two control variables which are meant to represent unobserved social pressures,
values, and prejudices. The first control is egal_values, a dummy variable indicating if the
respondent gave the same numerical score to all races on one of the four categories. This control
has the benefit of capturing both the social pressures a respondent might feel to give the
perception of being egalitarian-minded as well as the very real value/moral imperative a
respondent might feel to rate all respondents equally.7
11% of white respondents express this
behavior. The second control is a set of bias dummy variables indicating if the respondent gave
the same score to all members of a specific race on all questions – a hypothesized indicator of
systemic prejudice. Very few whites expressed this behavior. A priori, I hypothesize the
following relationship between these controls and the dependent variable:
𝐹𝑎𝑣𝑜𝑟𝑎𝑏𝑖𝑙𝑖𝑡𝑦 = −𝛽1 𝐸𝑔𝑎𝑙_𝑉𝑎𝑙𝑢𝑒𝑠 + 𝛽2 𝐵𝑖𝑎𝑠 + 𝜀
The final control included is the respondent’s log(favorability) score of their own race. This
coefficient on this variable specifies the elasticity between whites’ attitudes towards themselves
and their attitude of others. Because it is possible that respondents were systematically biased on
the day of their interview to give more positive or more negative ratings due to unobserved
factors (being in a bad mood, being apathetic to the survey, etc.), this control is included as well.
OLS regression results presented in Tables 3-5 summarize the effects of additional years of
education on racial attitudes toward nonwhite groups. Column (1) in each table specifies the base
model, and each column moving to the right introduces a new non-linear effect or “value
control”. The log-linear models fit the data just as well as the linear models, and the quadratic
terms for the regression on whites’ attitudes towards blacks and whites’ attitudes towards Latinos
are statistically significant and pass the Ramsey RESET test. The log-linear model also has the
7
Specifically, this dummy variable would be assigned to respondents who believed, for example, that all races were
equally intelligent, even if they didn’t believe that all were equally hard-working or friendly.
13. TAYLOR: EDUCATION AND RACIAL ATTITUDES 13
benefit of providing a more easily interpretable result (“an additional year of schooling shifts
racial attitudes by _X%_, on average, ceretis paribus”). In all regressions, the value controls
dramatically improve the fit of the data and change the sign of the quadratic term from negative
to positive, and the quadratic term remains statistically significant. Interaction terms were tested
in column (5) to see if political views or class have counter-veiling effects on education. Each of
the three sets of regressions will be analyzed in greater detail for the significance of specific
control terms in addition to the variable of interest.
A. WHITE RACIAL ATTITUDES TOWARDS BLACKS
The base model in column (1) confirms my hypothesis in sign but not magnitude. An
additional year of education increases whites’ favorability towards blacks by 0.1 points on the
24-point favorability scale, roughly 5% of a standard deviation. None of the coefficients on age,
sex, income, or city are statistically different than zero. However, the interviewer effects are very
strong in column (1) and throughout the regression, particularly when the interviewer is black.
Looking at column (3), holding constant all other variables, having a black interviewer instead of
a white interviewer improves whites’ stated favorability by 18.6 percentage points – three-
quarters of a standard deviation. Interviewer effects are also statistically significant when the
interviewer is Latino, but are not statistically different between Asian and white interviewers.
Respondents who display egalitarian values are 30.6 percentage points more favorable towards
blacks in the same regression. Meanwhile, an additional year of education at the mean of all
other variables increases by a pedestrian 0.9 percentage points. The interaction terms in column
(5) are also not statistically different from zero.
15. TAYLOR: EDUCATION AND RACIAL ATTITUDES 15
B. WHITE RACIAL ATTITUDES TOWARDS ASIANS
The regression of whites’ racial attitudes towards Asian-Americans yields a very different
result, although one that is similarly pessimistic about the role education plays in implanting
favorable values towards minorities. Some of the controls which were insignificant in the
regression involving whites’ attitudes towards blacks are consistently significant here,
particularly the city and age variables. I hypothesize that this is due to the higher prevalence of
Asian-Americans living on the west coast, where they are more likely to be neighbors and co-
workers of the survey respondents. Similarly, aging ten years 0.7 percentage points less
favorable toward Asian-Americans, a trend likely due to older whites’ memories of WWII and
the Vietnam War. Additional years of schooling, meanwhile, do not display a nonlinear
relationship with favorability, and only account for a 0.7 percentage point increase in favorability
at the mean of the control variables using the regression in column (3). Again, the interaction
terms are not statistically significant.
C. WHITE RACIAL ATTITUDES TOWARDS LATINOS
The coefficients on education in the regression on white attitudes toward Latino-Americans
appears similar to that in the regression on attitudes towards black Americans, although
additional years of education have a slightly more positive effect. Using the regression in column
(3), an additional year of education increases whites’ favorability by 1.3 percentage points at the
means of the other variables. Again, some covariates which were insignificant in the regression
on black attitudes are significant here: sex and city. Women are less favorable towards Latinos
than men, and Bostonians are more favorable than those in any other city.
18. TAYLOR: EDUCATION AND RACIAL ATTITUDES 18
D. ASSESSMENT OF VALIDITY & CAUSALITY
Interviewer effects and egalitarian behavior are the strongest and most statistically significant
predictors of whites’ racial attitudes in these regressions. However, it is important to understand
whether egalitarian views in particular are collinear with education or endogenous to racial
attitudes. If, for example, additional years of schooling increases the likelihood that an individual
displays egalitarian values, then including that term in the regression will dampen the effect of
education and make it appear to be less meaningful in determining attitudes than it in fact is. I
tested this hypothesis using probit and logit regressions on both years of schooling and whether
the respondent had a bachelor’s degree, controlling for the same factors included in all other
regressions. Holding a bachelor’s degree increases the likelihood that an individual will display
egalitarian values by 4.5 percentage points in the probit regression, while an additional year of
school increases the likelihood of exhibiting this behavior by 0.5 percentage points on average in
a similar probit regression. Thus, I conclude that exhibiting egalitarian values in the interview
setting is not co-determined by educational background.
Other sources of endogeneity might stem from sample selection bias. If individuals with
moderate views are the ones most likely to indicate that they “do not know/haven’t thought about
it”, then excluding them from the regression might understate the role of education in increasing
white respondents’ favorability towards minorities. However, given the magnitude of the
coefficient on the variable-of-interest, is likely that even finding a way to coax responses out of
moderate or apathetic individuals would have little effect on the regression results.
20. TAYLOR: EDUCATION AND RACIAL ATTITUDES 20
E. SELF-REVELATION MODEL
After assessing all regression models for their internal and external validity and the
significance of their coefficients, I constructed the self-revelation models displayed in Table 6.
Most notably, the “best” model is the one predicting whites’ favorability towards blacks, with
views towards Asian-Americans being the least accurately predicted. I hypothesize that this is
the case because the social pressures and stigma associated with indicating negative views of
blacks are more salient than those related to Latinos or Asians, particularly in the early 90’s. The
coefficient on black_intv in the regression analyzing attitudes towards blacks is larger and more
significant than any other interviewer coefficient in any other regression. Moving from equation
(1) to (3), the average marginal effect of an additional year of education is -1.1 percentage
points, -1.6 percentage points, and -1.1 percentage points.
IV. Discussion
Including rigorous controls diminishes the effect of education on racial attitudes towards all
minority groups and changes the sign of the quadratic term in the regression from negative to
positive. This finding contradicts my null hypothesis, but confirms Schuman et al. (1983) and
Wodtke’s (2012) studies, as both found that more educated white Americans were more likely to
express favorable views of minorities on certain questions, but that the effect diminishes past a
certain point. In general, my results provide good reason to be skeptical about the role of
education in creating more tolerant individuals, particularly given that the effect of additional
years of schooling on racial attitudes decreases with more education. Importantly, because my
coefficients are significant, and, over the very long term, measurably effect racial attitudes
21. TAYLOR: EDUCATION AND RACIAL ATTITUDES 21
towards minorities, I reject Jackman and Muha’s (1984) claim that the most educated members
of society are those with the most hostile racial attitudes.
Collecting survey data to measure racial attitudes could in itself be a significant barrier to
understanding the state of racial relations in America. Because of the profound role interviewer
effects play in mediating survey answers, people may simply respond to the social cues of the
situation, rather than spend time in thought reflecting on where their “true” values lie. Because
the GSS and MCSUI both use interviews to conduct their research, it is imperative that empirical
analysis control for race-of-interviewer effects. Moreover, because many of the reasons why
survey-takers respond to racially-loaded questions in ways that are unobservable and value-
driven, researchers need to continue to search for more and more rigorous ways to control for
them. More than providing reason for skepticism about the role of education in shaping racial
attitudes, my results suggest reason for being skeptical of the data itself.
22. TAYLOR: EDUCATION AND RACIAL ATTITUDES 22
REFERNCES
Apostle, Richard A.; Glock, Charles Y.; Piazza, Thomas and Suelzle, Marijean. The
Anatomy of Racial Attitudes. Berkeley: University of California Press, 1983.
Bobo, Lawrence D.; Charles, Camille Z. ; Krysan, Maria and Simmons, Alicia D. “The Real
Record on Racial Attitudes.” In Social Trends in American Life. Ed. Marsden, Peter V.
Princeton: Princeton University Press, 2012, pp. 38-83.
Bobo, Lawrence; Johnson, James; Oliver, Melvin; Farley, Reynolds; Bluestone, Barry;
Browne, Irene; Danziger, Sheldon; Green, Gary; Holzer, Harry; Krysan, Maria;
Massagli, Michael; Charles, Camille Z.; Kirschenman, Joleen; Moss, Philip and Tilly,
Chris. Multi-City Study of Urban Inequality, 1992-1994: [Atlanta, Boston, Detroit, and Los
Angeles]. ICPSR02535-v3. Ann Arbor, MI: Inter-university Consortium for Political and
Social Research [distributor], 2000. http://doi.org/10.3886/ICPSR02535.v3
Bobo, Lawrence and Kluegel, James R. “Opposition to Race-Targeting: Self-Interest,
Stratification Ideology, or Racial Attitudes?” American Sociological Review, August 1993,
58(4), pp. 443-464.
Jackman, Mary R. “Individualism, Self-Interest, and White Racism.” Social Science Quarterly,
December 1996, 77(4), pp. 760-767.
Jackman, Mary R. and Muha, Michael J. “Education and Intergroup Attitudes: Moral
Enlightenment, Superficial Democratic Commitment, or Ideological Refinement?”
American Sociological Review, December 1984, 49(6), pp. 751-769.
Schaefer, Richard T. “Education and Prejudice: Unraveling the Relationship.” The Sociological
Quarterly, Winter 1996, 37(1), pp. 1-16.
Schuman, Howard; Steeh, Charlotte and Bobo, Lawrence. Racial Attitudes in America:
Trends and Interpretations. Cambridge: Harvard University Press, 1985.
Taylor, Marylee C. and Mateyka, Peter J. “Community Influences on White Racial Attitudes:
What Matters and Why?” The Sociological Quarterly, 2011, 52(2), pp. 220-243.
Tuch, Steven A. and Hughes, Michael. “Whites’ Racial Policy Attitudes.” Social Science
Quarterly, December 1996, 77(4), pp. 723-745.
Wodtke, Geoffrey T. “The Impact of Education of Intergroup Attitudes: A Multiracial
Analysis.” Social Psychology Research, 2012, 75(1), pp. 80-106.