1. Entrepreneurship: Innovation through Root cause analysis for process
problem solving
1.0 Introduction
Energy Conservation efforts plays the central role in evaluating the efficacy and cost of climate
change policies. Ultimately, total greenhouse gas (GHG) emissions are the product of population,
economic activity per capita, energy use per unit of economic activity, and the carbon intensity of
energy used. Although greenhouse gas emissions can be limited by reducing economic activity, this
option obviously has little appeal. Much attention has therefore been placed on the role of
technological improvements of the existing /development of new technology. These two parameters
can play in a major role in reducing carbon emissions and in lowering the cost of those reductions.
In addition, the influence of technological changes on the emission, concentration, and cost of
reducing GHGs will tend to overwhelm other factors, especially in the longer term. Understanding
the process of technological change is therefore of utmost importance. Nonetheless, the task of
measuring, modelling, and ultimately influencing the path of technological development is fraught
with Complexity and uncertainty as are the technologies themselves.
In one of the studies sponsored by the Petroleum Conservation Research Association (PCRA) under
ministry of petroleum and Natural Gas, Govt. of India, the cluster of glass manufacturing industries
in Firozabad was selected for developing and demonstrating some such technology solutions which
are very simple and do not need any high tech or cost intensive options.
The aim was also to develop low cost technological solutions and best practices to be adopted at the
workstations of glass and bangle sector, which is highly energy intensive by nature.
About Firozabad Glass cluster:
Situated about 40 km eastwards from the Taj Mahal city of Agra, is a very unique and exciting
world altogether different from the international glamour of the Taj, but producing equally beautiful
products. The glass industry in the town has a 300 years old history and accounts for about 70% of
all the glass tableware produced in India, in the unorganized sector and about 90% of the bangles
made in India. These industries were using coal as the main source of fuel, which polluted the air
quality, especially in terms of particulate matter and sulphur oxides. Many studies also identified
that this had indeed caused damage to the white marble of Taj Mahal. Upon a government initiated
process, the honourable Supreme Court of India asked the industries to either switch over to the fuel
Prof. K. R. Chari: Birla Institute of Management Technology: Greater Noida: UP- 2011306
2. Entrepreneurship: Innovation through Root cause analysis for process
problem solving
sources from coal /Coke to natural gas which is considered as clean fuel, or get ready for permanent
closure. The industry was desperately looking for technical assistance to improve their
environmental and energy performance efforts at their premises. Most of the units have since
switched over to natural gas as a fuel. However, even the carbon foot print of the fuel is
insurmountable.
Observations:
While a large number of areas needing improvements were identified, it was decided to select a few
very critical areas accounting for the major portion of carbon emission in the entire route of
manufacturing glass bangles.
A thorough process study was undertaken and critical analysis of the processes and methods was
carried out.
The two major areas needing immediate attention emerged as;
1: Frequent failure of pots (used for melting glass)
And
2: Inefficient and traditional design of furnaces (Talli bhatti and Sikai bhatti) used for
intermediate stage processing of glass.
1: Frequent failure of pots (used for melting glass)
During the discussions with the owners, it came out that they were really concerned about the
frequency of failure of pots. Whenever a pot fails, it adds to about 2 and half hours addition in the
batch processing cycle times. The average cycle time is a typical 16 hours.
A pot furnace is a cylindrical structure, which accommodates between 10 to 12 of such pots. The
pots are like tea cups without handles to hold. Each has a diameter of about 3 and half feet and a
height of 24” to 30”.
While heating the raw material ( a basic mixture of siliceous sand and chemicals) in these pots,
sometimes the pots fail and the whole raw material either flows out (if in liquid form) or is lost (if
still under process), depending upon the stage of the batch.
Prof. K. R. Chari: Birla Institute of Management Technology: Greater Noida: UP- 2011306
3. Entrepreneurship: Innovation through Root cause analysis for process
problem solving
It takes only about a maximum of 25 minutes for the highly skilled team to replace the failed pot
with a new pot. However, the process of removing and replacing a new pot involves opening up of
one window of the pot furnace. Each window provides access to one pot. Picture-1 and Picture-2
depict the exposure of high temperature zone to the environment. The inside temperature being of
the order of about 14500C to 16000C, starts loosing heat at a very high rate to the atmosphere. In
this process, the system looses enough heat, which requires about 2 hours and 30 minutes to
stabilise again. This amount of lost heat is considerable, effecting the profitability of the unit.
Picture-3 shows the positioning of a new pot as a replacement.
Picture-1 (The door broken open) Picture-2: Gaping opening of the section.
Picture-3
A study of the earlier failed pots was carried out. Pictures 4 through 6 show different types of
failure of pots.
Prof. K. R. Chari: Birla Institute of Management Technology: Greater Noida: UP- 2011306
4. Entrepreneurship: Innovation through Root cause analysis for process
problem solving
Picture-4 Picture-5
Picture-6
Data collection and analysis:
Luckily enough, the unit had a system in place for recording the change of failed pots.
The unit owners reported that the maximum pot life was about 75 days, however, not to take
chances with any variations, it was decided to consider data for at least six months, double the
period of reported maximum life. The data for 6 preceding months (4-5-2008 TO 13-10-2008: 165
days) was analysed for one unit, M/s Durga Glass Works, was gathered (Table-1) for two pots furnaces
the company was ussing, and analysed as follows.
Prof. K. R. Chari: Birla Institute of Management Technology: Greater Noida: UP- 2011306
5. Entrepreneurship: Innovation through Root cause analysis for process
problem solving
Table-1: Comparative TBF of pots in Furnace No. 1 (12 pots) and Furnace No. 2 (11 pots)
Company Name: M/s Durga Glass Works
Observation period: (4-5-2008 TO 13-10-2008: 165 days):
The following table provides the life of the pot in terms of no. of days (column 1), No. of pots failed
in Pot furnace 1 (column 2) and No. of pots failed in Pot furnace 2 (column 3).
TBF (Time between No. of Failures
failures) Days Pot Furnace No. 1 Pot Furnace No. 2
1 0 3
2 3 2
3 1 3
4 0 2
5 0 2
6 2 4
7 8 10
8 3 7
9 3 7
10 8 8
11 2 8
12 6 8
13 9 4
14 2 13
15 4 8
16 4 3
17 3 3
18 5 3
19 1 0
20 3 3
21 3 7
22 3 1
23 4 0
24 4 2
25 1 3
26 1 1
27 2 0
28 1 4
29 1 0
30 1 1
31 3 1
32 1 1
33 0 0
34 2 2
Prof. K. R. Chari: Birla Institute of Management Technology: Greater Noida: UP- 2011306
7. Entrepreneurship: Innovation through Root cause analysis for process
problem solving
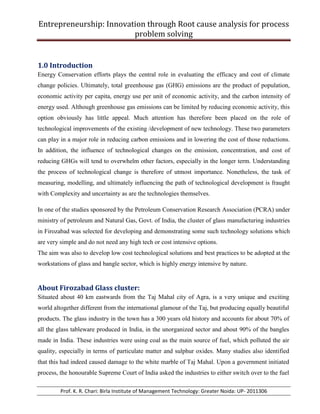
Considering the number of pots in the furnace, the furnace no. 2 performed even worse, at about 40
% higher rate of failure. The above data is graphically shown in Graphs 1 (Furnace 1) and Graph 2
(Furnace 2). On the X axis is the position of pot in the furnace and on Y axis are the total no. of
failures of pots in the observation period.
Pot Furnace No. 1: Total pot failures (April to October 2008)
16
14
12
No. of failures
10
8
6
4
2
0
1 2 3 4 5 6 7 8 9 10 11 12
Pot No.
Graph-1
Pot Furnace No. 2: Total pot failures (April to October 2008)
20
18
16
14
12
10
8
6
4
2
0
1 2 3 4 5 6 7 8 9 10 11
Total pot failures
Graph – 2
Prof. K. R. Chari: Birla Institute of Management Technology: Greater Noida: UP- 2011306
8. Entrepreneurship: Innovation through Root cause analysis for process
problem solving
Graph-3 provides a comparative picture of pot failures in both the furnaces.
Comparative MTBF of Furnace 1 and Furnace 2
14
12
10
No. of Failures
8
6
4
2
0
1 3 5 7 9 11 13 15 17 19 21 23 25 27 29 31 33 35 37 39 41 43 45 47 49 51 53 55 57 59 61 63 65 67 69 71 73 75
MTBF (Days) Furnace 1 Furnace 2
Graph-3
It may be observed that the maximum pot life in furnace 1 was 75 days whereas in furnace 2 it was
only 52 days. This helped in concluding that apart from higher failure rate of pots, the pot life also
was much shorter in furnace 2 as compared to furnace 1.
A further analysis showed that most of the failure of pots were in a time frame of between 5 to 30
days in furnace 1 and 5 to 20 days in furnace 2.
Graph-4 and Graph-5 provide the distribution of pot lives in two furnaces.
Prof. K. R. Chari: Birla Institute of Management Technology: Greater Noida: UP- 2011306
9. Entrepreneurship: Innovation through Root cause analysis for process
problem solving
No. of Failures v/s Days of life of pots
10
8
No. of failures
6
4
2
0
1 3 5 7 9 11 13 15 17 19 21 23 25 27 29 31 33 35 37 39 41 43 45 47 49 51 53 55 57 59 61 63 65 67 69 71 73 75
Life of pots in days
Graph-4: Pot failure frequency for normal and general glasses (Furnace 1).
14
12
10
8
6
4
2
0
1 3 5 7 9 11 13 15 17 19 21 2 25 27 2 31 3 35 37 3 41 4 45 47 4 51
Graph-5: Pot failure frequency for Red Glass. (Furnace 2)
Prof. K. R. Chari: Birla Institute of Management Technology: Greater Noida: UP- 2011306
10. Entrepreneurship: Innovation through Root cause analysis for process
problem solving
Failure Pattern:
The main observations:
1: The frequency of failure of pots in Pot Furnace No. 1 have been much lower than those in
Pot Furnace No. 2.
2: In Pot Furnace No. 2, the life of any pot has not gone beyond 52 days, whereas in case of
Pot Furnace No. 1 the pots have lived up to a maximum of 75 days.
3: On enquiring about the probable reasons for this happening, it was brought to notice that
Pot Furnace No. 2 is always used to produce Red Glass, which has Selenium as an
additional ingredient. This is known to attack the pot material by eating it (dissolving)
faster. This was corroborated by responses from other units also which are manufacturing
Red Glass.
The layout of the pots in the two furnaces is shown in Picture-7
1 12 1 11
2 2
11
10
10
3
3
9
9
4
4
8
8
5
5
7
6 7 6
Pot Furnace No. 1 Pot Furnace No. 2
Picture-7
Prof. K. R. Chari: Birla Institute of Management Technology: Greater Noida: UP- 2011306
11. Entrepreneurship: Innovation through Root cause analysis for process
problem solving
The data gathered was further grouped according to the position of the failed pots.
It was observed that most of the failures were in the zone highlighted by the elliptical zones, as in
Picture-8.
1 12 1 11
2 2
11
10
10
3
3
9
9
4
4
8
8
5
7 5 7
6 6
Pot Furnace No. 1 Pot Furnace No. 2
Picture-8
Understanding the pot making:
With a view to understand the process of making the pots, a visit was made to one of the suppliers
of the pots. Picture -9. The pot manufacturer was not in a position to provide any details about the
composition of the raw material used for the pots, except that he was bringing the raw material from
a place named Katni in Madhya Pradesh, known for it’s Lime industry.
Prof. K. R. Chari: Birla Institute of Management Technology: Greater Noida: UP- 2011306
12. Entrepreneurship: Innovation through Root cause analysis for process
problem solving
Picture-09
Chemical composition of raw material of the pots:
Having understood the reasons for higher failure rates of pots as chemical composition of the raw
material, it was decided to go deepr in to the chemistry of the raw material, with a hope that perhaps
the chemical composition of the raw material of the pot could throw some light.
A sample of the material was sent to a laboratory. The following results were reported by the
laboratory (Table 2).
Table-2: Results of raw Material analysis
S.No. Parameters Test Results (%)
1 LOI 7.52
2 SiO2 67.28
3 IR NIL
4 Al2O3 19.88
5 Fe203 1.00
6 CaO 0.68
7 SO3 0.14
8 MgO 0.60
From the chemical analysis report, it was observed that the major component of the raw material
was Silica (SiO2), standing at 67.28%.
Prof. K. R. Chari: Birla Institute of Management Technology: Greater Noida: UP- 2011306
13. Entrepreneurship: Innovation through Root cause analysis for process
problem solving
This was indeed an eye opener and a shock. It was realised that Silica is also the raw material for
making glass, and that the pot itself contained a major portion of Silica. It was natural for the borax
power to eat in to the pot material. Added to this, Selenium also was reported to have a high affinity
to silica. The picture was emerging much clearer now.
Having realised the fact that the raw material of the pot itself was the culprit, a search for an
alternate material was taken up. A series of discussions with the ceramics experts were held, and
some suggested materials were put forth. However, the initial prohibitively high cost of such
materials became a constraint and a road block for immediate futher work.
However, our earlier works in iron and steel foundries helped at this stage. The foundries normally
use graphite crucibles for handling molten cast iron and steel. These are also exposed to similar
temperatures of 15000C to 16000C. A set of 2 such small size crucibles were brought from the
nearby town of Agra. Picture-10.
Picture-10
A request was made to the management of M/s Durga Glass Works to help in making a trial furnace
to accommodate the smaller crucibles, so that sample glass can be made and the usability of the
crucibles can be tested. The management, very readily agreed to help and a prototype furnace was
constructed as shown stage wise in Pictures 11 through 15.
Prof. K. R. Chari: Birla Institute of Management Technology: Greater Noida: UP- 2011306
14. Entrepreneurship: Innovation through Root cause analysis for process
problem solving
Picture-11 Picture-12
Picture-13 Picture-14
Picture-15
Findings:
A total of 10 samples of 5 Kgs. lots were produced in the graphite cruicible. The quality control
department of the company certified each lots. After this experiment, the people on the shop floor of
the company, who had 20 to 30 years of experience in glass making, expressed their ultimate
satisfaction and said that the cruicible material has proved itself and the crucibles will last a very
long time, thereby solving the problem of frequent failures of pots.
Prof. K. R. Chari: Birla Institute of Management Technology: Greater Noida: UP- 2011306
15. Entrepreneurship: Innovation through Root cause analysis for process
problem solving
Environmental Impact of the pot failures:
Not only that it adds to the cost of manufacturing, the frequent failures of these pots has iit’s own
share of impact on the environment and carbon foot print.
Concerns of the short life of pots:
1: With every failure of a pot, the company looses 500 kgs. of molten glass.
2: Additional cycle time of 2 and half hours due to the temperature drop of about 2500C
3: The corresponding loss of gas is of the order of 185 SCM (Standard Cubic Meters) of
natural gas. (2,200 SCM for 12 pots)
3: The total loss of natural gas per pot failure was estimated at about 320 Standard Cubic
Metres (SCM).
Considering that the weighted average pot life as 20 days, and that the town has a total of about
1100 pots in operation every day of the year, the daily pots consumed in Firozabad were estimated
to be about 1100/20 OR say about 55 pots per day. If we consider the low life of Red Glass pots,
the figures may as well be about 65 pots per day.
At an average consumption of 60 pots per day. This was corroborated by the suppliers of the pots.
This means a whopping figure of about 19,200 (320 SCM/pot * 60 pots/day) * 365 or 7,008,000
SCM of gas per annum.
Considering the density of Natural gas as 0.7 Kg. per cubic meter (Methane), this amounts to about
4,900 Metric Tonnes per annum.
Again, considering that 16 Kgs. of CH4 gives 44 Kgs. of CO2, this results in to about (44/16)*4,900
OR = 13,490 Metric Tonnes of Carbon Dioxide. At about Rs. 30,000 per tone, the waste of natural
gas itself is about Rs. 14,70,00,000 per annum. All this can add to the economy of the town, if only
the solution is implemented.
And that is a great Carbon Foot Print.
Future course:
Having realised that the experimental runs with an alternate material is in deed feasible, the future
pots need to be developed with the material of the graphite crucibles. Or even a better glass resistant
ceramic material need to be identified or developed.
Prof. K. R. Chari: Birla Institute of Management Technology: Greater Noida: UP- 2011306
16. Entrepreneurship: Innovation through Root cause analysis for process
problem solving
Next step:
A visit to the manufacturers of graphite cruicibles in Rajahmundry in Andhra Pradesh was
undertaken and discussions with the manufacturers were held. Some of the owners of the units in
Firozabad have expressed their interest in using the same.
Prof. K. R. Chari: Birla Institute of Management Technology: Greater Noida: UP- 2011306