Requirements for the Next-Generation Autonomous Vehicle Ecosystem
NATMEC2016 - Development of QAQC Processes for BikePed Data
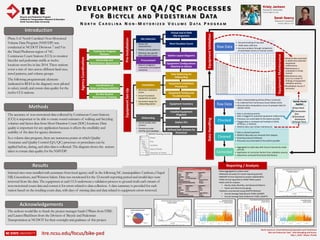
1. Reporting / Analysis
•Data aggregated to station level
•Released annually (12-month reporting period)
•NMVDP Format reported to project stakeholders
•TMG Format exported to FHWA TMAS system
•Data used for analysis:
• Hourly, Daily, Monthly, and Seasonal Patterns
• Factor and Volume Groupings
•Statistics summarized using AASHTO Method:
• Annual Average Daily Bicycle Traffic (AADBT)
• Annual Average Daily Pedestrian Traffic (AADPT)
• Assess site
characteristics
• Predict activity patterns
• Minimize site-specific
data collection issues
Pre-Installation
Site Selection
Virtual and In-field
Site Inspection
Short Duration Count
Procurement
Station Layout Diagrams
Equipment Configurations
Matched to Station
EquipmentSet-Up
Installation
Data Gathering for
Onboarding
Equipment Installation
Procedures
Equipment Testing and
Troubleshooting
Onboarding
Equipment Inventory
Installed Equipment
Diagrams
Station ID’s
Defined Data Streams for
Download
Phase I of North Carolina’s Non-Motorized
Volume Data Program (NMVDP) was
conducted in NCDOT Divisions 7 and 9 in
the Triad/Piedmont region of NC.
Continuous Count Stations (CCS) to monitor
bicyclist and pedestrian traffic at twelve
locations went live in late 2014. These stations
cover a mix of sites across different land uses,
travel patterns, and volume groups.
The following programmatic elements
(indicated in RED in the diagram) were piloted
to select, install, and ensure data quality for the
twelve CCS stations.
Introduction
Kristy Jackson
Research Associate
knjackso@ncsu.edu
Sarah Searcy
Research Assistant
sesearcy@ncsu.edu
The authors would like to thank the project manager Sarah O’Brien from ITRE
and Lauren Blackburn from the Division of Bicycle and Pedestrian
Transportation at NCDOT for their oversight and guidance of this project.
Acknowledgements
• Ensure quality data
streams
• Provide accurate
labeling and metadata
• Minimize installation
errors
• Ensure functional
equipment at onset
• Document inputs for
onboarding station
Training for Program
Partners
Ownership and
Maintenance Agreements
Coordination of
Roles and Responsibilities
On-Site Routine
Maintenance Training
•INVALID data examined
to determine potential
equipment
malfunctions
•Maintenance is
scheduled in timely
manner
•Maintenance may
occur as a result of
findings of equipment
validation process
•Revalidation occurs if
necessary
itre.ncsu.edu/focus/bike-ped
D E V E L O P M E N T O F Q A / Q C P R O C E S S E S
FO R B I C YC L E A N D P E D EST R I A N DATA
AgencyCoordination
EquipmentValidationDataHandling
• Data is downloaded quarterly (Phase I protocol)
• As collected from Continuous Count Station (CCS)
• Minimal data manipulation occurs to prepare data for
QA/QC checks
QA/QC Checks
Applied :
Gap Check
Consecutive
Zero
Directional
Distribution
Range Check
Checked
• Data is checked quarterly
• Data is flagged for potential equipment malfunctions
• Processes are automated to the extent possible
• Flagged data is reviewed and marked as VALID,
ATYPICAL, or INVALID
• INVALID data may initiate maintenance
Cleaned
• Data is cleaned quarterly
• INVALID data days are removed from dataset
• Cleaning protocols followed
• Processes are automated to the extent possible
Corrected
• Aggregated to daily data with hourly intervals by mode
and site
• Application of correction factors from validation process
• Determine corrected Directional Distribution
Raw Data
Raw Data
• Ground-truthing of raw data
• Video data collection
• Accuracy analysis through comparison
of automated counts to manual counts
EquipmentMaintenance
• Balance budgetary
constraints and program
outcomes
The accuracy of non-motorized data collected by Continuous Count Stations
(CCS) is important to be able to create sound estimates of walking and bicycling
volumes and factor data from Short Duration Count (SDC) locations. Data
quality is important for any application because it affects the credibility and
usability of the data for agency decisions.
In a volume data program, there are numerous points at which Quality
Assurance and Quality Control (QA/QC) processes or procedures can be
applied before, during, and after data is collected. The diagram shows the actions
taken to ensure data quality for the NMVDP.
Methods
Selected sites were installed with assistance from local agency staff in the following NC municipalities: Carrboro, Chapel
Hill, Greensboro, and Winston-Salem. Data was monitored for the 12-month reporting period and invalid days were
removed from the data. The equipment at each CCS underwent a validation process to ground-truth each stream of
non-motorized count data and correct it for errors related to data collection. A data summary is provided for each
station based on the resulting count data, with days of missing data and data related to equipment errors removed.
Results
NMVDP Naming Format:
Mode
City
Side of Street
Direction of Travel
Location
Bicycle and Pedestrian Program
Institute for Transportation Research & Education
North Carolina State University
N O R T H C A R O L I N A N O N - M O T O R I Z E D V O L U M E D A T A P R O G R A M
Table 1 Summary Volume Statistics
(1) (2) (3)
Durham, NC – American Tobacco Trail (12/01/2014 – 11/30/2015)
Pedestrians
Highest Volume Lowest Volume
Season Spring Winter
Month May February
Day of Week Saturday Friday
Date Sun. Feb 8, 2015 (1,056) NA
Peak Period Weekends 8AM-5PM
12 Month Pedestrian Count 101,720
Annual Average Daily Pedestrian Traffic 349 AADPT
Bicyclists
Highest Volume Lowest Volume
Season Summer Winter
Month August February
Day of Week Sunday Thursday
Date Mon. May 25, 2015 (1,038) NA
Peak Period Sundays 10AM-4PM
120
128
12 Month Bicycle Count 92,480
128Annual Average Daily Bicycle Traffic 260 AADBT
North American Travel Monitoring Exposition and Conference
Bike and Pedestrian Data: Data Wrangling and Access
May 1, 2016 - Miami, Florida