Download as PDF, PPTX

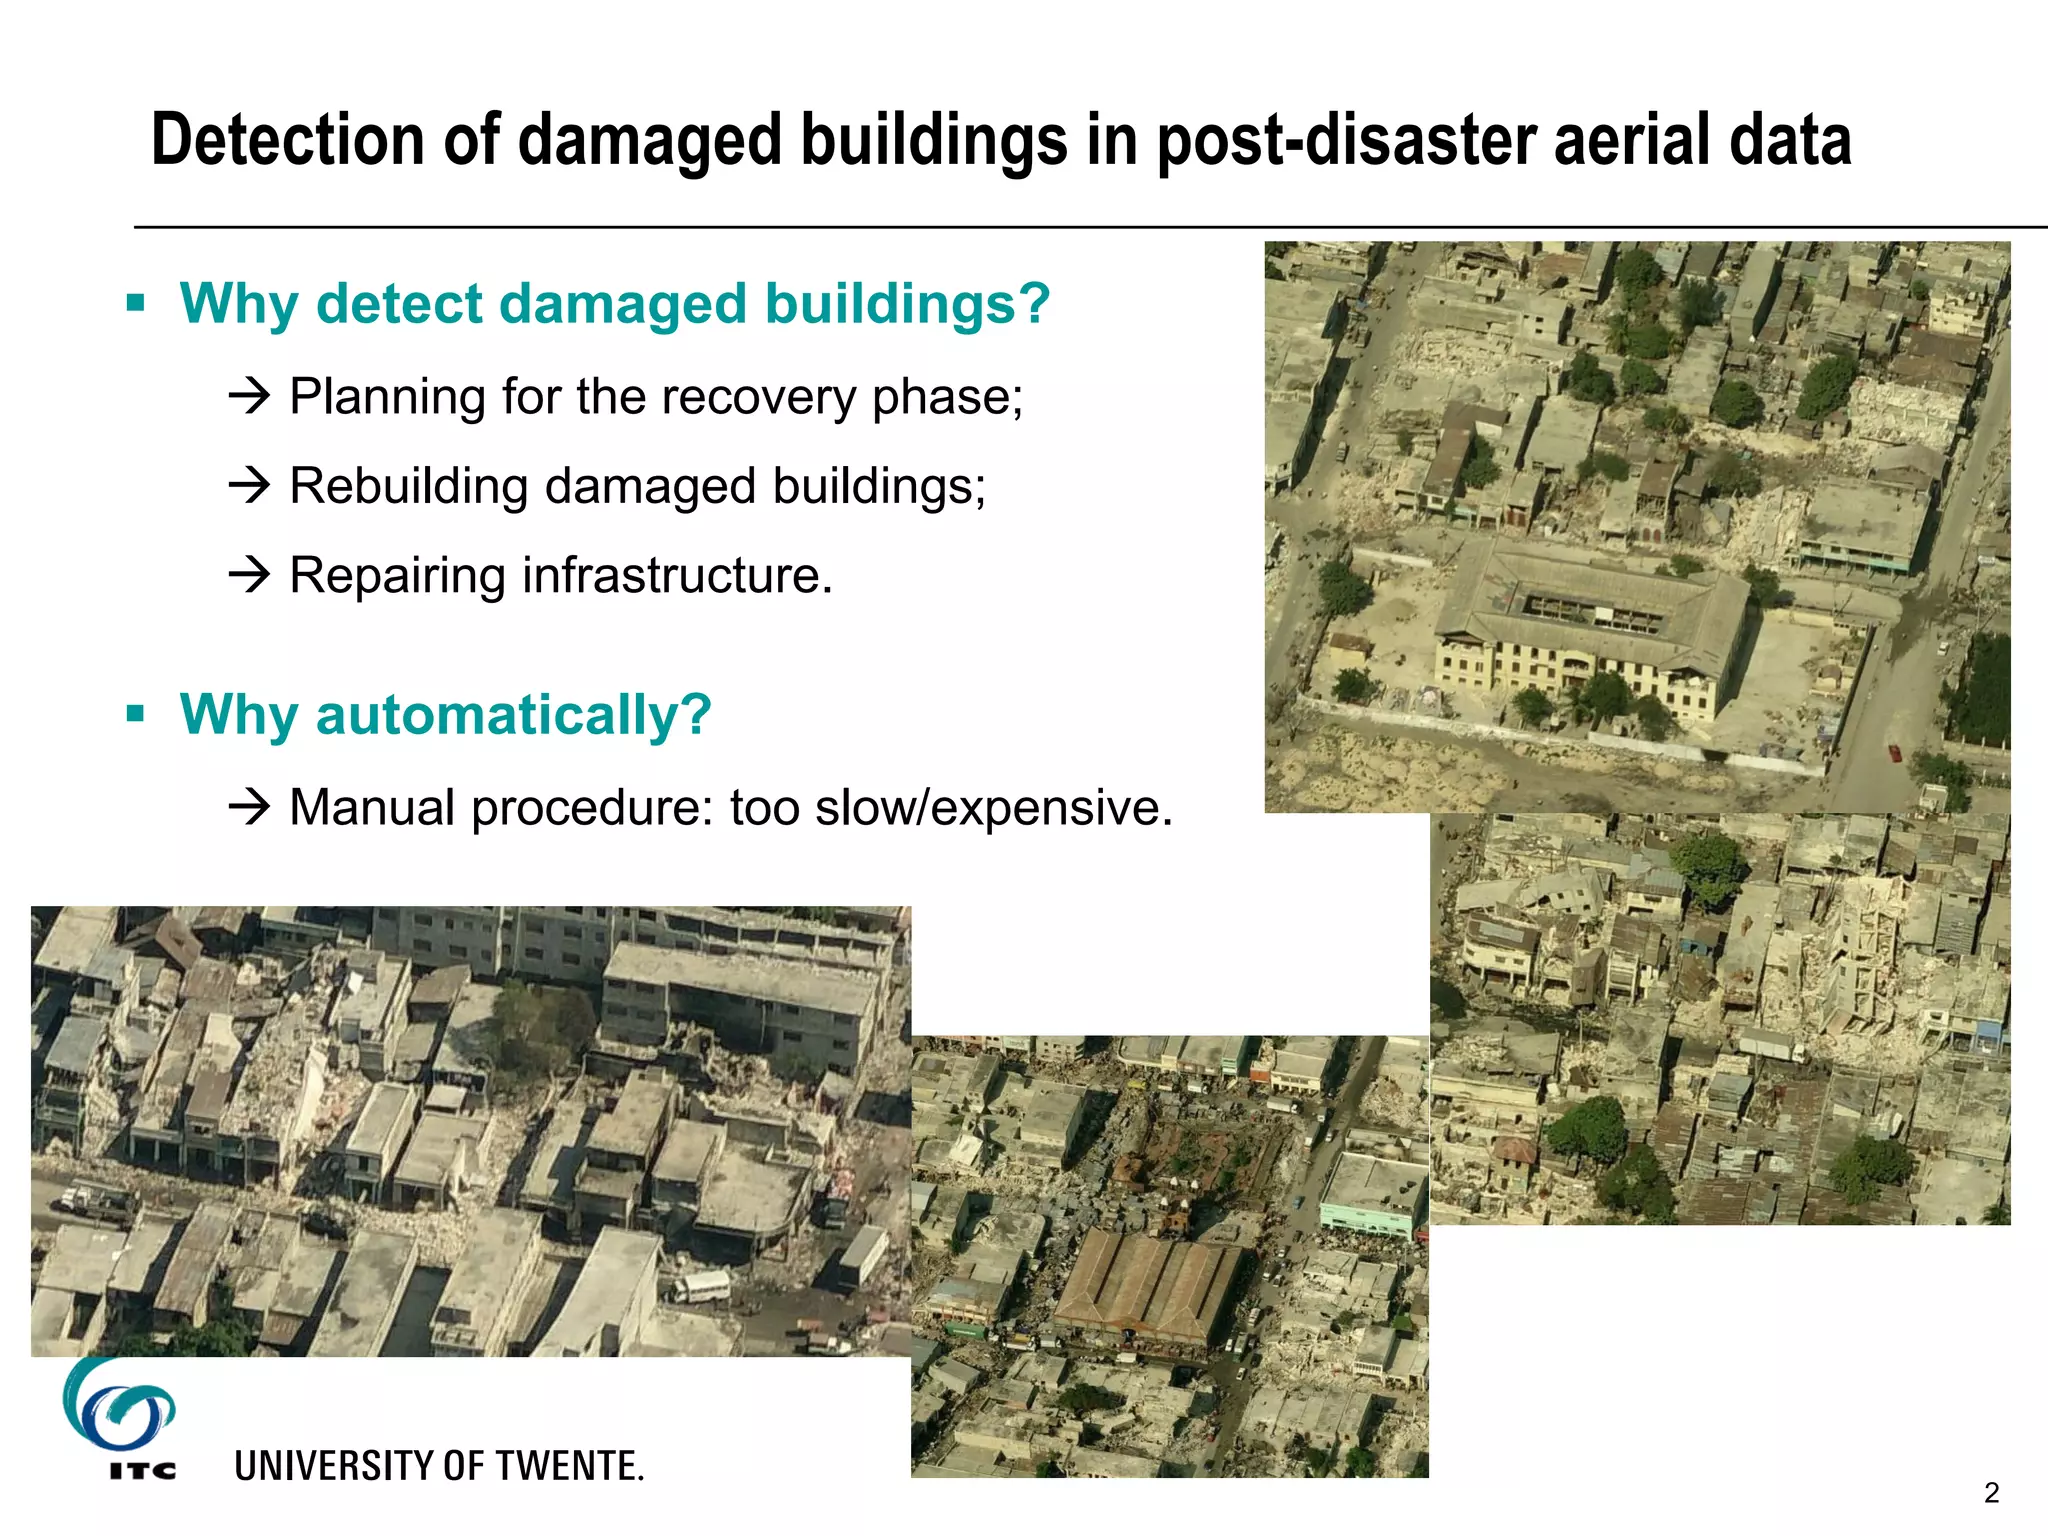


This document discusses using dimensionality reduction techniques like feature selection and principal component analysis to classify building roof segments in airborne laser scanning data as intact or damaged. It finds that dimensionality reduction improves classification accuracy, with linear classifiers outperforming more complex ones when training data is limited. Specifically, selecting the most relevant features like number of points and planarity measures per segment, and using the first few principal components achieves accurate classification of over 80% while avoiding overfitting with limited training samples.