Implementation of Radon Transformation for Electrical Impedance Tomography (E...
dissertation
1.
Recognition
and
classification
of
arm
movement
patterns
using
surface
electromyography
for
use
in
myoelectric
prosthesis.
DEN318
Khalil
Omar
Alassi
Abstract
In
this
report
different
feature
extraction
techniques
were
investigated
and
assessed.
This
was
done
in
order
to
see
what
features
would
lead
to
good
classification,
which
would
be
used
as
an
input
signal
for
myoelectric
prosthetic
arm.
The
hand
movements
carried
out
include,
hand
relaxed
horizontally
at
a
90
degree
angle
to
the
elbow,
hand
relaxed
vertically
down
forming
a
180
degree
angle
to
the
elbow,
hand
open
(with
all
fingers
separated
from
each
other),
hand
grasp,
hand
lateral
grasp
–
with
and
without
motion,
two-‐finger
pinch
(separate
two
fingers
in
one
EMG
signal),
wrist
flexion
and
wrist
extension.
The
raw
signals
were
then
de-‐noised
and
the
following
time-‐domain
feature
extraction
techniques
were
applied,
Zero
crossing,
mean
absolute
value,
Willison
amplitude
and
log
detector.
The
best
feature
obtained
was
the
zero
crossing
followed
by
Willison
amplitude.
The
mean
proved
ineffectual
and
should
not
be
used
for
classification.
2. 2
SCHOOL
OF
ENGINEERING
AND
MATERIALS
SCIENCE
ENGINEERING
THIRD
YEAR
PROJECT
DEN318
April
2015
DECLARATION
This
report
is
entitled
Recognition
and
classification
of
arm
movement
patterns
using
surface
electromyography
for
use
in
myoelectric
prosthesis.
Was
composed
by
me
and
is
based
on
my
own
work.
Where
the
work
of
others
has
been
used,
it
is
fully
acknowledged
in
the
text
and
in
captions
to
table
illustrations.
This
report
has
not
been
submitted
for
any
other
qualification.
Name
Khalil
Omar
Alassi
Signed
……………...…...
Date
…………………...
3. 3
Table
of
Contents
Abstract
.................................................................................................................................
1
List
of
Tables
.......................................................................................................................
4
List
of
Figures
......................................................................................................................
4
List
of
Graphs
......................................................................................................................
4
Introduction
........................................................................................................................
5
Methods
and
Results
........................................................................................................
8
Data
collection
.............................................................................................................................
8
Data
processing
........................................................................................................................
10
Feature
extraction
..................................................................................................................
12
Discrete
Wavelet
Transform
(DWT)
.................................................................................
12
Wavelet
Packet
Decomposition
(WPD)
...........................................................................
13
Decomposition
trees
..............................................................................................................
15
Mean
Absolute
Value
(MAV)
............................................................................................................
19
Willison
amplitude
(WAMP)
............................................................................................................
19
Zero
crossing
(ZC)
................................................................................................................................
20
Log
detector
(LD)
.................................................................................................................................
20
Comparison
of
each
Feature
extraction
technique
......................................................
20
Discussion
.........................................................................................................................
25
Conclusion
.........................................................................................................................
29
Acknowledgments
..........................................................................................................
29
References
........................................................................................................................
30
Appendix
...........................................................................................................................
33
4. 4
List
of
Tables
Table
1
Summary
of
the
advantages
and
disadvantages
of
the
support
vector
machine,
the
artificial
neural
network
and
fuzzy
logic
.............................................
7
Table
2
The
optimal
wavelet
component
and
function
for
the
surface
EMG
features,
with
RES
indices
[19]
........................................................................................
28
List
of
Figures
Figure
1
Processes
involved
in
EMG
extraction
and
Identification
[1]
.......................
6
Figure
2
A
64
electrode
system,
with
the
ground
electrode
inserted
into
the
upper
most
slot
..........................................................................................................................
9
Figure
3
The
different
hand
movements
labelled
corresponding
to
the
letters
previously
mentioned
..........................................................................................................
10
Figure
4
Three
level
decomposition
wavelet
packet
tree
..............................................
14
Figure
5
Level
3
decomposition
using
wavelet
packet
transform,
A
representing
approximation
coefficient
and
D
representing
Detail
coefficient
[15]
...........
14
Figure
6
db5
wavelet
functions
for
1
to
10
iterations
.....................................................
15
Figure
7
Raw
Emg
signal
...............................................................................................................
16
Figure
8
Level
1
Detail
...................................................................................................................
17
Figure
9
Level
2
detail
....................................................................................................................
17
Figure
10
Level
3
detail
.................................................................................................................
18
Figure
11
Level
3
approximation
..............................................................................................
18
List
of
Graphs
Graph
1
Hand
Grip
...........................................................................................................................
12
Graph
2
ZC
comparison
for
different
movements
.............................................................
21
Graph
3
Mean
comparison
for
the
different
movements
...............................................
22
Graph
4
MAV
comparison
for
different
movements
.........................................................
23
Graph
5
WAMP
comparison
for
different
movements
....................................................
24
Graph
6
LD
comparison
for
different
movements
.............................................................
25
Graph
7
Hand
Lateral
Grasp
........................................................................................................
33
Graph
8
Hand
Lateral
Grasp
with
Motion
.............................................................................
33
Graph
9
Hand
open
..........................................................................................................................
34
Graph
10
Hand
Rest
Horizontal
(90
degrees)
.....................................................................
34
Graph
11
Hand
Rest
Vertical
(180
degrees)
........................................................................
35
Graph
12
Two
Finger
Pinch
.........................................................................................................
35
Graph
13
Wrist
Extension
............................................................................................................
36
Graph
14
Wrist
Flexion
.................................................................................................................
36
5. 5
Introduction
Myoelectric
prosthesis
is
an
ever-‐expanding
field,
particularly
with
the
exponential
increase
in
technology
over
the
past
two
decades
[29].
Software
engineering
alongside
other
fields
have
opened
up
doors
for
prosthetics
to
progress
from
being
for
aesthetic
purposes
to
having
increased
functionality.
This
began
with
mechanical
movements
using
buttons
on
the
inside
of
the
prosthetic,
to
using
nerve
signals
to
operate
and
control
the
prosthetic,
which
is
where
current
research
is
being
undertaken,
in
order
to
improve
upon
current
systems
in
numerous
ways.
There
are
two
parts
to
myoelectric
prostheses.
The
first
is
the
physical
section.
This
is
the
robotic
prosthetic
itself,
with
all
the
motors,
actuators
and
mechanical
components
involved
in
it.
The
second
section
is
the
data
collection,
processing
and
classifying,
the
part
that
is
involved
in
understanding
the
signals
produced
and
carrying
out
the
correct
movement
corresponding
to
the
patients
will.
This
report
investigates
the
gathering
of
the
signals
and
the
pre
and
post
processing
of
the
EMG
signals
obtained
in
order
to
recognise
unique
signals
associated
with
each
arm
movement.
There
were
a
total
of
1.6
million
amputees
in
the
United
States
alone
in
2005.
This
includes
upper,
lower,
major
and
minor
amputations.
In
this
report,
the
arm
was
investigated.
Although
there
are
more
people
with
lower
limb
amputations
world
wide,
the
loss
of
functionality
is
greater
with
the
arm
than
the
leg,
and
as
it
currently
stands,
there
are
many
simple
devices
available
that
can
replace
the
lower
limbs,
with
similar
functionality
[3].
After
analysing
the
literature,
it
was
evident
that
there
were
no
papers
or
any
databases
on
EMG
signals.
This
would
allow
for
the
simple
selection
of
the
movements
the
manufacturer
or
user
want,
implement
it
onto
the
robotic
system,
to
be
simply
selected
from
certain
categories
depending
on
the
movements
that
the
user
wants
the
achieve.
However
to
do
that,
effective
features
have
to
be
identified
and
classified
in
the
correct
method.
The
aim
of
6. 6
this
report
is
to
identify
the
effective
features,
and
suggest
a
good
classification
method
to
be
used
in
order
to
get
the
final
result.
This
process
however
is
not
a
simple
one;
chains
of
events
have
to
occur
to
reach
the
final
stage.
These
are
seen
in
Figure
1.
EMG
sensors
are
used
to
record
nerve
signals
for
the
chosen
arm
movements,
these
are
then
processed
through
MATLAB
for
noise
reduction,
feature
extraction,
dimensional
reduction
and
classification,
which
finally
allows
for
that
movement
to
be
recognised
by
the
prosthetic
arm
when
an
action
potential
is
propagated.
Figure
1
Processes
involved
in
EMG
extraction
and
Identification
[1]
There
are
many
options
available
to
record
the
electrical
activity;
the
different
sensors
are
used
for
their
different
properties,
for
example,
there
are
dry
and
gelled
electrodes,
the
gelled
electrodes
are
favourable
due
to
the
reduction
of
impedance,
however
they
are
lighter
than
the
dry
electrode
that
causes
handling
difficulties.
Gelled
electrodes
weigh
in
the
region
of
20g
per
electrode
compared
to
the
1g
of
the
dry
electrode
[4].
There
are
different
methods
to
carry
out
EMG
feature
extraction;
the
main
techniques
are
split
into
three
categories,
time
domain,
frequency
domain
and
time-‐frequency
domain
(wavelet
transform).
These
can
be
carried
out
on
MATLAB,
a
high
performance
program
for
technical
computing
[2].
Each
was
further
discussed
and
investigated
in
the
literature
review.
There
are
also
many
classification
techniques
available,
the
main
three
being
support
vector
machine,
artificial
neural
network
and
fuzzy
logic.
These
were
investigated
within
the
literature
review,
and
advantages
and
disadvantages
of
each
were
discussed.
These
are
summarised
in
the
table
below:
7. 7
Table
1
Summary
of
the
advantages
and
disadvantages
of
the
support
vector
machine,
the
artificial
neural
network
and
fuzzy
logic
Advantages
Disadvantages
Support
Vector
Machine
-‐ Linearly
separable
-‐ Uses
Kernal
functions,
hence
it
gains
flexibility
in
form
of
the
set
threshold
-‐ Provide
a
good
out
of
sample
generalisation
-‐ Provides
a
unique
solution
-‐ Can
alter
what
factors
to
stress
on
most
in
comparison
to
others
[5]
-‐ Due
to
high
dimensions,
it
is
difficult
to
represent
results
as
simple
parametric
functions
[6]
-‐ “High
algorithmic
complexity
and
extensive
memory
requirement”
[7]
-‐ The
Kernel
function
parameters
selection
Artificial
Neural
Network
-‐ Deals
best
with
non-‐linear
dependence
between
the
inputs
and
outputs
-‐ Easy
to
conceptualise
-‐ Has
been
used
in
industry
for
so
many
years
-‐ High
tolerance
to
data
containing
noise
[8]
-‐ Requires
the
user
to
understand
parameters
involved
in
the
problem
-‐ Hard
to
train
and
require
lots
of
tuning
-‐ Black-‐box
modelling
[8]
8. 8
Fuzzy
Logic
-‐ Simple
and
insensitive
to
over
training
[11]
-‐ Contradictions,
as
may
be
the
case
in
EMG
signals
can
be
tolerated
-‐ Able
to
integrate
valuable
incomplete
knowledge
[12]
-‐ Works
at
a
fast
pace
-‐ Uses
descriptive
language
-‐ Relatively
new
field
in
EMG
[10]
Methods
and
Results
Data
collection
A
64-‐electrode
system
was
available,
as
shown
in
Figure
2.
Although
only
8
of
the
electrodes
were
used;
this
is
due
to
previous
studies
showing
that
8
electrodes
sufficiently
produce
results
comparable
to
that
of
12
and
more
electrodes
[30];
hence
this
reduces
the
costs
associated
with
the
processing
of
these
results.
Also,
handling
data
obtained
from
more
electrodes
would
overcomplicate
the
process
and
the
accuracy
would
not
be
significantly
higher.
9. 9
Figure
2
A
64
electrode
system,
with
the
ground
electrode
inserted
into
the
upper
most
slot
Electrodes
had
to
be
prepared
using
a
set
of
provided
equipment,
due
to
the
lack
of
washers
available.
To
prepare
the
electrodes,
holes
were
made
in
single
sided
tape.
The
electrodes
had
a
diameter
of
10mm
and
were
placed
in
pairs
20mm
apart.
The
single
sided
tape
was
reinforced
with
a
layer
of
double
sided
tape
to
allow
ease
of
handling.
They
were
then
adhered
onto
the
tape,
with
the
sensor
going
through
the
hole.
Silver/Silver
chloride
gel
was
then
applied
to
the
electrode
and
this
was
applied
onto
the
patient
in
the
required
positions.
These
were,
(a) Flexor
Carpi
Radialis
(b) Flexor
Carpi
Ulnaris
(c) Biceps
Brachii
(d) Triceps
Brachii
A
healthy
20-‐year-‐old
male
was
the
subject
of
this
experiment
and
was
prepared
using
the
SENIAM
guidelines,
which
involved
shaving
and
cleaning
the
skin
with
sterile
alcohol
swabs,
to
carry
out
the
following
daily
movements
for
EMG
signal
collection:
(a) Hand
relaxed
horizontally
at
a
90
degree
angle
to
the
elbow
(b) Hand
relaxed
vertically
down
forming
a
180
degree
angle
to
the
elbow
(c) Hand
open
(with
all
fingers
separated
from
each
other)
10. 10
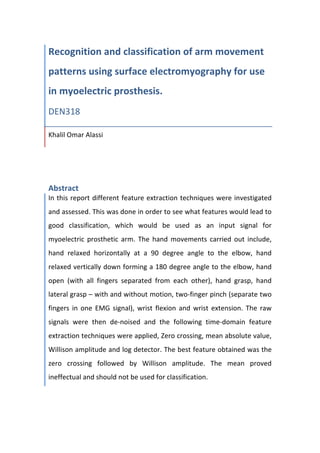
(d) Hand
grasp
(e) Hand
lateral
grasp
–
with
and
without
motion
(f) Two-‐finger
pinch
(separate
two
fingers
in
one
EMG
signal)
(g) Wrist
flexion
(h) Wrist
extension
The
movements
are
displayed
in
Figure
3.
Figure
3
The
different
hand
movements
labelled
corresponding
to
the
letters
previously
mentioned
The
signal
was
amplified
and
was
collected
at
the
rate
of
1000
samples
per
second.
This
was
processed
on
MATLAB.
Data
processing
The
results
obtained
were
in
a
.SO0
and
.SO1
format,
this
was
not
MATLAB
readable;
therefore
it
had
to
be
converted
in
preparation
for
use
with
MATLAB
to
a
.mat
extension.
This
was
done
by
running
the
results
in
MATLAB
using
the
following
code:
a
b
c
d
e
f
f
g
h
11. 11
for i=1:length(FileInd);
TM=tmsi_convert('F:dataD D.287', FileInd(i).name);
clear OriEMG
for c=1:8
yy=TM.data{c}(400:end);
OriEMG(:,c)=yy;
plot(yy+4800-c*600)
hold on
end
ylim([0 4800])
Time=(1:length(yy))/2048;
MatFile=regexprep([FileOutDir FileInd(i).name], '.S01', '.mat',
'ignorecase');
save(MatFile, 'OriEMG','Time');
end
The
raw
EMG
data
was
then
plotted
using
the
following
code:
Time=(1:length(OriEMG))/2048;
for i=1:8
plot(Time,OriEMG(:,i)+4800-i*600)
hold on
end
ylim([-600 4800])
xlabel('Time')
ylabel('Signal')
This
is
seen
in
Graphs
1
and
7-‐14
below
and
in
the
appendix.
The
scale
on
the
y-‐
axis
is
not
important
as
it
is
just
used
to
separate
out
the
8
channels.
The
channels
are
numbered
from
number
1
(the
highest
signal)
till
channel
8
(the
lowest
signal)
as
follows:
1. Flexor
Carpi
Radialis
2. Flexor
Carpi
Radialis
3. Biceps
Brachii
4. Biceps
Brachii
5. Triceps
Brachii
6. Triceps
Brachii
7. Flexor
Carpi
Ulnaris
8. Flexor
Carpi
Ulnaris
12. 12
Graph
1
Hand
Grip
Feature
extraction
Out
of
the
three
most
commonly
used
feature
extraction
techniques
available,
namely,
time-‐domain,
frequency-‐domain
and
wavelet
based
analysis;
wavelet
based
analysis
was
carried
out,
this
is
due
to
it
being
the
“most
powerful
signal
processing
tool”
available
[9].
However,
due
to
unforeseen
circumstances,
code
provided
by
Dr
Vepa
used
previously
for
a
similar
application
was
applied
to
the
set
of
results
above.
This
process
involved
decomposing
the
signal,
removing
the
noise
and
reconstructing
the
relevant
signals.
This
was
followed
by
the
application
of
the
relevant
time
domain
parameters
seen
in
the
sections
below.
Discrete
Wavelet
Transform
(DWT)
DWT
is
a
sub
band
coding
method
used
to
obtain
wavelet
transforms
at
high
computational
speeds.
Unlike
the
continuous
wavelet
transform
(CWT),
DWT
represents
the
data
using
time-‐scale
parameters
by
digital
filtering
techniques
rather
than
the
basic
functions
related
by
simple
scaling
and
translation.
DWT
was
chosen
for
this
study
due
to
the
concentration
in
real-‐time
engineering
applications
[21-‐23].
The
way
it
functions
is
as
follows
[16]
1. The
signal
is
processed
through
filters
with
different
band
frequencies
at
different
scales.
2. This
is
followed
by
a
decimation
operation
3. The
signal
separates
into
two
bands
13. 13
4. First
band,
the
low
pass
filter,
extracts
the
rough
information
of
the
signal
known
as
the
approximation
coefficients
5. Second
band,
the
high
pass
filter,
extracts
the
finer
information
of
the
signal
known
as
the
detail
coefficients
6. The
filtered
data
is
then
deconstructed
Wavelets
can
be
obtained
by
iterations
of
filters,
which
are
the
most
used
signal
processing
functions
[15].
The
computation
of
the
DWT
through
both
low
and
high
pass
filters
can
be
represented
by
a
Mallat
algorithm
or
Mallat-‐tree
decomposition
[15].
After
the
signal
is
split
into
different
levels,
the
half
band
filters
generate
signals
that
cover
half
the
frequency
band.
Hence,
the
frequency
resolution
is
doubled.
Following
Nyquist’s
rule,
if
the
highest
frequency
of
the
original
signal
of
𝛼,
with
a
sampling
frequency
of
2 𝛼
radians,
hence,
the
highest
frequency
is
𝛼/2,
thus
it
can
be
sampled
at
a
frequency
of
𝛼
radians,
which
removes
half
the
samples
while
preserving
all
the
important
information
[15].
This
processes
is
repeated
until
the
required
level
is
achieved.
The
length
of
the
signal
is
the
factor
that
determines
the
maximum
number
of
levels.
Wavelet
Packet
Decomposition
(WPD)
The
concept
of
WPD
is
that
it
transforms
a
signal
from
the
time
to
frequency
domain
every
level
at
a
time.
As
previously
mentioned,
from
wavelet
analysis,
two
coefficients
are
obtained,
namely,
the
approximation
and
detail
coefficients.
The
main
difference
between
WT
and
wavelet
packet
transform
(WPT)
is
that
for
WPT
both
coefficients
can
further
stem
into
approximation
and
detail
coefficients
rather
than
just
the
approximation
further
stemming.
This
process
is
iterated
throughout
the
levels,
in
this
report,
this
is
carried
out
over
three
levels
and
can
be
represented
by
Figure
4
numerical
and
Figure
5
qualitatively.
Due
to
both
coefficients
being
iterated,
a
complete
tree
basis
result
is
achieved.
What
the
tree
shows,
is
an
increase
in
the
exchange
between
the
time
and
frequency
resolutions.
The
highest
level
being
time
representative
in
comparison
to
the
bottom,
which
is
frequency
representative
[15].
14. 14
Figure
4
Three
level
decomposition
wavelet
packet
tree
Figure
5
Level
3
decomposition
using
wavelet
packet
transform,
A
representing
approximation
coefficient
and
D
representing
Detail
coefficient
[15]
Due
to
the
nature
of
WPT
using
an
entropy-‐based
criterion
to
choose
a
suitable
decomposition
signal,
each
node
has
to
be
quantified
at
each
split.
There
are
several
wavelet
families
that
are
important;
these
are,
in
no
particular
order,
Haar,
Daubechies,
Symlets,
Coiflets,
and
biorthogonal
[15].
In
this
paper
Daubechies
family
with
db5
wavelet
function
was
investigated.
This
is
displayed
in
Figure
6.
15. 15
Figure
6
db5
wavelet
functions
for
1
to
10
iterations
Decomposition
trees
The
decomposition
tree
in
Figure
4
is
an
effective
visualisation
method
of
the
different
filtering
that
has
been
applied
to
the
raw
EMG
signal
the
results
are
seen
in
Figures
7-‐11.
Moving
down
the
tree
from
the
top,
(0,0),
the
frequency
is
divided
into
smaller
sections.
There
are
two
types
of
filtering
represented
in
the
tree,
a
low
pass
filtering
operation
that
is
achieved
every
time
the
line
stems
down
and
to
the
left,
and
a
high
pass
filtering
operation
that
is
achieved
every
time
the
line
stems
down
and
to
the
right.
There
are
nodes
that
have
no
more
nodes
stemming
down
from
them,
these
are
called
terminal
nodes,
but
can
also
be
known
as,
leaves
or
sub
bands.
All
other
nodes
are
known
as
non-‐terminal
or
internal
nodes.
This
simple
mechanism
allows
for
a
simple
understanding
of
the
tree
decomposition
diagram
[15].
For
the
nodes
( 𝑗, 𝑘),
𝑗
represents
the
depth
within
the
tree
and
𝑘
refers
to
the
position.
Beginning
with
node
(0,0),
the
raw
EMG
signal,
if
it
is
low
pass
filtered,
the
node
(1,0)
is
achieved.
If
node
(0,0)
were
to
be
high
pass
filtered,
the
node
(1,1)
is
obtained.
Gokhale
et
al.
defines
this
by
stating
“these
filtering
operations
are
equivalent
to
finding
the
correlation
of
the
signal
with
the
scaling
function
for
node
(1,0)
and
the
correlation
of
the
signal
with
the
wavelet
function
for
node
(1,1)”
[15].
Dropping
down
a
level
to
(2,1)
and
(2,0)
from
(1,0),
the
samples
at
(1,0)
have
been
re-‐filtered
according
to
the
previous
principles.
Critical
16. 16
sampling
is
achieved,
which
is
due
to
the
sampling
of
the
coefficients
at
(1,0).
This
is
known
as
multi-‐resolution
[15].
Figure
7
Raw
Emg
signal
19. 19
From
the
wavelet
decomposition
coefficients,
the
signals
can
be
reconstructed
with
minimal
noise.
The
features
can
then
be
extracted
from
this
de-‐noised
signal.
This
has
proven
to
provide
better
performance
than
the
raw
signals
[17].
The
following
feature
extraction
techniques
were
applied:
Mean
Absolute
Value
(MAV)
MAV,
also
known
as
Integral
of
Absolute
Value
(IAV),
is
a
commonly
investigated
feature
for
surface
EMG
analysis
[14].
The
MAV
was
chosen
as
one
of
the
time-‐
domain
feature
extraction
techniques
rather
than
the
root
mean
square
(RMS)
because
research
has
shown
that
both
methods
display
similar
results,
however,
MAV
feature
is
better
in
terms
of
class
separability
[13].
It
is
calculated
using
the
following
equation
𝑀𝐴𝑉 =
1
𝑁
𝑥!
!!!
!!!
N
=
length
of
the
segment
𝑥! =
𝑖!!
sample
Willison
amplitude
(WAMP)
WAMP
assesses
the
number
of
times
there
is
a
change
in
the
EMG
signal
amplitude
that
exceeds
an
instated
threshold
value.
WAMP
investigates
muscle
contraction
levels
by
acting
as
an
indicator
of
firing
of
MUAP
[14].
It
is
calculated
using
the
following
equation
𝑊𝐴𝑀 = 𝑊 𝑥! − 𝑥!!!
!!!
!!!
𝑊 𝑥 =
1
0
𝑖𝑓 𝑥 > 𝑡ℎ𝑟𝑒𝑠ℎ𝑜𝑙𝑑
𝑜𝑡ℎ𝑒𝑟𝑤𝑖𝑠𝑒
The
threshold
value
=
10mV
20. 20
Zero
crossing
(ZC)
ZC
is
a
simple
but
useful
technique,
it
counts
the
number
of
times
the
signal
crosses
the
zero
amplitude
axis.
It
is
calculated
using
the
following
equation
𝑍𝐶 = 𝑠𝑔𝑛 −𝑥! 𝑥!!!
!!!
!!!
Where,
𝑠𝑔𝑛 𝑥 =
1
0
𝑖𝑓 𝑥 > 0
𝑜𝑡ℎ𝑒𝑟𝑤𝑖𝑠𝑒
Log
detector
(LD)
Similar
to
WAMP,
the
information
gained
through
this
method
is
related
to
construct
force;
this
is
calculated
using
the
following
equation
[14]
𝐿𝐷 = 𝑒
!
!
!"# !!
!!!
!!!
Comparison
of
each
Feature
extraction
technique
Graphs
2-‐6
show
scatter
diagrams
of
all
the
different
features
extracted
using
the
previously
mentioned
methods.
The
x-‐axis
represents
the
different
channels
of
which
data
was
collected;
the
y-‐axis
is
the
extracted
feature.
The
key
is
as
follows:
21. 21
Graph
2
ZC
comparison
for
different
movements
Graph
2
above
shows
that
there
is
a
clear
pattern
with
most
of
the
hand
movements
that
make
them
distinct
in
comparison
to
others.
The
only
two
movements
that
seem
to
overlap
other
zero
crossing
values
of
other
movements
are
the
wrist
flexion
and
extension.
500
700
900
1100
1300
1500
1700
0
1
2
3
4
5
6
7
8
9
Zero
crossings
Channel
22. 22
Graph
3
Mean
comparison
for
the
different
movements
The
mean
has
shown
no
real
significance,
as
no
pattern
was
associated
with
the
features
obtained.
There
are
many
features
that
overlap
between
movements,
they
seem
heavily
clustered
around
the
third
to
the
sixth
electrodes,
which
correspond
to
the
biceps
and
triceps
brachii.
All
the
values
vary
between
2
and
-‐
2.5;
this
supports
the
argument
that
no
real
classification
can
be
carried
out
effectively
using
this
feature
extraction
technique.
This
is
further
discussed
in
the
discussion
section
below.
-‐3
-‐2.5
-‐2
-‐1.5
-‐1
-‐0.5
0
0.5
1
1.5
2
2.5
0
1
2
3
4
5
6
7
8
9
Mean
Channel
23. 23
Graph
4
MAV
comparison
for
different
movements
This
feature
does
produce
patterns
for
some
movements
although
not
all,
due
to
the
overlapping
and
clustering
of
the
features
between
the
different
movements.
The
MAV
produces
features
that
are
more
viable
than
the
Mean
features;
this
is
an
important
factor
to
consider
if
these
were
to
later
be
used
in
classification.
Movements
such
as
hand
open
and
hand
rest
overlap
in
more
than
one
channel.
0
20
40
60
80
100
120
140
160
180
0
1
2
3
4
5
6
7
8
9
MAV
Channel
24. 24
Graph
5
WAMP
comparison
for
different
movements
WAMP
provided
useful
results,
however,
there
appears
to
be
some
clustered
results
in
both
the
biceps
and
triceps
brachii,
and
this
could
be
due
to
many
reasons
that
are
discussed
in
the
discussion.
0
5
10
15
20
25
30
0
1
2
3
4
5
6
7
8
9
WAMP
Channel
25. 25
Graph
6
LD
comparison
for
different
movements
LD
proved
valuable
for
movements
that
required
as
little
force
as
possible,
as
a
clear
pattern
can
be
identified
with
‘Hand
rest
vertical’
and
the
‘Hand
rest’
movements.
The
‘Two
finger
pinch’
provided
the
highest
LD
values
followed
by
the
‘Hand
lateral
grasp’.
There
is
a
good
separability
excluding
the
two-‐finger
pinch
movement.
Discussion
In
this
report,
EMG
signals
were
recorded
from
different
muscles
carrying
out
different
movements,
all
of
which
are
described
in
previous
sections.
They
were
subjected
to
db5
Daubechies
wavelet
function
shown
in
Figure
6.
It
is
proven
that
for
most
types
of
natural
signals,
the
important
sections
of
the
signal
are
the
low
frequency
components;
hence
everything
not
seen
in
the
figures
above
can
be
assumed
as
noise
[24].
From
Figures
7-‐11
it
is
observed
that
the
low
frequency
sections
have
indirect
correspondence
and
have
non-‐essential
background
noise,
whereas
the
first
and
second
decomposition
levels
are
similar
5.50E+03
1.05E+04
1.55E+04
2.05E+04
2.55E+04
3.05E+04
3.55E+04
0
1
2
3
4
5
6
7
8
9
LD
Channel
26. 26
to
that
of
the
original
EMG
signal.
This
complies
with
the
trend
that
being
removing
the
unwanted
high
frequencies
(fluctuations)
and
preserving
the
lower
frequency
components,
meaning
the
important
information
is
presented
[25].
The
results
for
the
other
channels
were
not
displayed
due
to
the
limited
space,
however
they
were
found
to
follow
a
similar
trend.
Graphs
2-‐6
show
the
comparison
of
features
obtained
for
the
four
different
feature
extraction
methods.
Each
of
the
four
previously
mentioned
muscles
was
investigated
for
all
the
different
hand
movements.
They
were
plotted
on
scatter
diagrams
in
order
to
identify
variations
in
the
signal.
Whilst
investigating
these
features,
a
few
points
have
to
be
remembered.
A
high
quality
feature
has
to
have
three
properties
1. Maximum
class
separability
2. Robustness
3. Complexity
The
first
point
refers
to
the
features
having
very
little
overlapping
in
order
to
identify
and
recognise
the
input
signals.
The
second
point
refers
to
the
features
being
able
to
maintain
the
separability
in
noisy
environments.
Finally,
the
features
computational
complexity
should
be
as
low
as
possible
in
order
to
implement
the
same
procedure
using
mediocre
hardware
and
in
real-‐time
[27].
The
zero
crossing
features
from
Graph
2
show
clear
separation.
This
means
that
the
EMG
feature
vector
produced
by
this
feature
extraction
technique
will
yield
good
classification
results
in
the
classification
stage.
This
conforms
with
the
research
done
by
Curtis
and
Oppenheim
that
state
a
“two-‐dimensional,
periodic,
band-‐limited
signal
is
uniquely
specified
to
within
a
scale
factor
by
its
zero
crossings
if
the
signal
is
non-‐factorable
when
expressed
as
a
polynomial”,
however,
not
only
that
but
it
can
also
be
applied
when
the
signal
is
of
finite
length
and
when
crossing
an
arbitrary
threshold,
in
this
case,
factorable
signals
would
still
produce
good
classification
results
[18].
Thus,
this
is
a
good
feature
extraction
technique
that
produces
unique
results
for
every
movement
by
the
different
muscles,
which
makes
it
replicable.
27. 27
The
Mean
features
produce
some
separable
results,
although
there
are
a
few
overlaps.
The
range
is
small;
hence
they
are
compact
in
one
section.
This
would
make
it
difficult
to
simply
identify
the
different
movements,
as
a
small
fluctuation
in
the
signals
would
lead
to
noticeable
alterations,
which
may
lead
to
further
overlapping.
Classification
using
this
feature
would
not
lead
to
ideal
results,
as
the
results
are
not
significantly
different,
the
clustering
of
results
is
seen
clearly
between
channels
four
to
eight.
The
disregard
of
this
technique
by
many
research
papers
[16-‐20]
and
more
is
enough
to
justify
why
it
is
a
bad
method.
Rather,
the
MAV
is
used,
which
produces
unique
separable
results
at
low
level
reconstructed
signals,
particularly
for
‘Hand
lateral
grasp
and
wrist
flexion’.
However,
MAV
obtained
from
the
high-‐level
reconstructed
signal
present
poor
separability.
Studies
have
shown
this
to
be
the
trend
in
other
studies
[19].
Willison
Amplitude
provides
excellent
features
for
classification,
as
the
majority
of
the
results
are
separable.
This
trend
of
results
is
not
only
witnessed
in
this
study,
but
also
in
other
studies
by
Phinyomark
et
al.,
[9,19,26].
The
final
feature
that
also
proved
to
give
a
pattern
when
produced
on
a
scatter
diagram
is
the
Log
detector.
Visually
it
is
noticed
that
the
results
are
separated,
thus
they
can
be
classified
well
enough
for
the
signal
to
be
replicated.
In
order
to
quantify
the
suitability
of
the
features,
two
different
methods
could
be
applied.
Namely,
using
classification
to
obtain
an
estimate
of
the
misclassification
rate,
or
using
certain
separability
measures.
The
recommended
approach
would
be
the
use
of
Davies-‐Bouldin
Cluster
Separation
Measure,
which
directly
solves
the
problem
of
class
separability
[27].
This
can
be
done
in
the
future
in
order
to
expand
on
current
work.
Investigating
the
wavelet
functions,
research
carried
out
Phinyomark
et
al
[19],
shows
that
the
optimal
wavelet
function
used
is
db7
rather
than
the
db5
used
in
this
study
and
the
optimal
wavelet
component
is
D2,
which
refers
to
the
second
level
detail
node.
Although
a
higher
wavelet
function
does
yield
better
results,
this
has
to
be
compromised
with
computational
complexity
in
order
to
have
the
28. 28
highest
quality
feature
[28].
The
two
highest
RES
index
values
from
the
experimented
features
were
zero
crossing
and
Willison
amplitude,
both
that
proved
excellent
in
this
study.
Table
2
The
optimal
wavelet
component
and
function
for
the
surface
EMG
features,
with
RES
indices
[19]
From
the
raw
EMG
signals,
it
can
be
seen
that
there
is
a
lot
of
noise.
This
noise
was
due
to
the
electrical
appliances
found
around
the
electrodes
and
amplifier.
The
lab
used
had
a
number
of
sockets,
computers
and
other
biomechanical
testing
equipment,
which
all
emit
signals.
An
attempt
to
reduce
the
effect
of
noise
was
to
carry
out
in
the
corner
of
the
room
with
least
appliances.
To
further
improve
upon
this
experiment.
Ideally,
to
reduce
this
ambient
noise
a
small
room
with
no
electrical
equipment
should
be
used.
29. 29
Finally,
due
to
unaccounted
problems,
the
lab
time
was
delayed;
hence
the
classification
of
the
signals
using
the
features
obtained
was
not
carried
out.
However,
a
plan
was
made
to
use
a
combination
of
both
support
vector
machine
and
artificial
neural
network
to
complete
this
task.
This
would
of
yielded
the
final
set
of
presentable
results.
This
could
be
done
in
the
future
to
finalise
the
project.
To
further
improve
upon
this
study,
using
a
larger
number
of
subjects
to
obtain
signals
would
give
a
better
overview,
and
quantifying
the
separability
of
the
features
to
find
its
statistical
significance.
Conclusion
In
this
study,
a
healthy
male
subject
was
used
to
carry
out
the
following
movements,
Hand
relaxed
horizontally
at
a
90
degree
angle
to
the
elbow,
Hand
relaxed
vertically
down
forming
a
180
degree
angle
to
the
elbow,
Hand
open
(with
all
fingers
separated
from
each
other),
Hand
grasp,
Hand
lateral
grasp
–
with
and
without
motion,
Two-‐finger
pinch
(separate
two
fingers
in
one
EMG
signal),
Wrist
flexion,
Wrist
extension.
The
raw
EMG
data
was
then
deconstructed,
noise
was
removed
using
discrete
wavelet
transform,
and
the
signals
were
reconstructed.
Thereafter,
the
feature
extraction
processes
took
place
using
time-‐domain
features.
These
include,
MAV,
WAMP,
LD
and
ZC.
The
mean
was
also
measured
although
this
was
found
to
produce
insignificant
data.
The
best
feature
was
found
to
be
zero
crossing
followed
by
Willison
amplitude
and
Log
detector.
For
future
work,
quantifying
the
separability
would
be
the
next
step
using
Davies-‐Bouldin
cluster
separation
measure
and
finally
classifying
the
results
using
a
combination
of
SVM
and
ANN.
Acknowledgments
This
project
has
required
a
lot
of
time
and
effort;
it
would
have
been
a
very
difficult
journey
without
the
support
of
my
supervisor,
friends
and
family
and
to
all
who
contributed.
I
am
highly
thankful
to
Dr
Ranjan
Vepa
for
his
supervision
and
guidance
throughout
the
project,
while
providing
insightful
information
to
help
me
excel
in
the
field,
his
continuous
support
helped
me
complete
the
project
with
a
high
level
of
understanding.
I
would
also
like
to
take
this
opportunity
to
31. 31
Computer,
Telecommunica-‐tions
and
Information
Technolo,
1(1),
pp.856
-‐
460.
14. Zardoshti-‐Kermani,
M.,
Wheeler,
B.,
Badie,
K.
and
Hashemi,
R.
(1995).
EMG
feature
evaluation
for
movement
control
of
upper
extremity
prostheses.
IEEE
Trans.
Rehab.
Eng.,
3(4),
pp.324-‐333.
15. Gokhale,
M.
and
Khanduja,
D.
(2010).
Time
Domain
Signal
Analysis
Using
Wavelet
Packet
Decomposition
Approach.
International
Journal
of
Communications,
Network
and
System
Sciences,
03(03),
pp.321-‐329.
16. Hibare,
R.
and
Vibhute,
A.
(2014).
Feature
Extraction
Techniques
in
Speech
Processing:
A
Survey.
International
Journal
of
Computer
Applications,
0975(8887),
pp.1
-‐
8.
17. A.
Phinyomark.
S.
Hirunviriya.
C.
Limsakul.
P.
Phukpattaranont
In
Evaluation
of
EMG
feature
extraction
for
hand
movement
recognition
based
on
Euclidean
distance
and
standard
deviation,
Electrical
Engineering/Electronics
Computer
Telecommunications
and
Information
Technology
(ECTI-‐CON),
2010
International
Conference
on,
IEEE:
2010;
pp.
856-‐860.
18. Curtis,
S.
and
Oppenheim,
A.
(1987).
Reconstruction
of
multidimensional
signals
from
zero
crossings.
J.
Opt.
Soc.
Am.
A,
4(1),
p.221.
19. Phinyomark,
A.,
Nuidod,
A.,
Phukpattaranont,
P.
and
Limsakul,
C.
(2012).
Feature
Extraction
and
Reduction
of
Wavelet
Transform
Coefficients
for
EMG
Pattern
Classification.
Electronics
and
Electrical
Engineering,
122(6).
20. Hamedi,
M.,
Salleh,
S.,
Noor,
A.,
Swee,
T.
and
Aflzam,
I.
(2012).
Comparison
of
Different
Time-‐domain
Feature
Extraction
Methods
on
Facial
Gestures’
EMGs.
Progress
in
Electromagnetics
Research
Symposium
Proceedings,
pp.1897
-‐
1900.
21. Boisset,
S.
and
Goubel,
F.
(1972).
Integrated
electromyography
activity
and
muscle
work.
Journal
of
applied
Physiol,
35,
pp.695
-‐
702.
22. Canal,
M.
(2008).
Comparison
of
Wavelet
and
Short
Time
Fourier
Transform
Methods
in
the
Analysis
of
EMG
Signals.
J
Med
Syst,
34(1),
pp.91-‐94.
23. Asghari
Oskoei,
M.
and
Hu,
H.
(2007).
Myoelectric
control
systems—A
survey.
Biomedical
Signal
Processing
and
Control,
2(4),
pp.275-‐294.
24. Misiti,
M.,
Misiti,
Y.,
Oppenheim,
G.
and
Poggi,
J.
(2015).
Wavelet
Toolbox
For
Use
with
MATLAB.
The
MathWorks.
Retrieved
April
7th
2015
from
http://in.mathworks.com/help/pdf_doc/wavelet/wavelet_ug.pdf
25. Sharma,
S.
and
Kumar,
G.
(2012).
Wavelet
analysis
based
feature
extraction
for
pattern
classification
from
Single
channel
acquired
EMG
signal.
Elixer
Control
Engineering,
50,
pp.10320
-‐
10324.
26. Phinyomark,
A.,
Limsakul,
C.
and
Phukpattaranont,
P.
(2008).
EMG
feature
extraction
for
tolerance
of
white
Gaussian
noise.
International
workshop
and
symposium
on
science
and
technology,
pp.178
-‐
183.
27. Zardoshti-‐Kermani,
M.,
Wheeler,
B.,
Badie,
K.
and
Hashemi,
R.
(1995).
EMG
feature
evaluation
for
movement
control
of
upper
extremity
prostheses.
IEEE
Trans.
Rehab.
Eng.,
3(4),
pp.324-‐333.
28. Goel,
P.,
Rai,
S.,
Chandra,
M.
and
Gupta,
V.
(2013).
Analysis
of
LMS
Algorithm
in
Wavelet
Domain.
Atlantis
press,
pp.734
-‐
738.