Presentación Exploración del III, IV y VI par craneal.
Stat3355_Homework 4
1. KayleighDonnelly
12/03/14
Stat3355
Homework 4
1a. We reject the null hypothesis that there is no difference between the mean wear amounts
of the materials with a p-value of 0.0085, which is less that α=.01. Therefore, there is sufficient
evidence to conclude that there is a difference between the mean wear amounts of the materials.
1b. We are 99% confident that the mean difference in wear amounts for the two materials lies
between 0.0121 and 0.8079.
1c. The sample size needed to estimate the mean difference in wear amounts to within 0.20
with 99% confidence is 25.
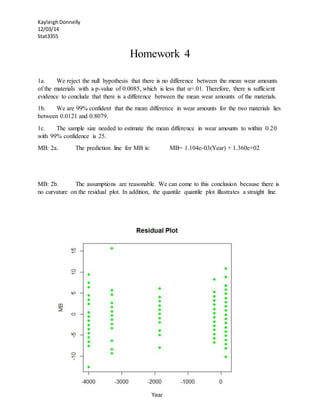
MB: 2a. The prediction line for MB is: MB= 1.104e-03(Year) + 1.360e+02
MB: 2b. The assumptions are reasonable. We can come to this conclusion because there is
no curvature on the residual plot. In addition, the quantile quantile plot illustrates a straight line.
2. KayleighDonnelly
12/03/14
Stat3355
MB: 2c,d. We reject that the null hypothesis that the slope=0, with a p-value of 2.903e-06,
which is less than α=.05. Therefore, there is sufficient evidence to conclude that MB depends on
the year, and the slope differs from 0.
MB: 2e. We are 95% confident that the MB measurement of an individual from this region
for the year 2000 lies between 129.0145 and 147.4076.
BH: 2a. The prediction line for BH is: BH= -5.444e-04 (Year) + 1.315e+02
3. KayleighDonnelly
12/03/14
Stat3355
BH: 2b. The assumptions are reasonable. We can come to this conclusion because there is
no curvature on the residual plot. In addition, the quantile quantile plot illustrates a straight line.
4. KayleighDonnelly
12/03/14
Stat3355
BH: 2c,d. We reject that the null hypothesis that the slope=0, with a p-value of 0.0264,
which is less than α=.05. Therefore, there is sufficient evidence to conclude that BH depends on
the year, and the slope differs from 0.
BH: 2e. We are 95% confident that the BH measurement of an individual from this region
for the year 2000 lies between 120.619 and 140.293.
BL: 2a. The prediction line for BL is: BL= -0.00139 (Year) + 93.901
BL: 2b. The assumptions are reasonable. We can come to this conclusion because there is
no curvature on the residual plot. In addition, the quantile quantile plot illustrates a straight line.
6. KayleighDonnelly
12/03/14
Stat3355
BL: 2c,d. We reject that the null hypothesis that the slope=0, with a p-value of 5.727e-08,
which is less than α=.05. Therefore, there is sufficient evidence to conclude that BL depends on
the year, and the slope differs from 0.
BL: 2e. We are 95% confident that the BL measurement of an individual from this region
for the year 2000 lies between 81.264 and 100.977.
NH: 2a. The prediction line for BL is: BL= 3.307e-04 (Year) + 5.154e+01
NH: 2b. The assumptions are reasonable. We can come to this conclusion because there is
no curvature on the residual plot. In addition, the quantile quantile plot illustrates a straight line.
8. KayleighDonnelly
12/03/14
Stat3355
NH: 2c,d. We reject that the null hypothesis that the slope=0, with a p-value of 0.0380,
which is less than α=.05. Therefore, there is sufficient evidence to conclude that NH depends on
the year, and the slope differs from 0.
NH: 2e. We are 95% confident that the NH measurement of an individual from this region
for the year 2000 lies between 45.801 and 58.606.
9. KayleighDonnelly
12/03/14
Stat3355
3a.
3b. We reject the null hypothesis that there is no difference among the means of tconc within
each level of SQ with a p-value of 6.04e-12, which is less that α=.05. Therefore, there is
sufficient evidence to conclude that there are differences among the means of tconc within each
level of SQ.
3c. We are 95% confident that the differences between SQ=1 and SQ=2 lies between -
1346.919 and -597.526.
We are 95% confident that the differences between SQ=1 and SQ=3 lies between 386.132 and
1011.868.
10. KayleighDonnelly
12/03/14
Stat3355
We are 95% confident that the differences between SQ=1 and SQ=4 lies between 97.000 and
728.555.
We are 95% confident that the differences between SQ=2 and SQ=3 lies between 1346.375 and
1996.069.
We are 95% confident that the differences between SQ=2 and SQ=4 lies between 1057.418 and
1712.582.
We are 95% confident that the differences between SQ=3 and SQ=4 lies between -530.011 and
-42.434.