
Recommended
More Related Content
Recently uploaded
Recently uploaded (20)
Featured
Featured (20)
2018 09-21 portfolio performance
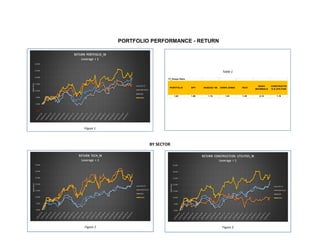
- 1. PORTFOLIO PERFORMANCE - RETURN BY SECTOR Figure 1 Table 1 1Y_Shape Ratio PORTFOLIO SPY NASDAQ 100 DOWN JONES TECH BASIC MATERIALS CONSTRUCTIO N & UTILITIES 1.62 1.59 1.74 1.61 1.39 0.15 1.18 Figure 2 Figure 3
- 2. Figure 4
- 3. PORTFOLIO PERFORMANCE - VAR BY SECTOR Figure 5 Figure 6 Table 3 1Y - 1 Day - 5% VaR - CORRELATION PORTFOLIO SPY NASDAQ 100 DOWN JONES PORTFOLIO 1 0.57 0.52 0.44 SPY 0.57 1 0.99 0.93 NASDAQ 100 0.52 0.99 1 0.91 DOWN JONES 0.44 0.93 0.91 1 Table 2 1Y - 1 Day - 5% VaR - CORRELATION PORTFOLIO SPY NASDAQ 100 DOWN JONES PORTFOLIO 1 0.90 0.85 0.87 SPY 0.90 1 0.98 0.92 NASDAQ 100 0.85 0.98 1 0.91 DOWN JONES 0.87 0.92 0.91 1
- 4. Figure 7 Table 4 1Y - 1 Day - 5% VaR - CORRELATION PORTFOLIO SPY NASDAQ 100 DOWN JONES PORTFOLIO 1 0.73 0.69 1 SPY 0.73 1 0.99 0.93 NASDAQ 100 0.69 0.99 1 0.91 DOWN JONES 0.56 0.93 0.91 1 Figure 8 Table 5 1Y - 1 Day - 5% VaR - CORRELATION PORTFOLIO SPY NASDAQ 100 DOWN JONES PORTFOLIO 1 0.83 0.80 0.79 SPY 0.83 1 0.99 0.93 NASDAQ 100 0.80 0.99 1 0.91 DOWN JONES 0.79 0.93 0.91 1
- 5. Figure 9 Table 6 1Y - 1 Day - 5% VaR - CORRELATION PORTFOLIO SPY NASDAQ 100 DOWN JONES PORTFOLIO 1 0.97 0.97 0.95 SPY 0.97 1 1.00 0.99 NASDAQ 100 0.97 1.00 1 0.98 DOWN JONES 0.95 0.99 0.98 1