1. 0
5,000
10,000
15,000
20,000
25,000
30,000
0
5,000
10,000
15,000
20,000
25,000
Population('000)
RM(million)
GDP Population
Sabah
Sarawak
Johor
Pahang
Terengganu
Negeri
Sembilan
Melaka
Kelantan
Perak
Selangor
Kedah
South China Sea
Economy
■ Real
GDP
is
expected
to
expand
by
4.4%
this
year,
and
then
to
average
5.4%
a
year
in
2014-‐17.
■ InflaDon
forecast
for
2014
has
been
reduced
as
the
introducDon
of
a
new
goods
and
services
tax
(GST)
has
been
delayed.
Consumer
prices
are
expected
to
average
2%
in
2014,
from
2.2%
previously,
and
1.9%
in
2013.
■ The
current
account
will
remain
in
surplus
in
2013-‐17,
at
the
equivalent
of
5.9%
of
GDP
on
average,
compared
with
12.2%
in
2008-‐12.
Business
Environment
■ Malaysia’s
global
posiDon
in
The
Economist
Intelligence
Unit's
business
environment
rankings
rises
from
23rd
in
2008-‐12
to
19th
in
2013-‐17.
The
country's
regional
ranking
is
unchanged
at
sixth.
■ Market
opportuniDes
will
improve
in
the
forecast
period
amid
sustained
economic
growth
and
relaDvely
strong
external
demand.
There
will
be
improvements
in
policy
towards
private
enterprise
and
foreign
investment,
largely
because
the
government
will
conDnue
with
its
efforts
to
raise
private-‐sector
investment
levels.
Poli2cal
■ Malaysia
is
a
federated
consDtuDonal
monarchy
whereby
the
King
appoints
a
Prime
Minister
and
on
the
Prime
Minister’s
advice,
the
Cabinet.
■ Currently,
the
poliDcal
structure
is
that
of
a
bicameral
federal
parliament
as
the
last
general
elecDon
took
place
in
May
2013
with
the
next
poll
due
to
take
place
in
2018.
■ The
Barisan
Nasional
(BN)
coaliDon
will
govern
with
a
simple
parliamentary
majority.
The
posiDon
of
the
prime
minister,
Najib
Razak,
has
been
weakened,
partly
because
he
failed
to
deliver
on
a
promise
to
secure
a
two-‐thirds
parliamentary
majority.
Mr
Najib
could
face
a
challenge
to
his
leadership
later
this
year.
Source:
EIU,
Department
of
Sta4s4cs,
Malaysia,
Lonely
Planet
(Map
of
Malaysia)
Country Overview
Future Outlook of Malaysia
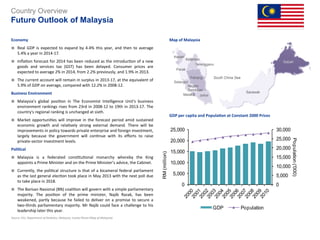
Map
of
Malaysia
GDP
per
capita
and
Popula2on
at
Constant
2000
Prices
2. 0
5,000
10,000
15,000
20,000
25,000
30,000
35,000
2005 2006 2007 2008 2009 2010
RM(million)
Agriculture
Mining and Quarrying
Manufacturing
Construction
Finance, Insurance, Real Estate and Business Services
Utilities, Transport, Storage &Communication
Wholesale &Retail Trade, Accommodation and Restaurants
Other Services
Government Services
0
100,000
200,000
300,000
400,000
500,000
600,000
2005 2006 2007 2008 2009 2010
RM(million)
Johor Kedah Kelantan
Melaka Negeri Sembilan Pahang
Pulau Pinang Perak Perlis
Selangor Terengganu Sabah
Sarawak WPKuala Lumpur WPLabuan
Supra1
GDP
Per
Capita
by
State
at
Constant
2000
Prices
Note:
1
Supra
State
covers
produc4on
ac4vi4es
beyond
the
centre
of
predominant
economic
interest
for
any
state.
Loca2on
■ Sabah
is
the
easternmost
state
of
Malaysia
and
the
2nd
largest
state
in
the
country
a^er
Sarawak.
The
capital
of
Sabah
is
Kota
Kinabalu.
■ It
is
located
on
the
northern
porDon
of
the
island
of
Borneo.
It
also
shares
a
border
with
the
province
of
East
Kalimantan
of
Indonesia
in
the
south.
Economy
■ As
of
2010,
Sabah
is
the
poorest
state
in
Malaysia.
GDP
growth
was
2.4%,
the
lowest
in
Malaysia
behind
Kelantan.
■ Sabah
economy
relies
on
three
key
development
sectors;
agriculture,
tourism
and
manufacturing.
■ Agriculture
remains
the
largest
economic
driver
of
Sabah,
averaging
26.9%
of
GDP
over
the
past
6
years.
However,
it
registered
negaDve
2.6%
growth
in
2010
as
compared
to
7.2%
growth
in
storage
and
communicaDon
sector.
■ Agricultural
producDon
has
become
increasingly
based
on
oil
palm
plantaDons
and
logging,
and
to
a
lesser
extent
on
rubber
and
other
crops.
■ Sabah
has
two
compeDDve
advantages,
one
of
which
is
its
primary
exports
–
palm
oil
and
crude
petroleum
are
growing
in
value
as
demand
increases
worldwide
and
its
strategic
locaDon
along
major
internaDonal
shipping
routes,
thus
is
closer
than
other
regional
players
to
major
markets
in
China,
Japan
and
South
Korea.
People
■ The
populaDon
of
Sabah
is
3,117,405
as
of
the
last
census
in
2010
and
is
the
third
most
populous
state
in
Malaysia
a^er
Selangor
and
Johor.
■ The
people
of
Sabah
are
divided
into
32
officially
recognised
ethnic
groups,
in
which
28
are
recognized
as
Bumiputra,
or
indigenous
people.
■ Slum
is
nonexistent
in
Malaysia
but
the
highest
number
of
squafer
seflements
is
in
Sabah
with
households
between
20,000
to
40,000.
Source:
EIU,
Department
of
Sta4s4cs,
Malaysia
Country Overview
Sabah State
GDP
by
Economic
Ac2vity
at
Constant
2000
Prices
GDP
Growth
1. Selangor
2. Pulau
Pinang
3. Johor
Economic
Growth
1. Storage
&
CommunicaDon
2. Finance,
Insurance,
Real
Estate
&
Business
Services
3. Manufacturing