The document is a newsletter from STANLIB, an investment management company. It discusses various topics related to the South African and global economic and investment environment.
The main article analyzes five options for growing South Africa's economy in the current challenging conditions: 1) Increasing government spending, but debt levels are already high; 2) Private business expansion and new ventures, but confidence is low; 3) Increasing exports, but world trade growth is slow; 4) Boosting household consumption, but job losses are a risk; 5) Public-private partnerships to develop infrastructure, which could attract private funding and ease the government's budget. None of the options on their own are seen as sufficient to meaningfully lift growth
![VOLUME 04 | 2015 | 07
HOW DO WE CREATE
WEALTH IN THE
CURRENT CYCLE?
RETURNSARE
TEMPORARYFROMHERE
Howdowecreatewealth
fromthispointforwardin
thecurrentcycle?Before
answeringthisquestion,it’s
importanttounderstandthe
currentmarketconditions.
Webelievethisisbest
explained bythe testimony
ofAdolphMiller,former
FederalReservemember,
beforethe USSenate in 1931.
Hewastestifyingaboutthe
Fed’s1927interestratecuts
andaccelerationofopen
marketpurchases,which
fuelledthespeculationand
lowqualitycreditexpansion
thatculminated inthe1929
stockmarketpeakandthen
collapse:
“Itwasthegreatestand
boldestoperationever
undertakenbytheFederal
ReserveSystem,and,in my
judgment, resulted inone
ofthemostcostlyerrors
committed byitoranybanking
systeminthelast75 years…
Businesscould notuseand
wasnotaskingforincreased
moneyatthattime.”
Insimpleterms,Millerwas
sayingifconsumersor
businessarenotdemanding
moneyyetcentralbanksflood
themwithexcessivemoney,
thisleadstoamisallocation
ofcapital. Bothinvestors
andbusinessesallocate
theirwealthtoanyasset
givingthemabetterreturn
thanzero.Thismisallocation
resultsinexcessiverisk-taking
andthecreationofassetprice
bubbles.
Alltoooften,investment
discussionsmoveawayfrom
thesimpleprincipleatthe
heartofa goodinvestment
decision: howdo youcreate
realwealthoveracycle?
Aclient'sageorwhenthey
needtheirwealthisonly
relevanttothedegree
ofexcessiveriskyouare
preparedtotaketogenerate
thatrealwealth. Whethera
clientis20or82thesimple
goalisrealwealthcreation.
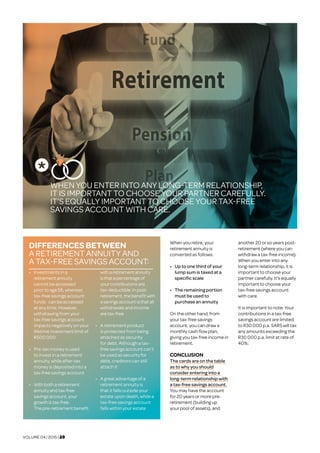
AREWEINABUBBLE…?
Setting aside the technical
debates about what defines
an asset bubble, we look at
the risk of a loss of wealth for
clients over the next part of
the cycle. We don’t attempt
to forecast the market; we
simply look at what the risks
are to clients’ wealth if they
are invested in the current
set of market conditions.
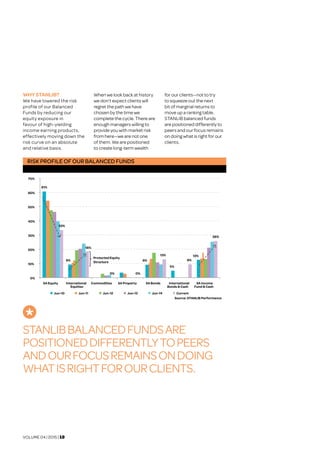
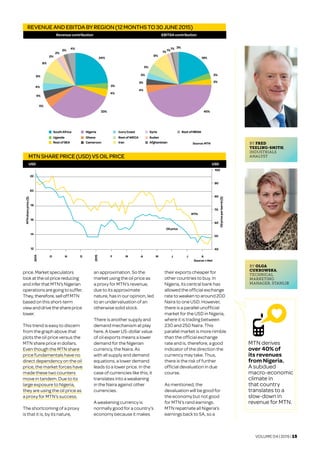
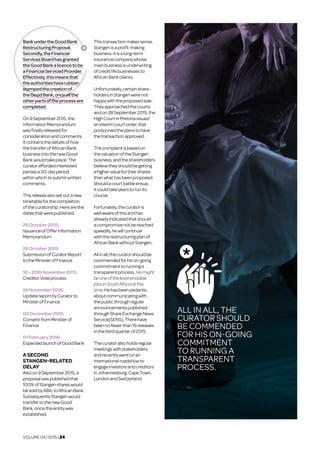
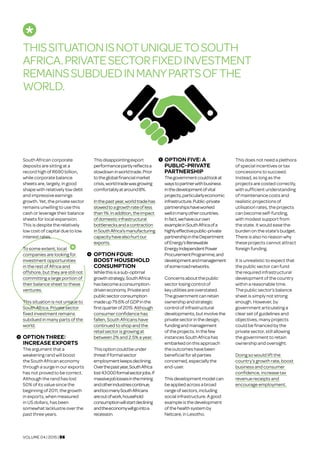
Historically, we have seen
that deep losses of clients’
wealth occur when the
market is expensive, as
illustrated in the graph below.
It shows that investing in
the market at the current
valuation level historically
has resulted in a loss of
more than half of the clients’
wealth within the next three
years. So, for example, you
can see that at single digit
price to earnings ratios (PEs)
the biggest loss a client
suffered historically was less
than 20%, while investing
in the market at PEs above
15, losses historically have
reached above 50%.
BY ROBIN EAGAR
HEAD OF STANLIB
MULTI-ASSET
FRANCHISE
S&P500 PE VS DEEPEST SUBSEQUENT 3-YEAR LOSS
6"(C"30"A"(
!
! <!Q,&!2#(.)+/ 0&%!WX!VF,/++&(!WXY 9!Q#>/2:0 ![ !#(!0/.1+4!)2!#+%!
! )*/#2!#?&(!]W9!)++!0)4!*,&!0).&!*,/27 R!
3(& !
*# ^?)+3&%!.)(;&*!#2!1&);!.)(7/20 !*# # !_
-#(!'+/&2*0< !
:! <!D&*3(2 0 !
9! !
-60%
-50%
-40%
-30%
-20%
-10%
0%
10%
20%
0,0 2,5 5,0 7,5 10,0 12,5 15,0 17,5 20,0 22,5 25,0 27,5
S&P500 PE
Source: STANLIB Research/I-Net BFA
Current PE](https://image.slidesharecdn.com/4f50253a-5079-419c-8fdb-ed9267c65ea2-160910153940/85/15430-STANDPOINT-October-2015-F-PDF-7-320.jpg)