This document discusses how technology-enabled solutions can streamline environmental remediation projects and enhance stakeholder engagement. It provides two case studies as examples. For the first case study, implementing 3D data visualization and targeted remediation identified additional contamination sources, reduced long-term monitoring costs, and led to regulatory closure three years early. For the second active site, 3D analysis informed a targeted in-situ chemical oxidation and soil mixing remedy, costing $2.1 million versus an estimated $6 million under traditional methods. Overall, the document advocates that digital tools can improve conceptual site models, support more efficient investigation and remediation, and facilitate communication to various stakeholders.
Only Cash On Delivery Call Girls Service In Sangli Enjoy 24/7 Escort Service
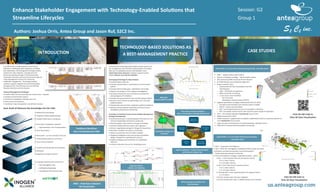
G2_#534_Poster_Orris.pdf.pdf
1. Enhance Stakeholder Engagement with Technology-Enabled Solutions that
Streamline Lifecycles
Authors: Joshua Orris, Antea Group and Jason Ruf, S2C2 Inc.
TECHNOLOGY-BASED SOLUTIONS AS
A BEST-MANAGEMENT PRACTICE
CASE STUDIES
Session: G2
Group 1
INTRODUCTION
Cost-Effectively managing global environmental
liabilities is challenging, given regulatory variability
and stakeholders. By leveraging technology-enabled
solutions for data collection, management and
enhanced reporting through 3-Dimensional data
visualization business and technical decisions align for
a Best Management Practice for enhancing
stakeholder engagement. Technology-enabled
solutions supports adaptive environmental liability
management for streamlining more cost-effective
lifecycle reductions and site closures.
Technical Management Challenges:
• Complex data sets and reporting over several years—decades
• Complex environmental systems
• Varied site investigation methods over time
• Performance inconsistency
• Variability in data interpolation and deficient analysis
Traditional Workflow:
Not a Comprehensive CSM
Goal: Build all Relevant Site Knowledge into the CSM
• Refined full-scale design
• Targeted remedy implementation
• Flexible Performance monitoring
• Innovative investigation methods:
High Resolution Site Characterization
• Data Gap Analysis
• Real estate—current and future land use
• Understanding business risk drivers
• Source area evaluation
• Contaminant distribution & Delineation
• Receptors
• Regulatory changes & drivers
• Leverage Historical Data Investments
Site investigation data
Geology/hydrogeology
Remediation Performance Data
HRSC—Field Data Collection
3D Visualization
A standardized technology-based digital solution process for
the management and consistent representation of complex
data sets. An adaptable process that facilitates more
informed business decisions, leading to environmental
liability lifecycle cost and risk reduction.
Leveraging Technology for Data Analysis:
• Evaluate historic data sets
• Evaluate chemical data in relationship to environmental
systems
• Evaluate technical data gaps—statistically and visually
• Supports the design of more targeted investigations
• Calculate contaminant mass and volume estimates for
varying degrees of confidence
• Evaluate conceptual and full-scale remedial design options
• Results in more refined remedial designs and successful
implementations
• Evaluate data sets over time: predictive model (simulations)
• Optimize monitoring well network(s) and dynamic post-
remediation performance monitoring
A Solution to Facilitate Environmental Liability Management
Strategy Development:
• Assist technical team in presenting data-information to non
-technical stakeholders & Business Leadership
• Minimize global cultural barriers through technology
• Facilitate collaborative discussions with regulators
• Enhance negotiating leverage for Mergers & Acquisitions
• Normalize variables and reduce uncertainties
• Reduce uncertainties and normalize variables
• Targeted investigations and more precise remediation
design strategies for expediting Site Closures
• Validate strategies and investments for stakeholder
influence
• Enhance corporate reserve cost modeling process
HRSC Data
Analysis (MiHPT & OiHPT)
Remediation Design and
Evaluation
May-05 Oct-06 Feb-08 Jul-09 Nov-10 Apr-12 Aug-13 Dec-14 May-16 Sep-17 Feb-19 Jun-20
0
20000
40000
60000
80000
100000
120000
140000
160000
180000
200000
-
5.0
10.0
15.0
20.0
25.0
30.0
35.0
40.0
May-05 Oct-06 Feb-08 Jul-09 Nov-10 Apr-12 Aug-13 Dec-14 May-16 Sep-17 Feb-19 Jun-20
Concentration
(Ug/L)
Carbon
Tetrachloride
Mass
(kg)
Date
Carbon Tetrachloride - North Plume
Mass Average Concentration MaximumConcentrations
y = -0.0007x + 5.9959
R² = 0.5748
y = -0.0021x + 9.5423
R² = 0.6317
y = -0.0024x + 2.1382
R² = 0.6371
-8
-6
-4
-2
0
2
4
0
2
4
6
8
10
12
14
0 500 1000 1500 2000 2500 3000
ln(Concentration)
Date
Carbon Tetrachloride - North Plume
Average Concentration Maximum Concentrations Mass Decay Linear (Average Concentration) Linear (Maximum Concentrations) Linear (Mass Decay)
Time Series and Decay Analysis—
Mass, Concentration (Average & Maximum)
Off-site Receptor Evaluation and
Risk Evaluation
Data Visualization = Central Communication
and Technical Analysis Tool
Corporate Reserve
Liability Cost Modeling
CASE STUDY 1: 12-acre Former Manufacturing Facility—Sorocaba, Brazil
Click the QR Code to
View 3D Data Visualization
• 2003 — Original release date (CVOCs)
• Original remediation strategy — Biostimulation system
• GW monitoring $200k annual @ 30-year lifecycle
• $2.0 MM lifecycle cost invested through 2011
• Project transition 2011:
Implemented 3D Data Visualization and CSM
Development
$50k – 3DVA/data management
$60k annual GW monitoring
2 new source areas identified:
- Hot melt sump
- Wastewater treatment plant (WWTP)
• Targeted remediation strategies implemented (2012 & 2014):
Hot Melt sump excavation and injection system installed
WWTP—closure and demolition
EHC® soil mixing & placement prior to excavation restoration
EHC® permeable reactive barrier with injection system design & installation
• 2017—site reached regulatory Commercial closure levels
• $860k invested 2011-2018
• $200k invested in supplemental remediation implemented 2019; as a business decision to
reach Residential Closure levels
• Vapor Intrusion monitoring of unoccupied buildings, regulatory driver
• 2020-2023 Continued Post-Remediation Monitoring
CASE STUDY 2: 2.12-acre Active Manufacturing Facility—
Guarulhos, Brazil
• 2017 —Acquisition Due Diligence
• 2017—2018 Site Investigations completed (HRSC & Vapor Intrusion)
• 60 Multi-Level Monitoring Wells; Annual Remediation
performance groundwater monitoring
• CVOCs Remediation strategies implemented (2019—2022):
• AOC –1 ISCO Injection Pilot Test (6-Injection Points)
• 6-11 meter interval
• 11-16 meter interval
• AOC-2 EHC® Pilot Test (12-Injection Points)
• 6-11 meter interval
• 11-16 meter interval
• Full Scale EHC® Insitu Implementation (35-Injection Points)
• 5-13 meters
• SVE for subslab vapor intrusion mitigation
• $2.1M invested 2017-2021 vs $6MM Lifecycle cost modeled
Click the QR Code to
View 3D Data Visualization
S2
S2 C2 inc.