The document discusses importing and using libraries in Python for data analysis and visualization. It defines a slope function that calculates the slope between two points, and provides an example of calling the slope function and printing the output. It also provides introductory explanations of statistics, descriptive statistics, and the describe() method in Pandas for summarizing dataframes.
1. Dissecting the Program
Assignment
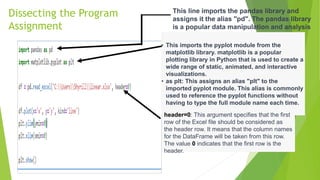
This line imports the pandas library and
assigns it the alias "pd". The pandas library
is a popular data manipulation and analysis
library in Python.
• This imports the pyplot module from the
matplotlib library. matplotlib is a popular
plotting library in Python that is used to create a
wide range of static, animated, and interactive
visualizations.
• as plt: This assigns an alias "plt" to the
imported pyplot module. This alias is commonly
used to reference the pyplot functions without
having to type the full module name each time.
header=0: This argument specifies that the first
row of the Excel file should be considered as
the header row. It means that the column names
for the DataFrame will be taken from this row.
The value 0 indicates that the first row is the
header.
2. This line defines a function named slope that takes four
arguments: x1, y1, x2, and y2. These arguments
represent the coordinates of two points on a 2D plane:
(x1, y1) and (x2, y2).
•This line calculates the slope of the line passing
through the points (x1, y1) and (x2, y2). The
formula for the slope between two points (x1, y1)
and (x2, y2) is (y2 - y1) / (x2 - x1).
•The calculated slope is stored in the variable s.
This line returns the calculated
slope s from the function.
•This line calls the slope function with the arguments
(0.25, 3, 0.50, 2), representing two points: (0.25, 3) and
(0.50, 2).
•The function calculates the slope of the line passing
through these points and returns the result.
•The print function is used to display the calculated
slope, so the output of the code will be the slope valu
4. What is Statistics
is the science of analyzing data.
is the science concerned with developing and studying
methods for collecting, analyzing, interpreting and
presenting empirical data.
5. Descriptive Statistics
refers to a set of methods used to summarize and describe
the main features of a dataset, such as its central tendency,
variability, and distribution. These methods provide an
overview of the data and help identify patterns and
relationships.
7. What is describe () in pythonn?
The describe() method computes and displays summary statistics for a
Python dataframe. (It also operates on dataframe columns and Pandas
series objects.)
is used to view some basic statistical details like percentile, mean,
std, etc. of a data frame or a series of numeric values.
Ex.
We can use the describe() function in Python to summarize the data:
8. Statistics Percentiles
Percentiles are used in statistics to give you a number that describes
the value that a given percent of the values are lower than.
df.plot(x='x', y='y', kind='line'):
df refers to the pandas DataFrame that contains the data you want to plot.
.plot() is a method provided by pandas to create different types of plots directly from a DataFrame.
x='x' and y='y' specify that the 'x' column and 'y' column from the DataFrame should be used as the x-axis and y-axis data for the plot, respectively.
kind='line' specifies that a line plot should be created. Other possible values for kind include 'bar', 'hist', 'scatter', and more, to create different types of plots.
plt.ylim(ymin=0):
plt refers to the matplotlib.pyplot module that was imported earlier.
.ylim() is a function from pyplot that is used to set the limits of the y-axis.
ymin=0 specifies that the minimum value of the y-axis should be set to 0. This ensures that the y-axis starts from 0.
plt.xlim(xmin=0):
.xlim() is a function from pyplot used to set the limits of the x-axis.
xmin=0 specifies that the minimum value of the x-axis should be set to 0. This ensures that the x-axis starts from 0.
When we have created a model for prediction, we must assess the prediction's reliability.
After all, what is a prediction worth, if we cannot rely on it?