1. Jie Jiang*, Mark Hereld**, Joseph Insley**, Michael E. Papka**, Silvio Rizzi**, Thomas Uram**, Venkatram Vishwanath**
* University of Illinois at Chicago, ** Argonne National Laboratory
LDAV October 25-26, 2015 Chicago, Illinois, USA
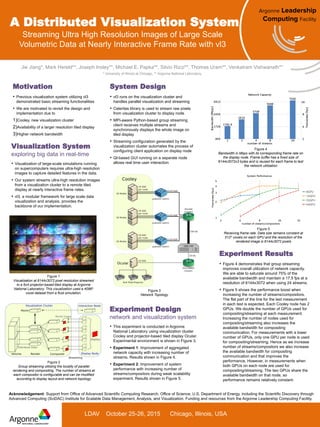
Experiment Design
network and visualization system
• This experiment is conducted in Argonne
National Laboratory using visualization cluster
Cooley and projector-based tiled display Ocular.
Experimental environment is shown in Figure 3.
• Experiment 1: Improvement of aggregated
network capacity with increasing number of
streams. Results shown in Figure 4.
• Experiment 2: Improvement of system
performance with increasing number of
streams/compositors during weak scalability
experiment. Results shown in Figure 5.
A Distributed Visualization System
Streaming Ultra High Resolution Images of Large Scale
Volumetric Data at Nearly Interactive Frame Rate with vl3
Motivation
• Previous visualization system utilizing vl3
demonstrated basic streaming functionalities
• We are motivated to revisit the design and
implementation due to
1)Cooley, new visualization cluster
2)Availability of a larger resolution tiled display
3)Higher network bandwidth
Figure 1
Visualization at 6144x3072 pixel resolution streamed
to a 6x4 projector-based tiled display at Argonne
National Laboratory. This visualization used a 40963
voxel dataset from a fluid simulation.
Figure 3
Network Topology
Experiment Results
• Figure 4 demonstrates that group streaming
improves overall utilization of network capacity.
We are able to saturate around 75% of the
available bandwidth and maintain a 17.5 fps at a
resolution of 6144x3072 when using 24 streams.
• Figure 5 shows the performance boost when
increasing the number of streams/compositors.
The flat part of the line for the last measurement
in each test is expected. Each Cooley node has 2
GPUs. We double the number of GPUs used for
compositing/streaming at each measurement.
Increasing the number of nodes used for
compositing/streaming also increases the
available bandwidth for compositing
communication. For measurements with a lower
number of GPUs, only one GPU per node is used
for compositing/streaming. Hence as we increase
number of streams/compositors we also increase
the available bandwidth for compositing
communication and that improves the
performance. However, in measurements when
both GPUs on each node are used for
compositing/streaming. The two GPUs share the
available bandwidth on that node, so
performance remains relatively constant.
System Design
• vl3 runs on the visualization cluster and
handles parallel visualization and streaming
• Celeritas library is used to stream raw pixels
from visualization cluster to display node
• MPI-aware Python-based group streaming
client receives multiple streams and
synchronously displays the whole image on
tiled display
• Streaming configuration generated by the
visualization cluster automates the process of
configuring client application on display node
• Qt-based GUI running on a separate node
allows real time user interaction
Figure 4
Bandwidth in Mbps with its corresponding frame rate on
the display node. Frame buffer has a fixed size of
6144x3072x3 bytes and is reused for each frame to test
the network utilization
Figure 2
Group streaming utilizing the locality of parallel
rendering and compositing. The number of streams at
each compositor is configurable and can be modified
according to display layout and network topology
Figure 5
Receiving frame rate. Data size remains constant at
5123 voxels on each GPU and the resolution of the
rendered image is 6144x3072 pixels
Acknowledgement: Support from Office of Advanced Scientific Computing Research, Office of Science, U.S. Department of Energy, including the Scientific Discovery through
Advanced Computing (SciDAC) Institute for Scalable Data Management, Analysis, and Visualization. Funding and resources from the Argonne Leadership Computing Facility.
Visualization System
exploring big data in real-time
• Visualization of large-scale simulations running
on supercomputers requires ultra-high resolution
images to capture detailed features in the data.
• Our system streams ultra-high resolution images
from a visualization cluster to a remote tiled
display at nearly interactive frame rates.
• vl3, a modular framework for large scale data
visualization and analysis, provides the
backbone of our implementation.