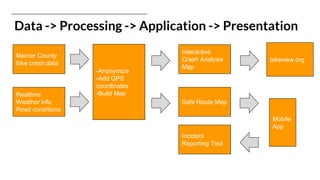
Code For Princeton
Team’s solution: bikeview.org
Early Impact: Princeton Bicycle Advisory Committee
Princeton Bicycle Master Plan
Low-traffic-stress routes highlighted
Bike View bike crash map
Municipal need statement
Princeton is in the process of finalizing a Bicycle Master Plan
which involves making data-driven decisions
We have created visualizations of crash information to help:
• Plan bicycle infrastructure
• Set priorities for policing and road improvement
• Raise awareness of bike safety issues by making crash data
freely available to the public.
• Reporting of non-crash bike incidents
PBAC
Data -> Processing -> Application -> Presentation
Mercer County
bike crash data
Interactive
Crash Analysis
Map
Realtime
Weather info
Road conditions
Safe Route Map
Incident
Reporting Tool
Mobile
App
bikeview.org
-Anonymize
-Add GPS
coordinates
-Build Map
Technical Toolbox
● Data Analysis and Visualization - R, Shiny App, Plotly & D3
● Website - HTML5, CSS, PHP and MySQL
● Mobile app - Android SDK
● Mapping - CartoDB, ArcGIS, Google Geocoding API
Bike View User Interface -
Website and Mobile Application
• Crash Statistics turned into interactive maps and
visualizations
• Collection of bicycle safety tips and resources
• Bike View makes it easy to find routes that are safe, and
avoid ones that aren’t
Municipal impact of Bike View
• Princeton Committees use bikeview.org to inform
decisions on the Princeton Bicycle Master Plan
• Captures information from users on road safety matters;
feeds to Access Princeton - SeeClickFix
• Helps prioritize public road improvements to address the
most frequent crash locations
• Sparks dialog to address road safety for all
Originality
• Unique Data- Bike View highlights hard-to-get bicycle-
related crash data whereas most crash maps are car-
centric
• Interactive - User can filter/map the data by variables
such as crash severity and cell phone or alcohol use
• Safety Focused - Bike View’s route planning mobile app
optimizes for safety rather than travel time or total
distance
• Customized Dashboard - Built analysis dashboard based
on car, bike & speed sign data.
Scalable
• Transportation modes:
Bike
Car
Pedestrian
• Geography:
Municipalities
Counties
State
Usability
• Princeton Bicycle Advisory Committee used Bike View
in its review of the Bicycle Master Plan on 3/23/17
• Turnkey, intuitive user interface for Princeton;
video tutorials on website
• Other municipalities need to provide data, do data
preparation and upload
Hyperlinks
• bikeview.org
• Shiny App Dashboard
• Multimodal Interactive Crash Map (ArcGIS)
• Bikes-only Crash Map
• Cars-only Crash Map
• Mobile App
• Map demo/tutorial video
• Team Work (Supporting Docs, Lauren have access)

Coding for Community - Team (Bike View)

  • 1.
  • 2.
  • 3.
    Early Impact: PrincetonBicycle Advisory Committee Princeton Bicycle Master Plan Low-traffic-stress routes highlighted Bike View bike crash map
  • 4.
    Municipal need statement Princetonis in the process of finalizing a Bicycle Master Plan which involves making data-driven decisions We have created visualizations of crash information to help: • Plan bicycle infrastructure • Set priorities for policing and road improvement • Raise awareness of bike safety issues by making crash data freely available to the public. • Reporting of non-crash bike incidents PBAC
  • 5.
    Data -> Processing-> Application -> Presentation Mercer County bike crash data Interactive Crash Analysis Map Realtime Weather info Road conditions Safe Route Map Incident Reporting Tool Mobile App bikeview.org -Anonymize -Add GPS coordinates -Build Map
  • 6.
    Technical Toolbox ● DataAnalysis and Visualization - R, Shiny App, Plotly & D3 ● Website - HTML5, CSS, PHP and MySQL ● Mobile app - Android SDK ● Mapping - CartoDB, ArcGIS, Google Geocoding API
  • 7.
    Bike View UserInterface - Website and Mobile Application • Crash Statistics turned into interactive maps and visualizations • Collection of bicycle safety tips and resources • Bike View makes it easy to find routes that are safe, and avoid ones that aren’t
  • 8.
    Municipal impact ofBike View • Princeton Committees use bikeview.org to inform decisions on the Princeton Bicycle Master Plan • Captures information from users on road safety matters; feeds to Access Princeton - SeeClickFix • Helps prioritize public road improvements to address the most frequent crash locations • Sparks dialog to address road safety for all
  • 9.
    Originality • Unique Data-Bike View highlights hard-to-get bicycle- related crash data whereas most crash maps are car- centric • Interactive - User can filter/map the data by variables such as crash severity and cell phone or alcohol use • Safety Focused - Bike View’s route planning mobile app optimizes for safety rather than travel time or total distance • Customized Dashboard - Built analysis dashboard based on car, bike & speed sign data.
  • 10.
    Scalable • Transportation modes: Bike Car Pedestrian •Geography: Municipalities Counties State
  • 11.
    Usability • Princeton BicycleAdvisory Committee used Bike View in its review of the Bicycle Master Plan on 3/23/17 • Turnkey, intuitive user interface for Princeton; video tutorials on website • Other municipalities need to provide data, do data preparation and upload
  • 12.
    Hyperlinks • bikeview.org • ShinyApp Dashboard • Multimodal Interactive Crash Map (ArcGIS) • Bikes-only Crash Map • Cars-only Crash Map • Mobile App • Map demo/tutorial video • Team Work (Supporting Docs, Lauren have access)