1. BLOOD FLOW ADAPTATIONS IN BASEBALL PITCHERS
Jesse Nelson1; Kevin Laudner, PhD, ATC1; Nick Burke, ATC1;
Noelle Selkow, PhD, ATC1; Keith Meister, MD2
1School of Kinesiology & Recreation, Illinois State University, Normal, IL;
2Texas Metroplex Institute for Sports Medicine and Orthopedics, Arlington, TX
INTRODUCTION
• There has been a recent increase in the
diagnoses of upper extremity
neurovascular injuries among baseball
players.1,2
• The repetitive nature of baseball which
causes various adaptations in shoulder
flexibility and strength may cause similar
alterations of the vascular tissue.
• An improved understanding of these
potential adaptations may aide in the
prevention, diagnosis, and treatment of
vascular pathologies among baseball
players.
PURPOSE
METHODS
Participants
• 20 professional baseball pitchers and 16
position players volunteered to
participate in this study (Table 1).
Table 1. Participant demographics.
• All participants had no recent history of
upper extremity injury or any upper
extremity surgery.
• All participants provided informed
consent prior to testing as mandated by
the university’s institutional review
board.
• Our results support these previous
findings and additionally show that a
further decrease in blood flow is
present among pitchers when
provocatively tested following a
single competitive season.
• Standard current methods of testing
may not show as clearly a decrease
in flow if the arm is not provoked. As
this study and prior studies have
shown, a position of rest or arm
positions of less than extremes of
abduction and external rotation, may
not elucidate the severity of the
problem in a measurable way.
CONCLUSION
REFERENCES
ILLINOIS STATE UNIVERSITY
Procedures
• To determine if blood flow among
pitchers and position players changes
after a competitive baseball season.
RESULTS
• Following the competitive baseball
season, the pitchers had significantly
less blood flow volume when in the
provocative shoulder position (p =
0.009) (Table 1).
• There was no difference in the blood
flow of pitchers with the shoulder in a
resting position (p = 0.48) (Table 2).
• Following a competitive baseball
season, pitchers had significantly less
blood flow in a provocative position
compared to position players.
• These results should be considered in
the prevention, diagnoses, and
treatment of the various upper
extremity neurovascular pathologies
common among baseball players.
Blood Flow Measurement
• Blood flow measurements were taken
at the beginning of two consecutive
competitive seasons using a Terason
t3000 M-series diagnostic ultrasound
(Teratech, Burlington, MA)
• Blood flow was measured in the
following positions:
– Standing with test arm at
participants side
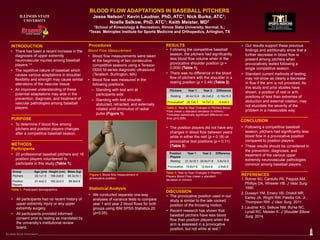
– Standing with test shoulder
abducted, retracted, and externally
rotated until diminution of radial
pulse (Figure 1).
1. Rohrer MJ, Cardullo PA, Pappas AM,
Phillips DA, Wheeler HB. J Vasc Surg.
1990.
2. Duwayri YM, Emery VB, Driskill MR,
Earley JA, Wright RW, Paletta GA, Jr.,
Thompson RW. J Vasc Surg. 2011.
3. Laudner KG, Selkow NM, Burke NC,
Lynall RC, Meister K. J Shoulder Elbow
Surg. 2014.
DISCUSSION
• The provocative position used in our
study is similar to the late cocked
position of the throwing motion.
• Recent research has shown that
baseball pitchers have less blood
flow than position players when the
arm is assessed in a provocative
position, but not while at rest.3
• We conducted separate one-way
analyses of variance tests to compare
year 1 and year 2 blood flows for both
groups using IBM SPSS Statistics 20
(p<0.05).
ILLINOIS STATE
UNIVERSITY
Statistical Analysis
Pitchers Year 1 Year 2 Difference
Resting 26.4±12.8 26.2±8.2 -0.19±15.2
Provocative* 20.7±6.7 14.7±7.3 -5.6±9.5
Position
Players
Year 1 Year 2 Difference
Resting 21.3±15.1 24.6±11.9 3.4±14.3
Provocative 15.6±7.6 12.8±4.8 -2.8±8.5
Figure 1. Blood flow measurement in
provocative position.
• The position players did not have any
changes in blood flow between years
while in either the rest (p = 0.18) or
provocative test positions (p = 0.11)
(Table 3).
Group Age (yrs) Height (cm) Mass (kg)
Pitchers 22.1±1.5 188.2±6.6 94.3±10.1
Position
21.4±2.2 182.2±3.0 89.9±5.8
Players
Table 2. Year-to-Year Changes in Pitchers Blood
Flow (mean ± standard deviation in ml/min)
*Indicates statistically significant difference over
time (p=0.009).
Table 3. Year-to-Year Changes in Position
Players Blood Flow (mean ± standard
deviation in ml/min)