1. Studying the Effects of Social Behaviors and Personalities on Organic Chemistry Performance
Janson Ho and Unni Kurumbail
University of Rochester – Department of Chemistry
Introduction
Problem solving in organic chemistry necessitates a transition in
the way of thinking. Through workshops and specially designed
problems, students develop the skills to synthesize knowledge of
organic reactions and apply them to alternative scenarios.
However, every student maintains a unique personality and social
behavior, which affects their learning and thinking process.
Robinson and Dollinger have both reported that personality and
social behaviors such as openness are correlated with test
performance1,2. The goal of this study is to determine the effects
of students’ personalities and social behaviors on their organic
chemistry performance.
Hypothesis
Students who demonstrate extroverted qualities and social
behaviors of group participation and openness will perform better in
organic chemistry.
Methods
48 students were given surveys during workshop on
personalities and social behaviors for organic chemistry, from
which 44 students participated. The survey consisted of 10
questions designed to gauge participation and learning
preferences in organic chemistry. The survey utilized a scale of
1 to 5 for each question to provide students with options in
relatability. Some questions asked in the survey included:
• I prefer studying in groups for organic chemistry.
• In workshop I prefer working through problems on the board
rather than on paper.
• In workshop, I prefer talking through a problem to thinking
through a problem.
• I consider myself more of an introvert rather than an
extrovert.
• In workshop, I prefer listening to others' opinions rather than
expressing my own.
Data: Personality
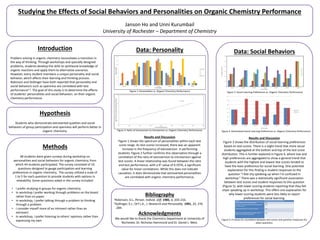
Figure 1: Personalities vs. Organic Chemistry Performance
Figure 2: Ratio of Extroversion to Introversion vs. Organic Chemistry Performance
Results and Discussion
Figure 1 shows the spectrum of personalities within each test
score range. As test scores increased, there was an apparent
increase in the frequency of extroversion in performing
students. Figure 2 further confirms this observation through a
correlation of the ratio of extroversion to introversion against
test scores. A linear relationship was found between the ratio
and test performance, with a R2 value of 0.5976, a significant
value for linear correlations. While this does not indicate
causation, it does demonstrate that extroverted personalities
are correlated with organic chemistry performance.
Data: Social Behaviors
0
2
4
6
8
10
12
14
101-150 151-200 201-250 251-300 301-350 351-400 401-450
NumberofStudents
Test Score Ranges
1-Introvert
2
3
4
5-Extrovert
R² = 0.5976
0
0.5
1
1.5
2
2.5
3
3.5
50 100 150 200 250 300 350 400 450
RatioofExtroversiontoIntroversion(NumberofResponses)
Test Scores (Cumulative Points)
Bibliography
1Robinson, D.L..Person. Individ. Diff. 1985, 6, 203-216.
2Dollinger, S.J.; Orf L.A., J. Research and Personality. 1991, 25, 276
-284.
Acknowledgments
We would like to thank the Chemistry Department at University of
Rochester, Dr. Nicholas Hammond and Dr. Daniel J. Weix.
0
0.1
0.2
0.3
0.4
0.5
0.6
101-150 151-200 201-250 251-300 301-350 351-400 401-450
1
2
3
4
5
Test Score Ranges
PercentagesofStudents
0
0.1
0.2
0.3
0.4
0.5
0.6
0.7
101-150 151-200 201-250 251-300 301-350 351-400
Less Social
More Social
Figure 3: Social Learning Preferences vs. Organic Chemistry Performance
Figure 4: Generalized Social Learning Preferences vs. Organic Chemistry Performance
Test Score Ranges
Results and Discussion
Figure 3 shows the distribution of social learning preferences
based on test scores. There is a slight trend that more social
students aggregated at the bottom and top of the test score
distribution. This is further explored in Figure 4, where low and
high preferences are aggregated to show a general trend that
students with the highest and lowest test scores tended to
have the least preference for social learning. One potential
explanation for this finding is student responses to the
question “I feel shy speaking up when I’m confused in
workshop.” There was a statistically significant association
between test scores and student responses to this question
(Figure 5), with lower-scoring students reporting that they felt
shyer speaking up in workshop. This offers one explanation for
why lower-scoring students were less likely to report
preferences for social learning.
Question P-Value (not assuming Gaussian distribution)
I prefer studying in groups for organic chemistry. .0649
In workshop I am more inclined to work through problems with
peers than on my own.
.0639
I feel shy speaking up when I'm confused in workshop. .0227
When I don't understand something in workshop, I am more
willing to ask the TA about it than my peers.
.0898
Figure 5: P-values for correlation between test scores and question responses for
select questions.