
Recommended
More Related Content
What's hot
Similar to Claims analysis report 2014
Similar to Claims analysis report 2014 (14)
Claims analysis report 2014
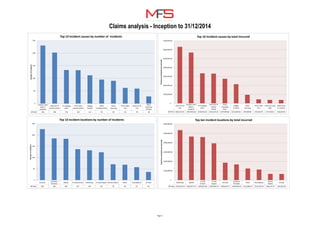
- 1. Claims analysis - Inception to 31/12/2014 Collision with object / property Client hit TP parked vehicle TP changing lanes TP hit client parked vehicle Alleged Incident Client changing lanes Client reversing TP hit client rear Client hit TP rear Other motorway incident Total 230 202 133 132 112 95 90 62 59 28 0 50 100 150 200 250 Numberofincidents Top 10 incident causes by number of incidents Client hit TP rear Collision with object / property TP changing lanes Client hit TP parked vehicle Client changing lanes Alleged Incident Client reversing TP hit client rear Client turning right Other head on collision Total £632,155.42 £567,842.66 £335,032.22 £332,223.24 £274,499.66 £213,695.05 £94,629.85 £43,922.04 £37,356.65 £36,634.65 £- £100,000.00 £200,000.00 £300,000.00 £400,000.00 £500,000.00 £600,000.00 £700,000.00 Totalincurred(paidandreserved) Top 10 incident causes by total incurred Motorway (blank) A-road (minor) A-road (major) Car park Company Premises Other Roundabout Service Station B-road Total £534,555.56 £465,017.74 £459,953.81 £392,905.35 £185,044.77 £166,928.25 £123,087.47 £112,191.63 £66,147.37 £65,022.20 £- £100,000.00 £200,000.00 £300,000.00 £400,000.00 £500,000.00 £600,000.00 Totalincurred(paidandreserved) Top ten incident locations by total incurred Car park Company Premises (blank) A-road (minor) Motorway A-road (major) Service Station Other Roundabout B-road Total 226 185 183 137 132 123 70 68 57 36 0 50 100 150 200 250 Numberofincidents Top 10 incident locations by number of incidents Page 1
- 2. Claims analysis - Inception to 31/12/2014 Unit E Unit D Unit A Unit C Unit F Unit B Total 232 223 221 215 215 188 0 50 100 150 200 250 Numberofincidents Number of incidents by business unit Unit D Unit F Unit E Unit C Unit A Unit B Total £532,974.33 £508,922.29 £453,764.42 £429,707.30 £390,395.49 £369,496.51 £- £100,000.00 £200,000.00 £300,000.00 £400,000.00 £500,000.00 £600,000.00 Totalincurred(paidandreserved) Total incurred by business unit Page 2
- 3. Claims analysis - Inception to 31/12/2014 19-30 9% 31-40 16% 41-50 21% 51-60 17% Over 60 6% Unknown 31% Number of incidents by driver age band £ Nil, £- , 0% £1,001-£5,000, £1,033,312.96 , 39% £1-£1,000, £51,930.10 , 2% £10,001-£20,000, £274,611.56 , 10% £5,001-£10,000, £442,323.61 , 16% Over £20,000, £883,082.11 , 33% Total incurred by cost band 19-30, £217,330.86 , 8% 31-40, £439,085.24 , 16% 41-50, £460,818.17 , 17% 51-60, £316,826.65 , 12% Over 60, £122,536.79 , 5% Unknown, £1,128,662.63 , 42% Total incurred by driver age band £ Nil 41% £1-£1,000 8% £1,001-£5,000 43% £10,001-£20,000 2% £5,001-£10,000 5% Over £20,000 1% Number of incidents by cost band Page 3
- 4. Claims analysis - Inception to 31/12/2014 Disputing Liability, £837,086.84 , 31% Fault, £1,822,235.35 , 68% Fault - No TPD, £3,984.92 , 0% Non fault, £13,400.00 , 1% Non fault - No TPD, £2,250.00 , 0% Non-fault – No chance of recovery, £- , 0% Partial fault, £6,303.23 , 0% Partial fault - No TPD, £- , 0% Total incurred by liability Disputing Liability 39% Fault 49% Fault - No TPD 1% Non fault 10% Non fault - No TPD 1% Non-fault – No chance of recovery 0% Partial fault 0% Partial fault - No TPD 0% Number of incidents by liability Page 4
- 5. Claims analysis - Inception to 31/12/2014 Drivers with repeated incidents Repeat drivers Driver Number of incidents Total third party incurred Peter 4 1,873.20£ Paul 3 -£ George 4 7,007.00£ Ringo 3 1,500.00£ Agency 28% Unknown 12% Own driver 60% Number of incidents own drivers vs agency drivers Agency, £1,039,983.91, 39% Unknown, £251,088.21, 9% Own driver, £1,394,188.22, 52% Total incurred own drivers vs agency drivers Page 5