
Recommended
Recommended
More Related Content
What's hot
What's hot (18)
Similar to Stone Tan China Cellphone Manufacturing Report
Similar to Stone Tan China Cellphone Manufacturing Report (20)
Recently uploaded
Recently uploaded (20)
Stone Tan China Cellphone Manufacturing Report
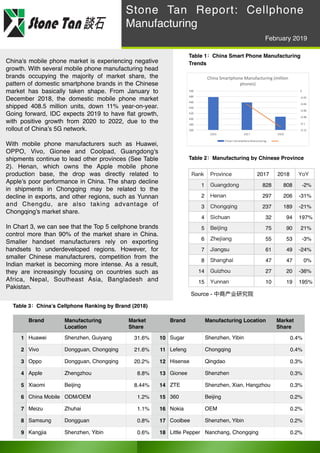
- 1. Table 1:China Smart Phone Manufacturing TrendsChina's mobile phone market is experiencing negative growth. With several mobile phone manufacturing head brands occupying the majority of market share, the pattern of domestic smartphone brands in the Chinese market has basically taken shape. From January to December 2018, the domestic mobile phone market shipped 408.5 million units, down 11% year-on-year. Going forward, IDC expects 2019 to have flat growth, with positive growth from 2020 to 2022, due to the rollout of China’s 5G network. With mobile phone manufacturers such as Huawei, OPPO, Vivo, Gionee and Coolpad, Guangdong's shipments continue to lead other provinces (See Table 2). Henan, which owns the Apple mobile phone production base, the drop was directly related to Apple’s poor performance in China. The sharp decline in shipments in Chongqing may be related to the decline in exports, and other regions, such as Yunnan and Chengdu, are also taking advantage of Chongqing's market share. In Chart 3, we can see that the Top 5 cellphone brands control more than 90% of the market share in China. Smaller handset manufacturers rely on exporting handsets to underdeveloped regions. However, for smaller Chinese manufacturers, competition from the Indian market is becoming more intense. As a result, they are increasingly focusing on countries such as Africa, Nepal, Southeast Asia, Bangladesh and Pakistan. Table 2:Manufacturing by Chinese Province Rank Province 2017 2018 YoY 1 Guangdong 828 808 -2% 2 Henan 297 206 -31% 3 Chongqing 237 189 -21% 4 Sichuan 32 94 197% 5 Beijing 75 90 21% 6 Zhejiang 55 53 -3% 7 Jiangsu 61 49 -24% 8 Shanghai 47 47 0% 14 Guizhou 27 20 -36% 15 Yunnan 10 19 195% Brand Manufacturing Location Market Share 1 Huawei Shenzhen, Guiyang 31.6% 2 Vivo Dongguan, Chongqing 21.6% 3 Oppo Dongguan, Chongqing 20.2% 4 Apple Zhengzhou 8.8% 5 Xiaomi Beijing 8.44% 6 China Mobile ODM/OEM 1.2% 7 Meizu Zhuhai 1.1% 8 Samsung Dongguan 0.8% 9 Kangjia Shenzhen, Yibin 0.6% Brand Manufacturing Location Market Share 10 Sugar Shenzhen, Yibin 0.4% 11 Lefeng Chongqing 0.4% 12 Hisense Qingdao 0.3% 13 Gionee Shenzhen 0.3% 14 ZTE Shenzhen, Xian, Hangzhou 0.3% 15 360 Beijing 0.2% 16 Nokia OEM 0.2% 17 Coolbee Shenzhen, Yibin 0.2% 18 Little Pepper Nanchang, Chongqing 0.2% Source - 中商产业研究院 Table 3:China’s Cellphone Ranking by Brand (2018) -0.12 -0.1 -0.08 -0.06 -0.04 -0.02 0 360 380 400 420 440 460 480 500 2016 2017 2018 China Smartphone Manufacturing (million phones) China's Smartphone Manucturing Stone Tan Report: Cellphone Manufacturing February 2019
- 2. Cellphone Manufacturing in SW China Stone Tan has been covering Southwest China’s cellphone manufacturing industry for the past few years. As noted in Chart 2, a key trend in 2018 was the rise in cell production from Sichuan and Yunnan. It appears that cities such as Yibin and Kunming have copied Chongqing’s approach to attract Shenzhen cellphone manufacturers to move or start operations in their cities. As we noted in previous reports, most cities offer attractive logistic subsidies and equipment financing incentives for these companies. Aside from investments by Oppo and Vivo in Chongqing, and Foxconn’s Guiyang plant (which manufactures for Huawei), most of these cellphone manufacturers will have to develop markets outside of China. This will require 1) developing a strong international sales knowledge of key overseas markets such as India and Africa and 2) Having cost competitive cellphones that can compete on price (as most of these phone companies have low brand recognition). Oppo Chongqing was invested by its parent (Guangdong OPPO) and is expected to be put into operation in 2021. After full production in 2021, it is expected to produce and sell more than 30 million smartphones. In January 2019, Oppo announced that it will build a R&D HQ in Yubei as well. ODM HQ Manufacturing Centers Shipmen t Share Top Customers Wingtech Shanghai Jiaxing 13% Xiaomi,Huawei,Lenovo,Meizu,Asus Huaqin Shanghai Dongguan, Nanchang 22% Huawei, Xiaomi, Meizu, LG Hangzhou Longqi Hangzhou 8% Xiaomi, Lenovo, Huawei Shanghai Wind Shanghai Chongqing 5% Meizu, Lenovo, Huawei Shenzhen Tinno Shenzhen 7% Sugar Other 45% Aside from the trend of consolidation, another trend in China is the rising use of the ODM model within the industry. ODM is currently 23.7% of global phone shipments. Counterpoint Consulting believes that this level will reach 35% as companies expand to newer markets and focus on time to market. The top five global IDH/ODM leaders are all Chinese companies: Huaqin, Wingtech, Longcheer and Wind. It was estimated that China based ODMs alone captured more than 90% share of the global smartphone shipments designed/manufactured by ODMs in 2017. Table 4 shows that the majority of these companies have their HQ in the YRD and Shenzhen areas, although some have established manufacturing presence in other areas of China. Table 4:China’s Key ODM Players for Cellphone Industry (Source - Counterpoint) Table 5: SW China Cellphone Production Map Stone Tan Report: Cellphone Manufacturing February 2019
- 3. Stone Tan Report: Cellphone Manufacturing February 2019 India Share Africa Share 1 Xiaomi 29% Samsung 23% 2 Samsung 22% Chuanyin - Tecno 18% 3 Vivo 10% Chuanyin - Itel 13% 4 Oppo 7% Huawei 7% 5 Chuanyin 5% Chuanyin - Infinix 7% 6 Other 27% Other 32% Chuanyin is becoming a successful case study for many lower end cellphone companies. The company has two factories in China (Huizhou and Chongqing), while also operating factories in India, Bangladesh, and Ethiopia. Its low pricing has allowed it to compete against larger cellphone companies. Table 6: Cellphone Market Comparison (million phones) Table 7: Cellphone Market Share for India and Africa Overseas Market Analysis: India - Overall India mobile phone shipments crossed 330 Million units for the first time ever with smartphones capturing almost 44% of the total volume in 2018. In 2018, the Indian government imposed a 20% tax on fully built mobile phones. It also set a 10% duty on imports of populated printed circuit boards (PCBs), camera modules and connectors. This has resulted in more than 80% of cellphones to be assembled in India, leaving only 20% of the market for Chinese exporters. Africa - In the past five years, mobile phone users in Africa have grown at a rate of 20% per year, becoming the global smartphone sales growth. In 2015, the sales volume of mobile phones in Africa was 60 million units and increased to over 200 million in 2018. The price-point for most African smart phones is still very low. Chuanyin’s average phone was 98 USD while Samsung and Huawei had a price point around 200 USD. Summary - Due to India’s import tariffs, smaller cellphone manufacturers need to figure out which markets to export their products to. Price and cost in the most attractive markets is essential in having success, as shown by Chuayin’s success in Africa (see Table 7). According to the analysis in the African market, the average price of smartphones sold by voice is US$96, while the average selling price of Huawei or Samsung in this market is US$200. In Table 8, we analyze a number of countries which may be suitable for these manufacturers. Other potential market packages include Central Asia, South America and Southeast Asia. Understanding how to open sales channels in these markets and ensuring effective logistics and control costs will be a major challenge for Chinese small handset manufacturers. 0.0 50.0 100.0 150.0 200.0 250.0 300.0 350.0 400.0 450.0 China India Africa Cellphone Market Comparison between China, India, and Africa Smart Phones Non-Smart Phones Table 8: Countries with Population over 30 million and GDP/Capita under 15,000 USD
- 4. Scan our WeChat Code to get future industry analysis and news about 重庆谈⽯融资租赁有限公司,是由“谈⽯中国⾦ 融投资有限公司”与“重庆渝富控股集团有限公 司”共同出资组建。 Stone Tan Financial Leasing Company was jointly invested by both Stone Tan Finance and Investment Company Ltd. and Chongqing Yufu Assets Management (Group) Company Ltd. 主营业务 Key Business Types 直接融资租赁,售后回租,委托租赁,管理咨 询,财务顾问 Direct Leasing, Sales Leaseback, Entrusted Loans, Management Consulting, Financial Advising About Stone Tan In 2010, Stone Tan was established in Chongqing to focus on financing solutions to small and medium sized businesses in Chongqing.The company is currently focused on the financial leasing business throughout China, with presence in Chongqing, Anhui, Sichuan, Jiangsu, and Zhejiang. Scan out Wechat QR Code for more information. Chongqing Office Address: 61 Dongsheng Road 16th Floor Chongqing, China 400023 Tel: +86 023-88197891 Anhui Office Address:B&C 11th floor, No 1 Building, CBD Central Plaza, No 369, ChangJiang Road Middle, HeFei, Anhui, China Phone:+86 551 62851935/936/937 Shanghai Office Address:398 Tianlin Road (Building A, Floor 2) Phone:+86-21 54504666 Hong Kong Office Address:Unit 2104, 21/F, Tower 2, Lippo Centre, 89 Queensway, Central, Hong Kong Phone:+852 27355188