More Related Content
Similar to Bearing Life Factors and Reliability Calculations
Similar to Bearing Life Factors and Reliability Calculations (20)
Bearing Life Factors and Reliability Calculations
- 1. © James K. Simonelli, 1/23/2011 All Rights Reserved Page 1 of 4
Antifriction Bearing Life
Bearing Types
There are 3 types of bearings: Rolling element, bushings, and journal.
Antifriction bearings are commonly taken to refer to rolling element bearings. These bearing
have rolling components, such as ball bearings. Lubrication is used to cool the surfaces, reduce
friction and wear for the portion of sliding contact that occurs, and form a fluid film that distributes
contact stress over a larger area. A hovercraft over water has a similar effect. The air cushion forms
a depression larger than the craft, distributing the load over a larger area.
Bushings have surface contact between sliding components. Materials for the contact surfaces
are chosen to reduce friction and reduce abrasive wear. Common materials are bronzes and
Teflons. Lubricants may also be used to reduce friction and wear.
Journal bearings use a fluid film to separate sliding surfaces. This is called “boundary
lubrication.” The film is an effect similar to a speeding car hitting a rain puddle. The car tire has a
tendency to float on a wedge of water. In a car this is called hydroplaning; in machinery it is called
elasto-hydrodynamic lubrication (EHL). For EHL to be the only lubrication mode, it must generate
a film thickness greater than the surface roughness of the contacting parts. Film thickness is
proportional to the sliding velocity and lubricant viscosity and inversely proportional to the load.
Journal bearings are bushings when starting, unless they have a externally pressurized lubricant
flow. Then depending on operating conditions may partially contact.
Basis for Bearing Life
Industry practice for antifriction bearing life is a theoretical calculation of the cycles for a
percentage of the population to fail from surface fatigue. Regardless of bearing size, failure is
artificially defined as the development of a 0.01 inch2
(6 mm2
) spall1
.
Surface contact stress induces shear stress below the surface (subsurface shear stress2
).
Materials are weakest in shear so failure is below the contact surface. Every rolling element (ex.
Individual ball) in a bearing applies a surface stress each rotation. This cyclic stress causes fatigue
cracks that grow and join until a small piece falls out.
Bearing Reliability
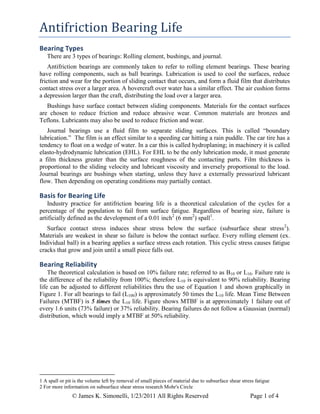
The theoretical calculation is based on 10% failure rate; referred to as B10 or L10. Failure rate is
the difference of the reliability from 100%; therefore L10 is equivalent to 90% reliability. Bearing
life can be adjusted to different reliabilities thru the use of Equation 1 and shown graphically in
Figure 1. For all bearings to fail (L100) is approximately 50 times the L10 life. Mean Time Between
Failures (MTBF) is 5 times the L10 life. Figure shows MTBF is at approximately 1 failure out of
every 1.6 units (73% failure) or 37% reliability. Bearing failures do not follow a Gaussian (normal)
distribution, which would imply a MTBF at 50% reliability.
1 A spall or pit is the volume left by removal of small pieces of material due to subsurface shear stress fatigue
2 For more information on subsurface shear stress research Mohr's Circle
- 2. © James K. Simonelli, 1/23/2011 All Rights Reserved Page 2 of 4
Rnew
aLL
R
a
fnew
f
100
05.0
74.0
100
ln59.4
10
)(ByReliabilit90%atLife
yReliabilitNewatLife
Survivors)ofe(Percentag
PercentageaasyReliabilit
FactorAdjustmentLife
1010
L
L
R
a
new
f
Equation 1 Life Factor
Figure 1 Failures v. Multiple of L10 Bearing Life
For 100% reliability, with respect to fatigue, use
a life adjustment factor of 0.05. The equation is
asymptotic at this value. The Table 1 compares life
and reliabilities.
Catastrophic Failure
The life calculation is independent of the cycle
rate (i.e. rotational speed). Machinery typically
divides by the cycle rate (revolutions per minute)
(Equation 2) to express the result in time. Vehicles
divide by the wheel circumference to express the
answer in distance.
The life calculation predicts the development of a
certain size spall. It is not failure of the bearing’s
ability to support load, which would be a catastrophic
failure. It is a visually noticeable defect that if
inspected would indicate it needs to be replaced. If left
in service, spalls would continue to develop with
deteriorating performance, marked by increasing
noise, heat, and vibration. Catastrophic failure is
generally 2 times longer than the spall area criteria.
Life calculations generally use the maximum system load. But, bearing life is a function of the
mean load not the maximum load. Average system loads are generally around 50% to 80% of the
maximum. Ball bearing life varies inversely as the cube (10
/3 for roller elements) of the applied
load. So the "average" load is the root mean cube (Equation 3),; similar in concept to root mean
square used in many statistical calculations. An 80% average load gives 2 times the life; 50%
average load, the life is 8 times as long (Figure 2). Combining all of the factors to estimate a true
failure in a typical industrial reducer gives 20 times the L10.
0.0
1.0
2.0
3.0
4.0
5.0
6.0
7.0
8.0
9.0
1 10 100 1,000
MultipleofL10BearingLife
1 in X Failures
Mean Time
Between Failure
L10= 90%
Reliability
Reliability
MTBF 90% 99% 100%
Life
5,000 1,000 200 50
25,000 5,000 1,000 300
50,000 10,000 2,100 500
250,000 50,000 10,500 2,500
500,000 100,000 21,000 5,000
Table 1 Life at Various Reliabilities
MinutepersRevolution
loadorForceCubeMeanRoot
Roller
3
10Ball,3Factor;Bearing
RatingDynamicBearing
60
61
10
rmc
P
x
rmc
P
F
x
C
E
F
C
L
Equation 2 Life Equation
- 3. © James K. Simonelli, 1/23/2011 All Rights Reserved Page 3 of 4
loadatcyclesofNumber
loadorForce
3
3...33
1
2211
N
F
N
NFNFNF
rmc
F n
x
nn
Equation 3 Root Mean Cube Load
Figure 2 Mean Load versus Life Factor
Actual Bearing Life
The previous information is based on fatigue. Experience shows less than 10% of failures are
due to fatigue. Other factors that affect bearing life are design (geometry, lubrication installation
techniques, and environment.
Failure can still occur from unknown factors even if everything within the manufacturer’s
control is correct. Environment; temperature, electrical, dirt and moisture, Unknowns can be as
diverse as shock loading from machine jams or hitting the reducer with a forklift. The most
common cause of bearing failure is lack of proper lubrication maintenance. If you want long life
change the oil.
When L10 results indicate bearing life of multiple years the likelihood of an unknown factor
causing failure increases. In these cases the excessive life should be taken as higher reliability not
that the bearing will actually last that long in service.
Reliability of Bearing Systems
All of the calculations described so far discuss individual bearings. But, machines have more
than one bearing. Combining bearing reliability for multiple bearings into a single value can be
done by manipulating Equation 1 to determine the reliability of each bearing at a selected target life
(Equation 4). Then multiply the reliabilities together for the reliability of the system.
35.1
95.4
05.0
10
74.0
1
35.1
fa
T
f
T
eR
a
L
L
LifeTarget
TargetatyReliabilit
T
T
L
R
Equation 4 Reworked
Reliability Equation
Table 2 Example of System Reliability
Initial Calculations Target Calculations
Reliability Life Reliability Life
0.90 3,727,983 0.99 1,000,000
0.90 1,309,453 0.93 1,000,000
0.90 1,714,190 0.95 1,000,000
0.90 3,509,525 0.98 1,000,000
0.90 1,300,268 0.93 1,000,000
0.90 2,949,775 0.98 1,000,000
System 0.78 1,000,000
0
10
20
30
40
50
60
30% 40% 50% 60% 70% 80%
LifeFactor
RMC Load/Peak Load
Ball
Roller
- 4. © James K. Simonelli, 1/23/2011 All Rights Reserved Page 4 of 4
About the author:
James K. Simonelli is a Licensed Professional Engineer with 30 years experience designing and
troubleshooting machine automation, heavy duty equipment and industrial products. He has a
broad background with department head roles in engineering, quality and business development
in companies varying from startups, turnarounds to Fortune 100 corporations. Mr. Simonelli has
served on committees developing industrial standards for the American Gear Manufacturers
Association and the Hydraulics Institute.
Mobile: 404-702-3050; Email: j.simonelli@att.net; Skype: jim.simonelli; Linkedin: www.linkedin.com/in/jsimonelli