SlideShare a Scribd company logo
1 of 5
Download to read offline
Confidential 8/25/2017 Page 1
22
23
24
25
26
27
28
29
30
31
32
33
34
35
36
37
38
39
40
41
42
43
44
45
46
47
48
49
50
51
52
53
54
55
56
57
58
59
60
61
62
63
64
65
66
67
68
69
70
AD AE AF AG AJ AP AQ AR AS AT AU AW AY BE BF BH BJ BK BN BQ BR BU BX BY CB CE CF CI CL CM CN CO CP CQ
EVAL % OF PLAN: 99% 2016 2015 3 Year 5 Year
11,070,170.65$ 9,260,798.00 =5500 -30% -27% -17% -21%
3% 20 flows 2016 990,843.75$ 100% 4,107.41 990,843.75$ 50% (4,924.64) 8,688,351 (8,462.53) 7,154,108 -$3,566.44 5,010,906 -$214.32 3,690,328 $2,460.75 2016 2015 3 Year 5 Year
1 62.50% 32 9% 10,157,061 (8,210) 9,166,217.00 495,421.88 (289,929) 8,688,351 -$55,414.53 $7,154,107.54 -$216,747.29 5,010,906 -$56,862.22 $3,690,327.55 -$54,969.83 -63% -31% -38% -22%
prospectus benchmark
if manager beat
benchmark, years
to determine
persistent skill?
any manager
skill exhibited
since 1996 to
be <40 yrs?
+ or - bench since
1996?
Index or
passive
fund name ticker trust assets 2017 DEITZ trust assets 2017 DEITZ 2016 return % of level 1 2017 lag 2017 lag cost trust assets 2016 DEITZ 50% of flows 2016 lag 2016 lag cost
trust assets beg 2015
dietz from 5500 2015 lag
2015 lag cost
from 5500
trust assets beg
2014 dietz from 5500 2014 lag 2014 lag cost from 5500
trust assets beg
2013 dietz from
5500 2013 lag
2013 lag cost from
5500
trust assets beg 2012
dietz from 5500 2012 lag
2012 lag cost from
5500 fd v bm 2016 fd v bm 2015 fd v bm 3y fd v bm 5y fd v bm 10y
S&P 500 TR USD 31 31 2.70% No
American Funds Growth Fund of Amer
R6 RGAGX 1,533,814 1,533,814.17$ 118,710.70 14% 3.17 1,277,057.00 69,023.24 (3.141) (40,111.49) 1,210,479.63 4.31 996,725.60 (4.06) (40,430.49) 698,130.17 1.90 514,144.34 4.98 (3.14) 4.31 (0.84) 0.76 0.27
Russell 1000 Value TR USD no skill -0.23% No Invesco Equity and Income Y ACETX 1,420,344 1,420,344.44$ 178,652.66 12% (0.38) (5,361.60) 1,120,562.00 60,564.89 (2.215) (24,818.66) 1,062,143.25 1.73 874,583.38 (4.11) (35,964.57) 612,578.88 (7.26) (44,447.04) 451,139.31 (4.35) (19,604.00) (2.21) 1.73 (1.37) (2.99) 0.82
MSCI EM NR USD 13 13 4.14% No Oppenheimer Developing Markets Y ODVYX 978,164 978,163.67$ 62,414.29 9% 0.30 826,416.00 44,666.69 (4.022) (33,236.33) 783,332.09 1.08 645,006.43 (2.37) (15,257.12) 451,777.75 11.28 332,715.86 3.06 (4.02) 1.08 (1.57) 1.77 2.64
S&P 500 TR USD 54 no skill 1.50% No American Funds Fundamental Invs R6 RFNGX 793,631 793,630.94$ 86,611.65 7% 0.75 638,048.00 34,485.65 0.918 604,784.36 2.32 497,987.77 (4.42) (22,018.32) 348,802.41 (0.44) (1,551.16) 256,878.72 1.53 0.92 2.32 (0.32) 0.02 0.46
Russell Mid Cap Value TR USD no skill -1.88% No Vanguard Selected Value Inv VASVX 789,072 789,072.36$ 106,146.43 7% 2.92 616,305.00 33,310.47 (3.658) (22,541.62) 584,174.90 0.98 481,017.66 (8.39) (40,358.96) 336,916.14 8.58 248,124.97 (3.26) (8,087.68) (3.66) 0.98 (3.47) (1.43) (0.10)
MSCI ACWI Ex USA NR USD 48 no skill 1.94% No American Funds Europacific Growth R6 RERGX 597,606 597,606.40$ 5,699.58 6% 3.68 534,165.00 28,870.91 (3.483) (18,604.03) 506,317.14 5.18 416,908.51 1.57 292,012.58 5.29 215,055.33 2.81 (3.48) 5.18 1.18 2.22 1.93
Russell 1000 Value TR USD no skill -0.38% No Vanguard Windsor™ II Inv VWNFX 505,483 505,482.62$ 57,202.95 4% 3.13 404,549.00 21,865.34 (3.926) (15,880.88) 383,458.47 0.61 315,744.99 (2.29) (7,242.36) 221,155.25 (1.84) (4,065.38) 162,871.81 (0.79) (1,291.97) (3.93) 0.61 (1.73) (1.57) (0.04)
Russell 2000 TR USD 76 no skill 2.93% No Neuberger Berman Genesis Instl NBGIX 498,594 498,594.29$ 74,111.01 4% 0.23 383,074.00 20,704.64 (2.954) (11,314.58) 363,103.03 4.82 298,984.04 (4.94) (14,773.18) 209,415.49 (1.59) (3,339.38) 154,225.95 (6.25) (9,642.58) (2.95) 4.82 (0.84) (2.05) 2.01
Russell 2000 Growth TR USD 63 no skill 2.59% No Lord Abbett Developing Growth I LADYX 373,410 373,410.19$ (9,007.50) 4% 2.92 345,112.00 18,652.85 (13.794) (47,605.73) 327,120.12 (7.26) (23,743.73) 269,355.22 (2.05) (5,510.47) 188,662.76 14.45 138,942.41 (3.86) (5,361.87) (13.79) (7.26) (7.70) (3.72) 0.97
Russell 1000 Value TR USD 395 no skill 0.47% No Invesco Growth and Income Y ACGMX 424,664 424,663.64$ 68,170.99 4% 0.07 321,716.00 17,388.32 2.763 304,943.84 0.93 251,094.96 (3.03) (7,619.48) 175,872.84 1.64 129,523.16 (2.60) (3,362.69) 2.76 0.93 0.21 (0.10) 0.99
BBgBarc US Agg Bond TR USD 24 24 0.96% No PIMCO Total Return Instl PTTRX 331,595 331,594.75$ 8,002.62 3% 1.19 292,025.00 15,783.56 (0.048) 276,800.73 0.18 227,921.54 (1.27) (2,899.82) 159,641.63 0.10 117,569.54 6.15 (0.05) 0.18 (0.37) 0.98 1.28
Morningstar Lifetime Mod 2035 TR USD no skill -1.32% No Vanguard Target Retirement 2035 Inv VTTHX 296,187 296,187.38$ 21,587.56 3% 1.02 247,812.00 13,393.91 (1.802) (4,466.12) 234,892.71 1.32 193,413.89 1.44 135,471.66 0.79 99,769.34 (0.20) (1.80) 1.32 0.36 0.33 (0.31)
Russell Mid Cap Growth TR USD 137 no skill 1.68% No Morgan Stanley Inst Mid Cap Growth I MPEGX 236,055 236,054.72$ (34,490.57) 3% 15.98 244,153.00 13,196.15 (20.731) (50,614.84) 231,424.46 (5.66) (13,093.86) 190,558.09 (10.58) (20,155.89) 133,471.39 2.60 98,296.23 (6.31) (6,204.59) (20.73) (5.66) (12.40) (8.92) (2.96)
Morningstar Lifetime Mod 2045 TR USD no skill -1.11% No Vanguard Target Retirement 2045 Inv VTIVX 266,942 266,941.53$ 20,771.06 2% 1.19 222,156.00 12,007.24 (1.969) (4,374.46) 210,574.24 1.45 173,389.73 1.91 121,446.27 1.30 89,440.21 (0.26) (233.66) (1.97) 1.45 0.52 0.51 (0.14)
S&P Completion TR USD prudent 0.04% Yes
Vanguard Extended Market Index
Admiral VEXAX 270,606 270,605.63$ 35,998.15 2% 0.02 211,721.00 11,443.24 0.177 200,683.26 0.08 165,245.36 0.06 115,741.75 0.13 85,239.07 0.03 0.18 0.08 0.10 0.09 0.12
Citi WGBI USD 19 19 2.83% No Templeton Global Bond A TPINX 195,926 195,925.76$ 10,948.86 2% (1.25) (2,456.62) 166,932.00 9,022.45 4.622 158,229.26 (0.68) (1,078.17) 130,288.15 2.05 91,256.90 6.22 67,206.98 14.16 4.62 (0.68) 1.93 5.10 3.55
Morningstar Lifetime Mod 2050 TR USD no skill -1.17% No Vanguard Target Retirement 2050 Inv VFIFX 194,035 194,035.29$ 15,067.59 2% 1.06 161,509.00 8,729.35 (2.041) (3,295.93) 153,088.98 1.62 126,055.58 2.18 88,292.30 1.51 65,023.67 (0.35) (230.22) (2.04) 1.62 0.65 0.61 (0.08)
MSCI EAFE NR USD 18 18 2.74% No Dodge & Cox International Stock DODFX 179,102 179,101.82$ 13,051.21 2% 0.71 149,852.00 8,099.30 7.263 142,039.70 (10.54) (14,970.69) 116,957.45 4.98 81,919.76 3.54 60,330.56 3.71 7.26 (10.54) 0.27 1.45 1.36
Morningstar Lifetime Mod 2020 TR USD no skill -1.64% No Vanguard Target Retirement 2020 Inv VTWNX 168,692 168,692.42$ 10,459.44 2% 1.21 142,797.00 7,717.99 (0.712) (1,016.80) 135,352.50 1.20 111,451.11 1.24 78,062.99 2.87 57,490.21 (0.18) (0.71) 1.20 0.60 0.88 (0.19)
Morningstar Lifetime Mod 2055 TR USD no skill -1.25% No Vanguard Target Retirement 2055 Inv VFFVX 164,393 164,392.99$ 12,799.73 1% 0.95 136,805.00 7,394.13 (2.028) (2,774.37) 129,672.88 1.62 106,774.44 2.45 74,787.34 1.84 55,077.82 (0.42) (228.68) (2.03) 1.62 0.74 0.72 -
Morningstar Lifetime Mod 2040 TR USD no skill -1.18% No Vanguard Target Retirement 2040 Inv VFORX 148,946 148,945.88$ 11,424.35 1% 1.18 124,106.00 6,707.76 (1.876) (2,328.57) 117,635.93 1.25 96,863.04 1.63 67,845.17 1.32 49,965.19 (0.15) (1.88) 1.25 0.38 0.45 (0.18)
BBgBarc US Credit A+ TR USD 21 21 2.10% No Vanguard Wellesley® Income Inv VWINX 116,792 116,792.42$ 8,336.29 1% 1.44 97,876.00 5,290.07 4.136 92,773.39 0.59 76,390.89 1.08 53,505.98 11.18 39,404.97 1.84 4.14 0.59 1.92 3.79 1.83
Morningstar Lifetime Mod 2025 TR USD no skill -1.81% No Vanguard Target Retirement 2025 Inv VTTVX 102,420 102,420.02$ 6,804.52 1% 1.24 86,288.00 4,663.75 (0.909) (784.13) 81,789.51 1.21 67,346.61 1.13 47,171.16 1.87 34,739.63 (0.37) (129.68) (0.91) 1.21 0.50 0.59 (0.22)
Morningstar Lifetime Mod 2030 TR USD no skill -1.42% No Vanguard Target Retirement 2030 Inv VTHRX 98,285 98,285.16$ 6,830.57 1% 1.08 82,533.00 4,460.80 (1.407) (1,160.99) 78,230.27 1.27 64,415.88 1.16 45,118.41 0.85 33,227.86 (0.43) (144.52) (1.41) 1.27 0.38 0.31 (0.33)
BofAML US Treasury Current 2 Yr TR
USD 16 16 0.43% No Goldman Sachs Short Dur Govt Instl GSTGX 88,076 88,075.52$ 1,177.42 1% 0.35 78,421.00 4,238.55 0.760 74,332.64 (0.26) (195.66) 61,206.52 (0.28) (168.94) 42,870.50 0.02 31,572.37 0.73 0.76 (0.26) 0.07 0.19 0.42
BBgBarc US Agg Bond TR USD 178 no skill 1.30% No Vanguard Target Retirement 2015 Inv VTXVX 66,497 66,497.10$ 3,680.17 1% 3.52 56,689.00 3,063.97 3.511 53,733.61 (1.01) (544.86) 44,244.99 0.60 30,990.24 15.02 22,823.04 7.15 3.51 (1.01) 1.01 4.99 0.51
Russell 3000 TR USD no skill -1.15% No Nationwide Inv Dest Mod Agrsv R6 GMIAX 66,128 66,128.12$ 5,599.41 1% (0.59) (391.72) 54,624.00 2,952.35 (3.010) (1,644.15) 51,776.26 (2.34) (1,210.42) 42,633.29 (7.89) (3,365.56) 29,861.36 (11.40) (3,404.87) 21,991.67 (2.04) (447.70) (3.01) (2.34) (4.37) (5.16) (2.24)
Morningstar Lifetime Mod 2060 TR USD no skill -1.04% No Vanguard Target Retirement 2060 Inv VTTSX 47,494 47,493.99$ 3,685.36 0% 0.90 39,535.00 2,136.81 (2.033) (803.89) 37,473.90 1.80 30,856.53 2.63 21,612.64 2.17 15,916.83 - (2.03) 1.80 0.86 - -
MSCI ACWI Ex USA NR USD 44 no skill 2.61% No Oppenheimer International Growth Y OIGYX 42,297 42,297.23$ (844.32) 0% 1.65 38,933.00 2,104.28 (6.553) (2,551.11) 36,903.29 9.10 30,386.68 (3.12) (948.68) 21,283.55 10.17 15,674.46 5.27 (6.55) 9.10 (0.19) 2.61 2.59
BBgBarc US Agg Bond TR USD 1,527 no skill 0.37% No Vanguard Target Retirement 2010 Inv VTENX 36,975 36,974.73$ 1,750.53 0% 2.07 31,788.00 1,718.10 2.577 30,130.78 (0.75) (226.53) 24,810.10 (0.04) 17,377.58 11.12 12,797.88 5.91 2.58 (0.75) 0.58 3.74 0.26
BBgBarc US Treasury US TIPS TR USD 73 no skill 0.51% No PIMCO Real Return Instl PRRIX 26,327 26,327.21$ 1,204.42 0% 0.72 22,672.00 1,225.39 0.357 21,490.03 (1.31) (282.30) 17,695.19 (0.22) 12,394.13 (0.44) (54.40) 9,127.77 2.27 0.36 (1.31) (0.41) 0.08 0.24
BBgBarc US Agg Bond TR USD 226 no skill 0.62% No Vanguard Target Retirement Income Inv VTINX 11,618 11,618.24$ 552.78 0% 1.99 9,986.00 539.73 2.604 9,465.40 (0.72) (68.33) 7,793.94 (0.43) (33.47) 5,459.06 7.89 4,020.37 4.01 2.60 (0.72) 0.47 2.67 0.54
#N/A #N/A #N/A #VALUE! #VALUE! 0% - - - - - -
# funds
Because fund managers
underperform 90% of the time the
calculation to the right is necessary
to determine when the manager
adds value and whether it is based
on skill or luck. A t-statistic of 2
ensures a 95% confidence level.
%
Index
Calc PlanGrader review: ABC 401k Plan
bmck31patent pending PlanGrader for Feeney Brothers Excavation Corp
Prepared from IRS Forms 5500 filings
by Rick Canipe, EA, QKA, MBA; IRS Enrolled Agent 77840; verify
at epp@irs.gov or 855.472.5540`
www.Fix401k.com
www.MiraCenter.com
Data from Morningstar.com
#VALUE!
=COUNTIF(R[1
0
0
0
99%
TOTAL PAID OUT
$432,523 $12,613 $95,420 $141,393 ? ? $ 681,949
Distributions
2012
2013 2014 2015 2016 2017Q2
-$8,210 -$682,132-$54,970 -$56,862 -$216,747 -$55,415 -$289,929
ABC 401k Plan
Federal regulation 2550.408b-2 requires reviewing providers to determine they bring value and are "necessary." Federal regulation 2550.404a-5 requires
disclosures to investors so they can evaluate performance versus benchmarks. This document was produced to aid in these efforts.
"...emphasizes a duty to diversify, the avoidance of unjustified costs, and the
importance of evaluating the portfolio as a whole…"
77% In 2016, what percent of the evaluated
trust was invested in lagging funds?
Supreme Court May 18, 2015 Ruling
No In 2016, were >50% of assets invested in
passive institutional shares?
The Third Restatement of Trusts
Prudent Investor Rule Adherence
“The greater the trustee’s departure from one of the valid passive strategies, the
greater is likely to be the burden of justification and also of continuous monitoring.”
$ Lag 2012 2013 2014 2015 2016 2017Q2 TOTAL $ LAG
"Under trust law, a trustee has a continuing duty to monitor trust investments and
remove imprudent ones."
38% What % of the investment menu met or
beat their benchmarks in 2016?
Values from www.efast.dol.gov--also review and refer to your plan's annual 29 CFR 2550.404a-5 notice % of Plan Assets Reviewed:
-63%
-31%
-38%
-22%
-70%
-60%
-50%
-40%
-30%
-20%
-10%
0%
2016 2015 3 YEAR 5 YEAR
% of Funds Lagging Benchmarks
(888)PlanLag www.FundLag.com
AVERAGE %
COST/YR
+/- BENCHMARKS
2014-2016
-0.40%
-0.71%
Participants' Investment Cost
v. Return Comparison
Prepared using this plan's most recent public
IRS/DOL Forms 5500 at www.dol.gov/efast
Presented __________________________________
by R. Canipe, J. Holland or approved advisor
Prepared from IRS Forms 5500 filings
by Rick Canipe, EA, QKA, MBA; IRS Enrolled Agent 77840; verify
at epp@irs.gov or 855.472.5540`
www.Fix401k.com
www.MiraCenter.com
Data from Morningstar.com
% large US
mgrs beat
benchmark
% mid US
mgrs beat
benchmark
% small US
mgrs beat
benchmark
8% 5% 7%
% of this plan's
active managers
demonstrating skill
1
23%
1
the % of managers' whose performance beat benchmarks (with a
<40 year observation period (working life)) Did you know (since 2001)?2
ABC 401k Plan
Due Diligence--facts for this plan's fiduciary investment "experts" under ERISA
SEC Rule 156 requires mutual fund companies to tell investors NOT to base their
expectations of future performance on past performance. Why? Because past
performance often does not matter to help prove a manager is good.
One of the key measurements of successful active management lies in the ability of a
manager to deliver above-average returns consistently.to differentiate a manager’s luck
from skill. According to the S&P Dow Jones' Persistence Scorecard, few funds can
consistently stay at the top. Out of 568 U.S. stock funds that were in the top quartile as
of March 2015, only 1.94% managed to stay in the top quartile at the end of March 2017
(2 years). Also, bad performing funds disappear at a significant rate. When managers’
performance against the prospectus benchmarks is poor, fund companies often close
these funds so their poor performance does not taint their overall firm's ratings. Over the
15-year period ending 12/31/2016 the percent (%) of funds that were merged or
liquidated were:
• 58% of U.S. equity funds
• 52% of global/international equity funds
• 49% of fixed income funds were either merged or liquidated.
2
https://us.spindices.com/documents/spiva/spiva-us-year-end-2016.pdf
2
https://us.spindices.com/documents/spiva/persistence-scorecard-june-2017.pdf
0
4
2
1
11
0 2 4 6 8 10 12
<10 years
>10, <20
>20, <30
>30, <40
>40 years
# FUNDS
MONITORINGYEARS
Skilled Managers' observation years
Prepared using this plan's most recent public
IRS/DOL Forms 5500 at www.dol.gov/efast
Presented __________________________________
by R. Canipe, J. Holland or approved advisor
Prepared from IRS Forms 5500 filings
by Rick Canipe, EA, MBA
IRS Enrolled Agent 77840; to verify the status,
email epp@irs.gov or call 855.472.5540.
www.Fix401k.com
www.MiraCenter.com
Data from Morningstar.com
99%
Prudent Investor Rule Adherence
“The greater the trustee’s departure from one of the valid passive strategies, the
greater is likely to be the burden of justification and also of continuous monitoring.”
Federal regulation 2550.408b-2 requires reviewing providers to determine they bring value and are "necessary." Federal regulation 2550.404a-5 requires
disclosures to investors so they can evaluate performance versus benchmarks. This document was produced to aid in these efforts.
ABC 401k PlanAmerican Law Institute Prudent Investor Rule
"...emphasizes a duty to diversify, the avoidance of unjustified costs, and the
importance of evaluating the portfolio as a whole…"
30% In 2016, what percent of the evaluated
trust was invested in lagging funds?
Supreme Court May 18, 2015 Ruling
Yes In 2016, were >50% of assets invested in
passive institutional shares?
The Third Restatement of Trusts
$ Lag 2012 2013 2014 2015 2016 2017Q2 TOTAL $ LAG
"Under trust law, a trustee has a continuing duty to monitor trust investments and
remove imprudent ones."
70% What % of the investment menu met or
beat their benchmarks in 2016?
Values from www.efast.dol.gov--also review and refer to your plan's annual 29 CFR 2550.404a-5 notice % of Plan Assets Reviewed:
$4,107 -$10,600$2,461 -$214 -$3,566 -$8,463 -$4,925
TOTAL PAID OUT
$432,523 $12,613 $95,420 $141,393 ? ? $ 681,949
Distributions
2012
2013 2014 2015 2016 2017Q2
-30%
-27%
-17%
-21%
-35%
-30%
-25%
-20%
-15%
-10%
-5%
0%
2016 2015 3 YEAR 5 YEAR
% of Funds Lagging Benchmarks
(888)PlanLag www.FundLag.com
AVERAGE %
COST/YR
+/- BENCHMARKS
2014-2016
-0.17%
-0.14%
Participants' Investment Cost v.
Return Comparison
Prepared using this plan's most recent public
IRS/DOL Forms 5500 at www.dol.gov/efast
Presented __________________________________
by R. Canipe, J. Holland or approved advisor
Prepared from IRS Forms 5500 filings
by Rick Canipe, EA, MBA
IRS Enrolled Agent 77840; to verify the status,
email epp@irs.gov or call 855.472.5540.
www.Fix401k.com
www.MiraCenter.com
Data from Morningstar.com
Prepared using this plan's most recent public
IRS/DOL Forms 5500 at www.dol.gov/efast
Presented __________________________________
by R. Canipe, J. Holland or approved advisor

More Related Content

Similar to Plan Grader

The 3 Basics - What a Company Needs
The 3 Basics - What a Company NeedsThe 3 Basics - What a Company Needs
The 3 Basics - What a Company NeedsBill Sims
 
Bnm analisis financiero comparativo - bnm vs sistema bca comercial nov 2000
Bnm   analisis financiero comparativo - bnm vs sistema bca comercial nov 2000Bnm   analisis financiero comparativo - bnm vs sistema bca comercial nov 2000
Bnm analisis financiero comparativo - bnm vs sistema bca comercial nov 2000gonzaloromani
 
Fm assignment-update-final
Fm assignment-update-finalFm assignment-update-final
Fm assignment-update-finalMoon Leong
 
WRI Operating Statement Detail
WRI Operating Statement DetailWRI Operating Statement Detail
WRI Operating Statement DetailScott Pickering
 
Findings analysis & conclusion
Findings analysis & conclusionFindings analysis & conclusion
Findings analysis & conclusionAshish Aggarwal
 
Abc inc. plan grader sample pg
Abc inc. plan grader   sample pgAbc inc. plan grader   sample pg
Abc inc. plan grader sample pgJames Holland
 
Equity Valuation - Amara Raja Batteries
Equity Valuation - Amara Raja BatteriesEquity Valuation - Amara Raja Batteries
Equity Valuation - Amara Raja BatteriesAbbas Badami
 
Valuation Of ASHOK LEYLAND
Valuation Of ASHOK LEYLANDValuation Of ASHOK LEYLAND
Valuation Of ASHOK LEYLANDAakash Singh
 
111647298 heritage-dolls-case-study-analysis-calc
111647298 heritage-dolls-case-study-analysis-calc111647298 heritage-dolls-case-study-analysis-calc
111647298 heritage-dolls-case-study-analysis-calcFaheem Mukhtar
 
Automated Trading Algorithm
Automated Trading AlgorithmAutomated Trading Algorithm
Automated Trading AlgorithmPiyush Chaudhry
 
Presentación Dunas Capital en Valencia (9 de marzo)
Presentación Dunas Capital en Valencia (9 de marzo) Presentación Dunas Capital en Valencia (9 de marzo)
Presentación Dunas Capital en Valencia (9 de marzo) Rankia
 
Price-weighted vs Mkt Cap-weighted data slide
Price-weighted vs Mkt Cap-weighted data slidePrice-weighted vs Mkt Cap-weighted data slide
Price-weighted vs Mkt Cap-weighted data slideMatt Underwood, CFA, CAIA
 
Sales comperison.pptx
Sales comperison.pptxSales comperison.pptx
Sales comperison.pptxEliusPathan
 
SPX (1990-2012) - Long Straddle, Strangle & Deep OTM
SPX (1990-2012) - Long Straddle, Strangle & Deep OTMSPX (1990-2012) - Long Straddle, Strangle & Deep OTM
SPX (1990-2012) - Long Straddle, Strangle & Deep OTMStefan Bolta
 
J J FOAM MODERANISATION
J J FOAM MODERANISATIONJ J FOAM MODERANISATION
J J FOAM MODERANISATIONPawan Gupta
 
[ETHCon Korea 2019] Ahn sangsun 안상선
[ETHCon Korea 2019] Ahn sangsun 안상선[ETHCon Korea 2019] Ahn sangsun 안상선
[ETHCon Korea 2019] Ahn sangsun 안상선ethconkr
 

Similar to Plan Grader (20)

Excel Model for Banking
Excel Model for Banking Excel Model for Banking
Excel Model for Banking
 
The 3 Basics - What a Company Needs
The 3 Basics - What a Company NeedsThe 3 Basics - What a Company Needs
The 3 Basics - What a Company Needs
 
Bnm analisis financiero comparativo - bnm vs sistema bca comercial nov 2000
Bnm   analisis financiero comparativo - bnm vs sistema bca comercial nov 2000Bnm   analisis financiero comparativo - bnm vs sistema bca comercial nov 2000
Bnm analisis financiero comparativo - bnm vs sistema bca comercial nov 2000
 
AZN/ALXN
AZN/ALXNAZN/ALXN
AZN/ALXN
 
Fm assignment-update-final
Fm assignment-update-finalFm assignment-update-final
Fm assignment-update-final
 
WRI Operating Statement Detail
WRI Operating Statement DetailWRI Operating Statement Detail
WRI Operating Statement Detail
 
Findings analysis & conclusion
Findings analysis & conclusionFindings analysis & conclusion
Findings analysis & conclusion
 
Abc inc. plan grader sample pg
Abc inc. plan grader   sample pgAbc inc. plan grader   sample pg
Abc inc. plan grader sample pg
 
Equity Valuation - Amara Raja Batteries
Equity Valuation - Amara Raja BatteriesEquity Valuation - Amara Raja Batteries
Equity Valuation - Amara Raja Batteries
 
Hul p&l account
Hul p&l accountHul p&l account
Hul p&l account
 
Valuation Of ASHOK LEYLAND
Valuation Of ASHOK LEYLANDValuation Of ASHOK LEYLAND
Valuation Of ASHOK LEYLAND
 
111647298 heritage-dolls-case-study-analysis-calc
111647298 heritage-dolls-case-study-analysis-calc111647298 heritage-dolls-case-study-analysis-calc
111647298 heritage-dolls-case-study-analysis-calc
 
Automated Trading Algorithm
Automated Trading AlgorithmAutomated Trading Algorithm
Automated Trading Algorithm
 
Presentación Dunas Capital en Valencia (9 de marzo)
Presentación Dunas Capital en Valencia (9 de marzo) Presentación Dunas Capital en Valencia (9 de marzo)
Presentación Dunas Capital en Valencia (9 de marzo)
 
Price-weighted vs Mkt Cap-weighted data slide
Price-weighted vs Mkt Cap-weighted data slidePrice-weighted vs Mkt Cap-weighted data slide
Price-weighted vs Mkt Cap-weighted data slide
 
Sales comperison.pptx
Sales comperison.pptxSales comperison.pptx
Sales comperison.pptx
 
SPX (1990-2012) - Long Straddle, Strangle & Deep OTM
SPX (1990-2012) - Long Straddle, Strangle & Deep OTMSPX (1990-2012) - Long Straddle, Strangle & Deep OTM
SPX (1990-2012) - Long Straddle, Strangle & Deep OTM
 
18 dec 2019
18 dec 201918 dec 2019
18 dec 2019
 
J J FOAM MODERANISATION
J J FOAM MODERANISATIONJ J FOAM MODERANISATION
J J FOAM MODERANISATION
 
[ETHCon Korea 2019] Ahn sangsun 안상선
[ETHCon Korea 2019] Ahn sangsun 안상선[ETHCon Korea 2019] Ahn sangsun 안상선
[ETHCon Korea 2019] Ahn sangsun 안상선
 

Recently uploaded

VVIP Pune Call Girls Katraj (7001035870) Pune Escorts Nearby with Complete Sa...
VVIP Pune Call Girls Katraj (7001035870) Pune Escorts Nearby with Complete Sa...VVIP Pune Call Girls Katraj (7001035870) Pune Escorts Nearby with Complete Sa...
VVIP Pune Call Girls Katraj (7001035870) Pune Escorts Nearby with Complete Sa...Call Girls in Nagpur High Profile
 
Q3 2024 Earnings Conference Call and Webcast Slides
Q3 2024 Earnings Conference Call and Webcast SlidesQ3 2024 Earnings Conference Call and Webcast Slides
Q3 2024 Earnings Conference Call and Webcast SlidesMarketing847413
 
Call Girls In Yusuf Sarai Women Seeking Men 9654467111
Call Girls In Yusuf Sarai Women Seeking Men 9654467111Call Girls In Yusuf Sarai Women Seeking Men 9654467111
Call Girls In Yusuf Sarai Women Seeking Men 9654467111Sapana Sha
 
How Automation is Driving Efficiency Through the Last Mile of Reporting
How Automation is Driving Efficiency Through the Last Mile of ReportingHow Automation is Driving Efficiency Through the Last Mile of Reporting
How Automation is Driving Efficiency Through the Last Mile of ReportingAggregage
 
VIP Kolkata Call Girl Serampore 👉 8250192130 Available With Room
VIP Kolkata Call Girl Serampore 👉 8250192130  Available With RoomVIP Kolkata Call Girl Serampore 👉 8250192130  Available With Room
VIP Kolkata Call Girl Serampore 👉 8250192130 Available With Roomdivyansh0kumar0
 
Instant Issue Debit Cards - High School Spirit
Instant Issue Debit Cards - High School SpiritInstant Issue Debit Cards - High School Spirit
Instant Issue Debit Cards - High School Spiritegoetzinger
 
Call US 📞 9892124323 ✅ Kurla Call Girls In Kurla ( Mumbai ) secure service
Call US 📞 9892124323 ✅ Kurla Call Girls In Kurla ( Mumbai ) secure serviceCall US 📞 9892124323 ✅ Kurla Call Girls In Kurla ( Mumbai ) secure service
Call US 📞 9892124323 ✅ Kurla Call Girls In Kurla ( Mumbai ) secure servicePooja Nehwal
 
New dynamic economic model with a digital footprint | European Business Review
New dynamic economic model with a digital footprint | European Business ReviewNew dynamic economic model with a digital footprint | European Business Review
New dynamic economic model with a digital footprint | European Business ReviewAntonis Zairis
 
VIP Call Girls Service Dilsukhnagar Hyderabad Call +91-8250192130
VIP Call Girls Service Dilsukhnagar Hyderabad Call +91-8250192130VIP Call Girls Service Dilsukhnagar Hyderabad Call +91-8250192130
VIP Call Girls Service Dilsukhnagar Hyderabad Call +91-8250192130Suhani Kapoor
 
call girls in Nand Nagri (DELHI) 🔝 >༒9953330565🔝 genuine Escort Service 🔝✔️✔️
call girls in  Nand Nagri (DELHI) 🔝 >༒9953330565🔝 genuine Escort Service 🔝✔️✔️call girls in  Nand Nagri (DELHI) 🔝 >༒9953330565🔝 genuine Escort Service 🔝✔️✔️
call girls in Nand Nagri (DELHI) 🔝 >༒9953330565🔝 genuine Escort Service 🔝✔️✔️9953056974 Low Rate Call Girls In Saket, Delhi NCR
 
Call Girls Service Nagpur Maya Call 7001035870 Meet With Nagpur Escorts
Call Girls Service Nagpur Maya Call 7001035870 Meet With Nagpur EscortsCall Girls Service Nagpur Maya Call 7001035870 Meet With Nagpur Escorts
Call Girls Service Nagpur Maya Call 7001035870 Meet With Nagpur Escortsranjana rawat
 
VIP Call Girls Thane Sia 8617697112 Independent Escort Service Thane
VIP Call Girls Thane Sia 8617697112 Independent Escort Service ThaneVIP Call Girls Thane Sia 8617697112 Independent Escort Service Thane
VIP Call Girls Thane Sia 8617697112 Independent Escort Service ThaneCall girls in Ahmedabad High profile
 
Russian Call Girls In Gtb Nagar (Delhi) 9711199012 💋✔💕😘 Naughty Call Girls Se...
Russian Call Girls In Gtb Nagar (Delhi) 9711199012 💋✔💕😘 Naughty Call Girls Se...Russian Call Girls In Gtb Nagar (Delhi) 9711199012 💋✔💕😘 Naughty Call Girls Se...
Russian Call Girls In Gtb Nagar (Delhi) 9711199012 💋✔💕😘 Naughty Call Girls Se...shivangimorya083
 
20240429 Calibre April 2024 Investor Presentation.pdf
20240429 Calibre April 2024 Investor Presentation.pdf20240429 Calibre April 2024 Investor Presentation.pdf
20240429 Calibre April 2024 Investor Presentation.pdfAdnet Communications
 
Chapter 2.ppt of macroeconomics by mankiw 9th edition
Chapter 2.ppt of macroeconomics by mankiw 9th editionChapter 2.ppt of macroeconomics by mankiw 9th edition
Chapter 2.ppt of macroeconomics by mankiw 9th editionMuhammadHusnain82237
 
Monthly Market Risk Update: April 2024 [SlideShare]
Monthly Market Risk Update: April 2024 [SlideShare]Monthly Market Risk Update: April 2024 [SlideShare]
Monthly Market Risk Update: April 2024 [SlideShare]Commonwealth
 
Independent Lucknow Call Girls 8923113531WhatsApp Lucknow Call Girls make you...
Independent Lucknow Call Girls 8923113531WhatsApp Lucknow Call Girls make you...Independent Lucknow Call Girls 8923113531WhatsApp Lucknow Call Girls make you...
Independent Lucknow Call Girls 8923113531WhatsApp Lucknow Call Girls make you...makika9823
 

Recently uploaded (20)

🔝+919953056974 🔝young Delhi Escort service Pusa Road
🔝+919953056974 🔝young Delhi Escort service Pusa Road🔝+919953056974 🔝young Delhi Escort service Pusa Road
🔝+919953056974 🔝young Delhi Escort service Pusa Road
 
Monthly Economic Monitoring of Ukraine No 231, April 2024
Monthly Economic Monitoring of Ukraine No 231, April 2024Monthly Economic Monitoring of Ukraine No 231, April 2024
Monthly Economic Monitoring of Ukraine No 231, April 2024
 
VVIP Pune Call Girls Katraj (7001035870) Pune Escorts Nearby with Complete Sa...
VVIP Pune Call Girls Katraj (7001035870) Pune Escorts Nearby with Complete Sa...VVIP Pune Call Girls Katraj (7001035870) Pune Escorts Nearby with Complete Sa...
VVIP Pune Call Girls Katraj (7001035870) Pune Escorts Nearby with Complete Sa...
 
Q3 2024 Earnings Conference Call and Webcast Slides
Q3 2024 Earnings Conference Call and Webcast SlidesQ3 2024 Earnings Conference Call and Webcast Slides
Q3 2024 Earnings Conference Call and Webcast Slides
 
Best VIP Call Girls Noida Sector 18 Call Me: 8448380779
Best VIP Call Girls Noida Sector 18 Call Me: 8448380779Best VIP Call Girls Noida Sector 18 Call Me: 8448380779
Best VIP Call Girls Noida Sector 18 Call Me: 8448380779
 
Call Girls In Yusuf Sarai Women Seeking Men 9654467111
Call Girls In Yusuf Sarai Women Seeking Men 9654467111Call Girls In Yusuf Sarai Women Seeking Men 9654467111
Call Girls In Yusuf Sarai Women Seeking Men 9654467111
 
How Automation is Driving Efficiency Through the Last Mile of Reporting
How Automation is Driving Efficiency Through the Last Mile of ReportingHow Automation is Driving Efficiency Through the Last Mile of Reporting
How Automation is Driving Efficiency Through the Last Mile of Reporting
 
VIP Kolkata Call Girl Serampore 👉 8250192130 Available With Room
VIP Kolkata Call Girl Serampore 👉 8250192130  Available With RoomVIP Kolkata Call Girl Serampore 👉 8250192130  Available With Room
VIP Kolkata Call Girl Serampore 👉 8250192130 Available With Room
 
Instant Issue Debit Cards - High School Spirit
Instant Issue Debit Cards - High School SpiritInstant Issue Debit Cards - High School Spirit
Instant Issue Debit Cards - High School Spirit
 
Call US 📞 9892124323 ✅ Kurla Call Girls In Kurla ( Mumbai ) secure service
Call US 📞 9892124323 ✅ Kurla Call Girls In Kurla ( Mumbai ) secure serviceCall US 📞 9892124323 ✅ Kurla Call Girls In Kurla ( Mumbai ) secure service
Call US 📞 9892124323 ✅ Kurla Call Girls In Kurla ( Mumbai ) secure service
 
New dynamic economic model with a digital footprint | European Business Review
New dynamic economic model with a digital footprint | European Business ReviewNew dynamic economic model with a digital footprint | European Business Review
New dynamic economic model with a digital footprint | European Business Review
 
VIP Call Girls Service Dilsukhnagar Hyderabad Call +91-8250192130
VIP Call Girls Service Dilsukhnagar Hyderabad Call +91-8250192130VIP Call Girls Service Dilsukhnagar Hyderabad Call +91-8250192130
VIP Call Girls Service Dilsukhnagar Hyderabad Call +91-8250192130
 
call girls in Nand Nagri (DELHI) 🔝 >༒9953330565🔝 genuine Escort Service 🔝✔️✔️
call girls in  Nand Nagri (DELHI) 🔝 >༒9953330565🔝 genuine Escort Service 🔝✔️✔️call girls in  Nand Nagri (DELHI) 🔝 >༒9953330565🔝 genuine Escort Service 🔝✔️✔️
call girls in Nand Nagri (DELHI) 🔝 >༒9953330565🔝 genuine Escort Service 🔝✔️✔️
 
Call Girls Service Nagpur Maya Call 7001035870 Meet With Nagpur Escorts
Call Girls Service Nagpur Maya Call 7001035870 Meet With Nagpur EscortsCall Girls Service Nagpur Maya Call 7001035870 Meet With Nagpur Escorts
Call Girls Service Nagpur Maya Call 7001035870 Meet With Nagpur Escorts
 
VIP Call Girls Thane Sia 8617697112 Independent Escort Service Thane
VIP Call Girls Thane Sia 8617697112 Independent Escort Service ThaneVIP Call Girls Thane Sia 8617697112 Independent Escort Service Thane
VIP Call Girls Thane Sia 8617697112 Independent Escort Service Thane
 
Russian Call Girls In Gtb Nagar (Delhi) 9711199012 💋✔💕😘 Naughty Call Girls Se...
Russian Call Girls In Gtb Nagar (Delhi) 9711199012 💋✔💕😘 Naughty Call Girls Se...Russian Call Girls In Gtb Nagar (Delhi) 9711199012 💋✔💕😘 Naughty Call Girls Se...
Russian Call Girls In Gtb Nagar (Delhi) 9711199012 💋✔💕😘 Naughty Call Girls Se...
 
20240429 Calibre April 2024 Investor Presentation.pdf
20240429 Calibre April 2024 Investor Presentation.pdf20240429 Calibre April 2024 Investor Presentation.pdf
20240429 Calibre April 2024 Investor Presentation.pdf
 
Chapter 2.ppt of macroeconomics by mankiw 9th edition
Chapter 2.ppt of macroeconomics by mankiw 9th editionChapter 2.ppt of macroeconomics by mankiw 9th edition
Chapter 2.ppt of macroeconomics by mankiw 9th edition
 
Monthly Market Risk Update: April 2024 [SlideShare]
Monthly Market Risk Update: April 2024 [SlideShare]Monthly Market Risk Update: April 2024 [SlideShare]
Monthly Market Risk Update: April 2024 [SlideShare]
 
Independent Lucknow Call Girls 8923113531WhatsApp Lucknow Call Girls make you...
Independent Lucknow Call Girls 8923113531WhatsApp Lucknow Call Girls make you...Independent Lucknow Call Girls 8923113531WhatsApp Lucknow Call Girls make you...
Independent Lucknow Call Girls 8923113531WhatsApp Lucknow Call Girls make you...
 

Plan Grader

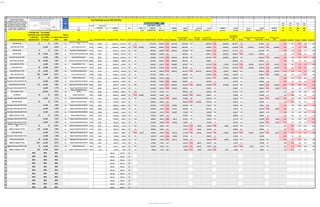
  • 1. Confidential 8/25/2017 Page 1 22 23 24 25 26 27 28 29 30 31 32 33 34 35 36 37 38 39 40 41 42 43 44 45 46 47 48 49 50 51 52 53 54 55 56 57 58 59 60 61 62 63 64 65 66 67 68 69 70 AD AE AF AG AJ AP AQ AR AS AT AU AW AY BE BF BH BJ BK BN BQ BR BU BX BY CB CE CF CI CL CM CN CO CP CQ EVAL % OF PLAN: 99% 2016 2015 3 Year 5 Year 11,070,170.65$ 9,260,798.00 =5500 -30% -27% -17% -21% 3% 20 flows 2016 990,843.75$ 100% 4,107.41 990,843.75$ 50% (4,924.64) 8,688,351 (8,462.53) 7,154,108 -$3,566.44 5,010,906 -$214.32 3,690,328 $2,460.75 2016 2015 3 Year 5 Year 1 62.50% 32 9% 10,157,061 (8,210) 9,166,217.00 495,421.88 (289,929) 8,688,351 -$55,414.53 $7,154,107.54 -$216,747.29 5,010,906 -$56,862.22 $3,690,327.55 -$54,969.83 -63% -31% -38% -22% prospectus benchmark if manager beat benchmark, years to determine persistent skill? any manager skill exhibited since 1996 to be <40 yrs? + or - bench since 1996? Index or passive fund name ticker trust assets 2017 DEITZ trust assets 2017 DEITZ 2016 return % of level 1 2017 lag 2017 lag cost trust assets 2016 DEITZ 50% of flows 2016 lag 2016 lag cost trust assets beg 2015 dietz from 5500 2015 lag 2015 lag cost from 5500 trust assets beg 2014 dietz from 5500 2014 lag 2014 lag cost from 5500 trust assets beg 2013 dietz from 5500 2013 lag 2013 lag cost from 5500 trust assets beg 2012 dietz from 5500 2012 lag 2012 lag cost from 5500 fd v bm 2016 fd v bm 2015 fd v bm 3y fd v bm 5y fd v bm 10y S&P 500 TR USD 31 31 2.70% No American Funds Growth Fund of Amer R6 RGAGX 1,533,814 1,533,814.17$ 118,710.70 14% 3.17 1,277,057.00 69,023.24 (3.141) (40,111.49) 1,210,479.63 4.31 996,725.60 (4.06) (40,430.49) 698,130.17 1.90 514,144.34 4.98 (3.14) 4.31 (0.84) 0.76 0.27 Russell 1000 Value TR USD no skill -0.23% No Invesco Equity and Income Y ACETX 1,420,344 1,420,344.44$ 178,652.66 12% (0.38) (5,361.60) 1,120,562.00 60,564.89 (2.215) (24,818.66) 1,062,143.25 1.73 874,583.38 (4.11) (35,964.57) 612,578.88 (7.26) (44,447.04) 451,139.31 (4.35) (19,604.00) (2.21) 1.73 (1.37) (2.99) 0.82 MSCI EM NR USD 13 13 4.14% No Oppenheimer Developing Markets Y ODVYX 978,164 978,163.67$ 62,414.29 9% 0.30 826,416.00 44,666.69 (4.022) (33,236.33) 783,332.09 1.08 645,006.43 (2.37) (15,257.12) 451,777.75 11.28 332,715.86 3.06 (4.02) 1.08 (1.57) 1.77 2.64 S&P 500 TR USD 54 no skill 1.50% No American Funds Fundamental Invs R6 RFNGX 793,631 793,630.94$ 86,611.65 7% 0.75 638,048.00 34,485.65 0.918 604,784.36 2.32 497,987.77 (4.42) (22,018.32) 348,802.41 (0.44) (1,551.16) 256,878.72 1.53 0.92 2.32 (0.32) 0.02 0.46 Russell Mid Cap Value TR USD no skill -1.88% No Vanguard Selected Value Inv VASVX 789,072 789,072.36$ 106,146.43 7% 2.92 616,305.00 33,310.47 (3.658) (22,541.62) 584,174.90 0.98 481,017.66 (8.39) (40,358.96) 336,916.14 8.58 248,124.97 (3.26) (8,087.68) (3.66) 0.98 (3.47) (1.43) (0.10) MSCI ACWI Ex USA NR USD 48 no skill 1.94% No American Funds Europacific Growth R6 RERGX 597,606 597,606.40$ 5,699.58 6% 3.68 534,165.00 28,870.91 (3.483) (18,604.03) 506,317.14 5.18 416,908.51 1.57 292,012.58 5.29 215,055.33 2.81 (3.48) 5.18 1.18 2.22 1.93 Russell 1000 Value TR USD no skill -0.38% No Vanguard Windsor™ II Inv VWNFX 505,483 505,482.62$ 57,202.95 4% 3.13 404,549.00 21,865.34 (3.926) (15,880.88) 383,458.47 0.61 315,744.99 (2.29) (7,242.36) 221,155.25 (1.84) (4,065.38) 162,871.81 (0.79) (1,291.97) (3.93) 0.61 (1.73) (1.57) (0.04) Russell 2000 TR USD 76 no skill 2.93% No Neuberger Berman Genesis Instl NBGIX 498,594 498,594.29$ 74,111.01 4% 0.23 383,074.00 20,704.64 (2.954) (11,314.58) 363,103.03 4.82 298,984.04 (4.94) (14,773.18) 209,415.49 (1.59) (3,339.38) 154,225.95 (6.25) (9,642.58) (2.95) 4.82 (0.84) (2.05) 2.01 Russell 2000 Growth TR USD 63 no skill 2.59% No Lord Abbett Developing Growth I LADYX 373,410 373,410.19$ (9,007.50) 4% 2.92 345,112.00 18,652.85 (13.794) (47,605.73) 327,120.12 (7.26) (23,743.73) 269,355.22 (2.05) (5,510.47) 188,662.76 14.45 138,942.41 (3.86) (5,361.87) (13.79) (7.26) (7.70) (3.72) 0.97 Russell 1000 Value TR USD 395 no skill 0.47% No Invesco Growth and Income Y ACGMX 424,664 424,663.64$ 68,170.99 4% 0.07 321,716.00 17,388.32 2.763 304,943.84 0.93 251,094.96 (3.03) (7,619.48) 175,872.84 1.64 129,523.16 (2.60) (3,362.69) 2.76 0.93 0.21 (0.10) 0.99 BBgBarc US Agg Bond TR USD 24 24 0.96% No PIMCO Total Return Instl PTTRX 331,595 331,594.75$ 8,002.62 3% 1.19 292,025.00 15,783.56 (0.048) 276,800.73 0.18 227,921.54 (1.27) (2,899.82) 159,641.63 0.10 117,569.54 6.15 (0.05) 0.18 (0.37) 0.98 1.28 Morningstar Lifetime Mod 2035 TR USD no skill -1.32% No Vanguard Target Retirement 2035 Inv VTTHX 296,187 296,187.38$ 21,587.56 3% 1.02 247,812.00 13,393.91 (1.802) (4,466.12) 234,892.71 1.32 193,413.89 1.44 135,471.66 0.79 99,769.34 (0.20) (1.80) 1.32 0.36 0.33 (0.31) Russell Mid Cap Growth TR USD 137 no skill 1.68% No Morgan Stanley Inst Mid Cap Growth I MPEGX 236,055 236,054.72$ (34,490.57) 3% 15.98 244,153.00 13,196.15 (20.731) (50,614.84) 231,424.46 (5.66) (13,093.86) 190,558.09 (10.58) (20,155.89) 133,471.39 2.60 98,296.23 (6.31) (6,204.59) (20.73) (5.66) (12.40) (8.92) (2.96) Morningstar Lifetime Mod 2045 TR USD no skill -1.11% No Vanguard Target Retirement 2045 Inv VTIVX 266,942 266,941.53$ 20,771.06 2% 1.19 222,156.00 12,007.24 (1.969) (4,374.46) 210,574.24 1.45 173,389.73 1.91 121,446.27 1.30 89,440.21 (0.26) (233.66) (1.97) 1.45 0.52 0.51 (0.14) S&P Completion TR USD prudent 0.04% Yes Vanguard Extended Market Index Admiral VEXAX 270,606 270,605.63$ 35,998.15 2% 0.02 211,721.00 11,443.24 0.177 200,683.26 0.08 165,245.36 0.06 115,741.75 0.13 85,239.07 0.03 0.18 0.08 0.10 0.09 0.12 Citi WGBI USD 19 19 2.83% No Templeton Global Bond A TPINX 195,926 195,925.76$ 10,948.86 2% (1.25) (2,456.62) 166,932.00 9,022.45 4.622 158,229.26 (0.68) (1,078.17) 130,288.15 2.05 91,256.90 6.22 67,206.98 14.16 4.62 (0.68) 1.93 5.10 3.55 Morningstar Lifetime Mod 2050 TR USD no skill -1.17% No Vanguard Target Retirement 2050 Inv VFIFX 194,035 194,035.29$ 15,067.59 2% 1.06 161,509.00 8,729.35 (2.041) (3,295.93) 153,088.98 1.62 126,055.58 2.18 88,292.30 1.51 65,023.67 (0.35) (230.22) (2.04) 1.62 0.65 0.61 (0.08) MSCI EAFE NR USD 18 18 2.74% No Dodge & Cox International Stock DODFX 179,102 179,101.82$ 13,051.21 2% 0.71 149,852.00 8,099.30 7.263 142,039.70 (10.54) (14,970.69) 116,957.45 4.98 81,919.76 3.54 60,330.56 3.71 7.26 (10.54) 0.27 1.45 1.36 Morningstar Lifetime Mod 2020 TR USD no skill -1.64% No Vanguard Target Retirement 2020 Inv VTWNX 168,692 168,692.42$ 10,459.44 2% 1.21 142,797.00 7,717.99 (0.712) (1,016.80) 135,352.50 1.20 111,451.11 1.24 78,062.99 2.87 57,490.21 (0.18) (0.71) 1.20 0.60 0.88 (0.19) Morningstar Lifetime Mod 2055 TR USD no skill -1.25% No Vanguard Target Retirement 2055 Inv VFFVX 164,393 164,392.99$ 12,799.73 1% 0.95 136,805.00 7,394.13 (2.028) (2,774.37) 129,672.88 1.62 106,774.44 2.45 74,787.34 1.84 55,077.82 (0.42) (228.68) (2.03) 1.62 0.74 0.72 - Morningstar Lifetime Mod 2040 TR USD no skill -1.18% No Vanguard Target Retirement 2040 Inv VFORX 148,946 148,945.88$ 11,424.35 1% 1.18 124,106.00 6,707.76 (1.876) (2,328.57) 117,635.93 1.25 96,863.04 1.63 67,845.17 1.32 49,965.19 (0.15) (1.88) 1.25 0.38 0.45 (0.18) BBgBarc US Credit A+ TR USD 21 21 2.10% No Vanguard Wellesley® Income Inv VWINX 116,792 116,792.42$ 8,336.29 1% 1.44 97,876.00 5,290.07 4.136 92,773.39 0.59 76,390.89 1.08 53,505.98 11.18 39,404.97 1.84 4.14 0.59 1.92 3.79 1.83 Morningstar Lifetime Mod 2025 TR USD no skill -1.81% No Vanguard Target Retirement 2025 Inv VTTVX 102,420 102,420.02$ 6,804.52 1% 1.24 86,288.00 4,663.75 (0.909) (784.13) 81,789.51 1.21 67,346.61 1.13 47,171.16 1.87 34,739.63 (0.37) (129.68) (0.91) 1.21 0.50 0.59 (0.22) Morningstar Lifetime Mod 2030 TR USD no skill -1.42% No Vanguard Target Retirement 2030 Inv VTHRX 98,285 98,285.16$ 6,830.57 1% 1.08 82,533.00 4,460.80 (1.407) (1,160.99) 78,230.27 1.27 64,415.88 1.16 45,118.41 0.85 33,227.86 (0.43) (144.52) (1.41) 1.27 0.38 0.31 (0.33) BofAML US Treasury Current 2 Yr TR USD 16 16 0.43% No Goldman Sachs Short Dur Govt Instl GSTGX 88,076 88,075.52$ 1,177.42 1% 0.35 78,421.00 4,238.55 0.760 74,332.64 (0.26) (195.66) 61,206.52 (0.28) (168.94) 42,870.50 0.02 31,572.37 0.73 0.76 (0.26) 0.07 0.19 0.42 BBgBarc US Agg Bond TR USD 178 no skill 1.30% No Vanguard Target Retirement 2015 Inv VTXVX 66,497 66,497.10$ 3,680.17 1% 3.52 56,689.00 3,063.97 3.511 53,733.61 (1.01) (544.86) 44,244.99 0.60 30,990.24 15.02 22,823.04 7.15 3.51 (1.01) 1.01 4.99 0.51 Russell 3000 TR USD no skill -1.15% No Nationwide Inv Dest Mod Agrsv R6 GMIAX 66,128 66,128.12$ 5,599.41 1% (0.59) (391.72) 54,624.00 2,952.35 (3.010) (1,644.15) 51,776.26 (2.34) (1,210.42) 42,633.29 (7.89) (3,365.56) 29,861.36 (11.40) (3,404.87) 21,991.67 (2.04) (447.70) (3.01) (2.34) (4.37) (5.16) (2.24) Morningstar Lifetime Mod 2060 TR USD no skill -1.04% No Vanguard Target Retirement 2060 Inv VTTSX 47,494 47,493.99$ 3,685.36 0% 0.90 39,535.00 2,136.81 (2.033) (803.89) 37,473.90 1.80 30,856.53 2.63 21,612.64 2.17 15,916.83 - (2.03) 1.80 0.86 - - MSCI ACWI Ex USA NR USD 44 no skill 2.61% No Oppenheimer International Growth Y OIGYX 42,297 42,297.23$ (844.32) 0% 1.65 38,933.00 2,104.28 (6.553) (2,551.11) 36,903.29 9.10 30,386.68 (3.12) (948.68) 21,283.55 10.17 15,674.46 5.27 (6.55) 9.10 (0.19) 2.61 2.59 BBgBarc US Agg Bond TR USD 1,527 no skill 0.37% No Vanguard Target Retirement 2010 Inv VTENX 36,975 36,974.73$ 1,750.53 0% 2.07 31,788.00 1,718.10 2.577 30,130.78 (0.75) (226.53) 24,810.10 (0.04) 17,377.58 11.12 12,797.88 5.91 2.58 (0.75) 0.58 3.74 0.26 BBgBarc US Treasury US TIPS TR USD 73 no skill 0.51% No PIMCO Real Return Instl PRRIX 26,327 26,327.21$ 1,204.42 0% 0.72 22,672.00 1,225.39 0.357 21,490.03 (1.31) (282.30) 17,695.19 (0.22) 12,394.13 (0.44) (54.40) 9,127.77 2.27 0.36 (1.31) (0.41) 0.08 0.24 BBgBarc US Agg Bond TR USD 226 no skill 0.62% No Vanguard Target Retirement Income Inv VTINX 11,618 11,618.24$ 552.78 0% 1.99 9,986.00 539.73 2.604 9,465.40 (0.72) (68.33) 7,793.94 (0.43) (33.47) 5,459.06 7.89 4,020.37 4.01 2.60 (0.72) 0.47 2.67 0.54 #N/A #N/A #N/A #VALUE! #VALUE! 0% - - - - - - #N/A #N/A #N/A #VALUE! #VALUE! 0% - - - - - - #N/A #N/A #N/A #VALUE! #VALUE! 0% - - - - - - #N/A #N/A #N/A #VALUE! #VALUE! 0% - - - - - - #N/A #N/A #N/A #VALUE! #VALUE! 0% - - - - - - #N/A #N/A #N/A #VALUE! #VALUE! 0% - - - - - - #N/A #N/A #N/A #VALUE! #VALUE! 0% - - - - - - #N/A #N/A #N/A #VALUE! #VALUE! 0% - - - - - - #N/A #N/A #N/A #VALUE! #VALUE! 0% - - - - - - #N/A #N/A #N/A #VALUE! #VALUE! 0% - - - - - - #N/A #N/A #N/A #VALUE! #VALUE! 0% - - - - - - # funds Because fund managers underperform 90% of the time the calculation to the right is necessary to determine when the manager adds value and whether it is based on skill or luck. A t-statistic of 2 ensures a 95% confidence level. % Index Calc PlanGrader review: ABC 401k Plan bmck31patent pending PlanGrader for Feeney Brothers Excavation Corp
  • 2. Prepared from IRS Forms 5500 filings by Rick Canipe, EA, QKA, MBA; IRS Enrolled Agent 77840; verify at epp@irs.gov or 855.472.5540` www.Fix401k.com www.MiraCenter.com Data from Morningstar.com #VALUE! =COUNTIF(R[1 0 0 0 99% TOTAL PAID OUT $432,523 $12,613 $95,420 $141,393 ? ? $ 681,949 Distributions 2012 2013 2014 2015 2016 2017Q2 -$8,210 -$682,132-$54,970 -$56,862 -$216,747 -$55,415 -$289,929 ABC 401k Plan Federal regulation 2550.408b-2 requires reviewing providers to determine they bring value and are "necessary." Federal regulation 2550.404a-5 requires disclosures to investors so they can evaluate performance versus benchmarks. This document was produced to aid in these efforts. "...emphasizes a duty to diversify, the avoidance of unjustified costs, and the importance of evaluating the portfolio as a whole…" 77% In 2016, what percent of the evaluated trust was invested in lagging funds? Supreme Court May 18, 2015 Ruling No In 2016, were >50% of assets invested in passive institutional shares? The Third Restatement of Trusts Prudent Investor Rule Adherence “The greater the trustee’s departure from one of the valid passive strategies, the greater is likely to be the burden of justification and also of continuous monitoring.” $ Lag 2012 2013 2014 2015 2016 2017Q2 TOTAL $ LAG "Under trust law, a trustee has a continuing duty to monitor trust investments and remove imprudent ones." 38% What % of the investment menu met or beat their benchmarks in 2016? Values from www.efast.dol.gov--also review and refer to your plan's annual 29 CFR 2550.404a-5 notice % of Plan Assets Reviewed: -63% -31% -38% -22% -70% -60% -50% -40% -30% -20% -10% 0% 2016 2015 3 YEAR 5 YEAR % of Funds Lagging Benchmarks (888)PlanLag www.FundLag.com AVERAGE % COST/YR +/- BENCHMARKS 2014-2016 -0.40% -0.71% Participants' Investment Cost v. Return Comparison Prepared using this plan's most recent public IRS/DOL Forms 5500 at www.dol.gov/efast Presented __________________________________ by R. Canipe, J. Holland or approved advisor
  • 3. Prepared from IRS Forms 5500 filings by Rick Canipe, EA, QKA, MBA; IRS Enrolled Agent 77840; verify at epp@irs.gov or 855.472.5540` www.Fix401k.com www.MiraCenter.com Data from Morningstar.com % large US mgrs beat benchmark % mid US mgrs beat benchmark % small US mgrs beat benchmark 8% 5% 7% % of this plan's active managers demonstrating skill 1 23% 1 the % of managers' whose performance beat benchmarks (with a <40 year observation period (working life)) Did you know (since 2001)?2 ABC 401k Plan Due Diligence--facts for this plan's fiduciary investment "experts" under ERISA SEC Rule 156 requires mutual fund companies to tell investors NOT to base their expectations of future performance on past performance. Why? Because past performance often does not matter to help prove a manager is good. One of the key measurements of successful active management lies in the ability of a manager to deliver above-average returns consistently.to differentiate a manager’s luck from skill. According to the S&P Dow Jones' Persistence Scorecard, few funds can consistently stay at the top. Out of 568 U.S. stock funds that were in the top quartile as of March 2015, only 1.94% managed to stay in the top quartile at the end of March 2017 (2 years). Also, bad performing funds disappear at a significant rate. When managers’ performance against the prospectus benchmarks is poor, fund companies often close these funds so their poor performance does not taint their overall firm's ratings. Over the 15-year period ending 12/31/2016 the percent (%) of funds that were merged or liquidated were: • 58% of U.S. equity funds • 52% of global/international equity funds • 49% of fixed income funds were either merged or liquidated. 2 https://us.spindices.com/documents/spiva/spiva-us-year-end-2016.pdf 2 https://us.spindices.com/documents/spiva/persistence-scorecard-june-2017.pdf 0 4 2 1 11 0 2 4 6 8 10 12 <10 years >10, <20 >20, <30 >30, <40 >40 years # FUNDS MONITORINGYEARS Skilled Managers' observation years Prepared using this plan's most recent public IRS/DOL Forms 5500 at www.dol.gov/efast Presented __________________________________ by R. Canipe, J. Holland or approved advisor
  • 4. Prepared from IRS Forms 5500 filings by Rick Canipe, EA, MBA IRS Enrolled Agent 77840; to verify the status, email epp@irs.gov or call 855.472.5540. www.Fix401k.com www.MiraCenter.com Data from Morningstar.com 99% Prudent Investor Rule Adherence “The greater the trustee’s departure from one of the valid passive strategies, the greater is likely to be the burden of justification and also of continuous monitoring.” Federal regulation 2550.408b-2 requires reviewing providers to determine they bring value and are "necessary." Federal regulation 2550.404a-5 requires disclosures to investors so they can evaluate performance versus benchmarks. This document was produced to aid in these efforts. ABC 401k PlanAmerican Law Institute Prudent Investor Rule "...emphasizes a duty to diversify, the avoidance of unjustified costs, and the importance of evaluating the portfolio as a whole…" 30% In 2016, what percent of the evaluated trust was invested in lagging funds? Supreme Court May 18, 2015 Ruling Yes In 2016, were >50% of assets invested in passive institutional shares? The Third Restatement of Trusts $ Lag 2012 2013 2014 2015 2016 2017Q2 TOTAL $ LAG "Under trust law, a trustee has a continuing duty to monitor trust investments and remove imprudent ones." 70% What % of the investment menu met or beat their benchmarks in 2016? Values from www.efast.dol.gov--also review and refer to your plan's annual 29 CFR 2550.404a-5 notice % of Plan Assets Reviewed: $4,107 -$10,600$2,461 -$214 -$3,566 -$8,463 -$4,925 TOTAL PAID OUT $432,523 $12,613 $95,420 $141,393 ? ? $ 681,949 Distributions 2012 2013 2014 2015 2016 2017Q2 -30% -27% -17% -21% -35% -30% -25% -20% -15% -10% -5% 0% 2016 2015 3 YEAR 5 YEAR % of Funds Lagging Benchmarks (888)PlanLag www.FundLag.com AVERAGE % COST/YR +/- BENCHMARKS 2014-2016 -0.17% -0.14% Participants' Investment Cost v. Return Comparison Prepared using this plan's most recent public IRS/DOL Forms 5500 at www.dol.gov/efast Presented __________________________________ by R. Canipe, J. Holland or approved advisor
  • 5. Prepared from IRS Forms 5500 filings by Rick Canipe, EA, MBA IRS Enrolled Agent 77840; to verify the status, email epp@irs.gov or call 855.472.5540. www.Fix401k.com www.MiraCenter.com Data from Morningstar.com Prepared using this plan's most recent public IRS/DOL Forms 5500 at www.dol.gov/efast Presented __________________________________ by R. Canipe, J. Holland or approved advisor