1. Aarti Drugs Ltd.
BUY
- 1 - Saturday, 21
st
November, 2015
This document is for private circulation, and must be read in conjunction with the disclaimer on the last page.
STOCKPOINTER
Target Price `675 CMP ` 527 FY17E P/E 12.9x
Index Details In existence since 1984, Aarti Drugs Limited (ADL), part of the USD 500
million Aarti Group of Industries is a known brand in the API space.
Expertise in various chemistries along with backward integration has
enabled it to be a cost competent player in a large number of products.
WHO and USFDA certified manufacturing facilities at Tarapur and
Sarigam have propelled exports (16% CAGR over 4 years) to ~40% of
revenues over the last 5 years. The company manufactures Vitamins,
Anti-arthritis, Anti-fungal, Antibiotics, ACE inhibitors, besides its range
in anti-diabetic, anti-inflammatory, sedatives and anti-depressant drugs.
We expect Aarti Drugs’s revenues to grow at a 2 year CAGR of 16% to
Rs 1481 crores by FY17E while earnings are expected to grow at a
CAGR of 19% to Rs 109 crore over the same period. The EBITDA
margins (ex OI) and PAT margins are expected to be at 15.9% and 7.4%
respectively.
We are upbeat on the prospects on the company given that:
ADL will be adding Norfloxacin to its antibiotic portfolio in FY16. For
the new antibiotic facility, ADL expects to get WHO/GMP approvals
in 3 – 4 months and will be targeting semi-regulated markets for its
products. The revenues of its antibiotics segment are expected to
grow at a CAGR of 21% by FY17. Therapeutically, antibiotics
contribute almost half of the total revenues of ADL, with margins in
the range of 14-16%.
ADL is aggressively increasing its Metronidazole (an Anti-protozole)
capacity from 100 to 200 tons per month (which will be the largest in
the world) and already has WHO/GMP approvals for the same. The
anti-protozole segment revenues are expected to grow at a CAGR
of 16% by FY17.
ADL has a capacity of 120 tons to manufacture Celecoxib (Anti
inflammatory). Currently the company is utilizing ~67% of its
Celecoxib manufacturing capacity. For regulated markets another
plant is lined up in Tarapur with 12 - 14 tons per month of capacity
of Celecoxib.
Sensex 25,858
Nifty 7,856
Industry Pharma
Scrip Details
MktCap (` cr) 1,277.6
BVPS (`) 125.4
O/s Shares (Cr) 2.4
AvVol 6141
52 Week H/L 874/350
Div Yield (%) 1.4
FVPS (`) 10.0
Shareholding Pattern
Shareholders %
Promoters 61.9
DIIs 3.1
FIIs 0.1
Public 34.9
Total 100.0
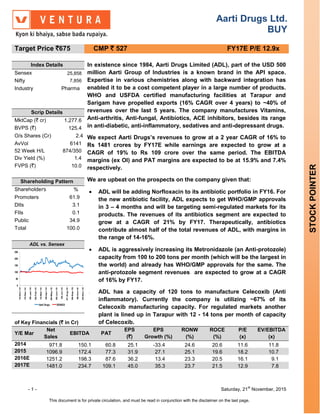
ADL vs. Sensex
0
50
100
150
200
250
10-Nov-14
10-Dec-14
09-Jan-15
08-Feb-15
10-Mar-15
09-Apr-15
09-May-15
08-Jun-15
08-Jul-15
07-Aug-15
06-Sep-15
06-Oct-15
05-Nov-15
Aarti Drugs SENSEX
of Key Financials (` in Cr)
Y/E Mar
Net
Sales
EBITDA PAT
EPS
(`)
EPS
Growth (%)
RONW
(%)
ROCE
(%)
P/E
(x)
EV/EBITDA
(x)
2014 971.8 150.1 60.8 25.1 -33.4 24.6 20.6 11.6 11.8
2015 1096.9 172.4 77.3 31.9 27.1 25.1 19.6 18.2 10.7
2016E 1251.2 198.3 87.6 36.2 13.4 23.3 20.5 16.1 9.1
2017E 1481.0 234.7 109.1 45.0 35.3 23.7 21.5 12.9 7.8
2. - 2 - Saturday, 21
st
November, 2015
This document is for private circulation, and must be read in conjunction with the disclaimer on the last page.
On the back of this, Anti-inflammatory revenues (which constitute
10% of total revenues) to grow at a robust CAGR of 20% by FY17.
Antifungals (Ketoconazole) capacity has increased from 6-7 tons in
FY11 to 26-28 tons in FY15. We expect the revenues from Antifungal
to grow at a rapid rate of 18% CAGR by FY17.
Significant expansion of its Metformin plant from 100 tpm to 600 tpm
(scalable to 1200 tpm) is expected to boost revenues of the anti-
diabetic segment. We expect the revenue of anti diabetics to grow at
a CAGR of 17% by FY17.
Diversified product portfolio and client base augurs well for risk
reduction.
We initiate coverage on Aarti Drugs Ltd as a BUY with a price objective
of Rs 675 representing a potential upside of 28% from the CMP of Rs
527 over a period of 16 months. We have used the PE multiple approach
to value Aarti Drugs and assigned a multiple of 15x on FY17 EPS of Rs
45 crore to arrive at the target price.
3. - 3 - Saturday, 21
st
November, 2015
This document is for private circulation, and must be read in conjunction with the disclaimer on the last page.
Company Background
Aarti Drugs Limited (ADL), established in 1984, is part of the USD 500 million Aarti
Group of Industries. With its manufacturing facilities at Tarapur and Sarigam, the
company manufactures Vitamins, Anti-arthritis, Anti-fungal, Antibiotics, ACE
inhibitors, besides its range in anti-diabetic, anti-inflammatory, sedatives and anti-
depressant drugs.
The company manufactures tablets and is involved in the formulation business with
Cipla, Lupin, Abbot, Wockhard, Alcan, Alembic, etc. ADL does toll manufacturing for
only those businesses where they are the API suppliers. ~40% of the APIs for the
combination formulation is sourced from outside.
On a segmental basis, the company derives more than 80% of its income from its
Active Pharmaceutical Ingredients (APIs), 7% of income is from the Formulation
business and balance is from specialty chemicals and other intermediates.
Key Investment Highlights
Revenue and profit margins are expected to grow
Over the period FY07-FY15, ADL has clocked YoY revenue growth of above 18%
with revenues having grown from Rs 289 crore in FY07 to Rs 1,096.9 crore in
FY15. This exponential growth has been driven by
Segmental break up of revenues
22
28
33 34
40 42 43
20
19
20 19
19 19 19
10
12
10 11
10 10 11
4
5
5 8
7 7 7
4
5
5
3
3 3 3
3
2
2
4
3
3 3
12
9
10
8
7 7 7
6
4
3 4
3 3 3
2
2
3
1 2 2 2
18 15
9 8 4 3 3
0
10
20
30
40
50
60
70
80
90
100
Mar-11 Mar-12 Mar-13 Mar-14 Mar-15 Mar-16E Mar-17E
Others
Intermidiates
Speciality Chem
Formulation
Cardioprotectant
Antidiabetic
Antifungal
Antiinflammatory
Antiprotozoals
Antibiotic
%
Source Aarti Drugs Ltd, Ventura Research
4. - 4 - Saturday, 21
st
November, 2015
This document is for private circulation, and must be read in conjunction with the disclaimer on the last page.
~40% exports historically (at least last 5 years) indicating good global presence
backward integration giving cost competitiveness,
big product basket (many of them dedicated facilities) and
huge client diversification which helps in cross selling whenever ADL launches
new products.
Going forward, we expect revenues to grow at a CAGR of 16% to Rs 1599.6 crore
by FY17. The key growth drivers will be Antibiotic and Antiprotozole segments
which we expect to grow at a CAGR of 20% in the upcoming years while antifungals
and antidiabetic segment are expected to clock a CAGR growth of 17%.
Antibiotic to be the highest contributor
Launching of new products, targeting new global markets and commencement of its
new facility at Tarapur, is expected to propel the revenues of its antibiotics segment
at a CAGR of 21%. Therapeutically, antibiotics contribute almost half of the total
revenues of ADL, with margins in the range of 14-16%.
The recent growth in the antibiotic business has primarily been from the launch of
two products viz. Ofloxacin (launched in FY12) and Levofloxacin (launched in
FY14). ADL is the second largest global producer of Ciprofloxacin and it contributes
20% to its overall revenue. Enrofloxacin (contributes 5% - 7% to overall sales) is
another antibiotic products which the company manufactures. ADL will be adding
Norfloxacin to its antibiotic portfolio in FY16. For the new antibiotic facility, ADL
expects to get WHOGMP approval in 3 – 4 months and will be targeting semi-
regulated markets for its products. However, for the old facility of Ceprofloxacin,
ADL will be applying for COS approval from European authorities.
Strong sales growth over the years
0
2
4
6
8
10
12
14
16
18
20
0
200
400
600
800
1000
1200
1400
1600
Mar-07 Mar-08 Mar-09 Mar-10 Mar-11 Mar-12 Mar-13 Mar-14 Mar-15 Mar-16E Mar-17E
Sales EBITDA Margin PAT Margin
` in Crore
%
Source Aarti Drugs Ltd, Ventura Research
5. - 5 - Saturday, 21
st
November, 2015
This document is for private circulation, and must be read in conjunction with the disclaimer on the last page.
Antiprotozoles to witness expansion in capacity on the back of
global demand
Currently Antiprotozoles contribute to ~20% of the total revenue of ADL. Apart from
Metronidazole (manufactures 100 tpm), ADL produces Ornidazole, Secnidazole,
and Tinidazole.
ADL is aggressively increasing its Metronidazole capacity from 100 to 200 tons
(which will be largest in the world) and already has WHO/GMP approval for the
Antibiotics to be the highest contributor
0
100
200
300
400
500
600
700
Mar-11 Mar-12 Mar-13 Mar-14 Mar-15 Mar-16E Mar-17E
` in Crore
Source Aarti Drugs Ltd, Ventura Research
Metronidazole to propel growth of Anti-protozoles segment
0
50
100
150
200
250
300
Mar-11 Mar-12 Mar-13 Mar-14 Mar-15 Mar-16E Mar-17E
` in Crore
Source Aarti Drugs Ltd, Ventura Research
6. - 6 - Saturday, 21
st
November, 2015
This document is for private circulation, and must be read in conjunction with the disclaimer on the last page.
same. On the back of this facility, total revenues from Antiprotozoles segment is
expected to grow at a CAGR of 16% by FY17.
Celecoxib to lead the growth for Anti-inflammatory
The Anti-inflammatory business has grown at a CAGR of 21% from Rs 51 crore in
FY11 to Rs 114 crore in FY15. ADL manufactures this product at a WHO/GMP
certified facility and another USFDA certified facility which suffices the current
demand. However, due to an import alert, the production from USFDA approved
plant was stopped. However, the company is hopeful that the import alert will be
lifted shortly. Once the Celeoxib resumes, we expect the growth of the Anti-
inflammatory segment to clock CAGR of 20% by FY17.
Celecoxib is currently a Pfizer API. Its patent is about to expire in a couple of years.
Pfizer manufactures ~500-600 tons of Celecoxib. ADL will be targeting highly
regulated markets for sale of Celecoxib. ADL has a capacity of 120 tons to
manufacture Celecoxib. Currently the company is utilizing ~67%of its Celecoxib
manufacturing capacity. For regulated markets another plant is lined up in Tarapur
with 12 - 14 tons per month of capacity of Celecoxib. Installed capacity will give
revenues of ~Rs. 35 crores to Rs. 50 crores per annum.
For Celecoxib, new distribution strategy being tested in Europe
The company has tie-ups with European distributors on a profit sharing basis. The
European distributors will buy the dossiers at a wholesale price and will retail the
same.
They command around 8-10% of market share in UK. 3 dossiers (Celecoxib,
Zolpidem Tartrate (Sedative) and acanprosate calcium (for alcoholism treatment)
are ready. ADL has partnered with a US company for formulation (Rivastigmine
product manufacturing) wherein ADL would be supplying API.
Source Aarti Drugs Ltd, Ventura Research
7. - 7 - Saturday, 21
st
November, 2015
This document is for private circulation, and must be read in conjunction with the disclaimer on the last page.
New markets to open up for Anti-fungal drugs
Antifungals contribute ~7% to the top line of ADL. ADL expects growth in the
antifungal segment to come from the opening up of new markets Brazil and South
East Asia. ADL is optimistic about acquiring 1 – 2 customers in next couple of years
in both Brazil and South East Asian markets. Ketoconazole (anti-fungal) capacity
has increased from 6-7 tons in FY11 to 26 – 28 tons in FY15. The company also
manufactures, exports and supplies to its competitors, cistosylate an intermediate
of Ketoconazole.
Celecoxib to boost the growth of Anti-inflammatory segment
0
20
40
60
80
100
120
140
160
180
Mar-11 Mar-12 Mar-13 Mar-14 Mar-15 Mar-16E Mar-17E
` in Crore
Source Aarti Drugs Ltd, Ventura Research
New markets to Antifungal segment
0
20
40
60
80
100
120
Mar-11 Mar-12 Mar-13 Mar-14 Mar-15 Mar-16E Mar-17E
` in Crore
Source Aarti Drugs Ltd, Ventura Research
8. - 8 - Saturday, 21
st
November, 2015
This document is for private circulation, and must be read in conjunction with the disclaimer on the last page.
With the opening of new markets and increase in capacity in its existing plants, we
expect the revenues from Antifungal to grow at a rapid rate of 18% CAGR by FY17.
Capacity expansion to help revenues from Ant-diabetic drugs to
expand
Anti-diabetic is a small business segment for ADL. It contributes only 3-4% of its
total revenue share. However significant expansion of its Metformin plant from 100
tpm to 600 tpm (scalable to 1200 tpm) is expected to boost revenues from this
segment. The 600 tpm capacity of Metformin manufacturing is expected to deliver
revenue of ~Rs. 150 crores per annum. The company expects realizations to go up
once regulated sales start post FY17.
The Sarigam Metformin facility which started in March 2014 received WHOGMP
approval in the end Q1FY15. Recently the facility has been successfully inspected
by Mexican authorities and the certification is awaited. The old Tarapur facility has
received Brazil and Mexican certifications and is an overbooked facility. The
company went from batch manufacturing to continuous manufacturing which has
reduced the capex. Raw material costs have been lowered by 10%.
Pioglitazone is another niche diabetic product of ADL. We expect the revenue of
anti diabetics to grow at a CAGR of 17% by FY17.
Metformin capacity expansion to propel Anti-diabetics
0
5
10
15
20
25
30
35
40
45
50
Mar-11 Mar-12 Mar-13 Mar-14 Mar-15 Mar-16E Mar-17E
` in Crore
Source Aarti Drugs Ltd, Ventura Research
9. - 9 - Saturday, 21
st
November, 2015
This document is for private circulation, and must be read in conjunction with the disclaimer on the last page.
Other Segments
The ADL product portfolio does contain various other smaller products viz APIs for
Cardioprotectants (3% of the total revenue), formulation (7% of revenues), specialty
chemicals ( 3%), intermediates (2%) and others (4%).
‘
This helps the company in mitigating risk of dependency on a single product and
also helps in reduction of its wastages as the “waste” is used as an input in the
formulation of other products.
Cardioprotectants constitute 3% of revenues
0
5
10
15
20
25
30
35
40
45
Mar-11 Mar-12 Mar-13 Mar-14 Mar-15 Mar-16E Mar-17E
` in Crore
Source Aarti Drugs Ltd, Ventura Research
Formulations at a fledgling state of growth
0
20
40
60
80
100
120
Mar-11 Mar-12 Mar-13 Mar-14 Mar-15 Mar-16E Mar-17E
` in Crore
Source Aarti Drugs Ltd, Ventura Research
Specialty Chemicals and Intermediates to experience tepid growth
0
5
10
15
20
25
30
35
40
45
Mar-11 Mar-12 Mar-13 Mar-14 Mar-15 Mar-16E Mar-17E
` in Crore
Source Aarti Drugs Ltd, Ventura Research
0
5
10
15
20
25
30
35
Mar-11 Mar-12 Mar-13 Mar-14 Mar-15 Mar-16E Mar-17E
` in Crore
10. - 10 - Saturday, 21
st
November, 2015
This document is for private circulation, and must be read in conjunction with the disclaimer on the last page.
Well diversified product and client portfolio augurs well to risk reduction
ADL is a leader in most of its top 10 products domestically. The top 10 local clients
contribute around 28% of total sales. The topmost client contributes ~4.5% of total
local sales. Export clientele is also well diversified with the topmost client
contributing 3.8% of total exports. Top 10 export clients contribute 25% of total
exports.
Acquisition of new facility to contribute in the upcoming years
ADL purchased one small formulation facility in Baddi in Sep’14 for a total
consideration of Rs. ~10.5 crore (including outstanding liabilities). This facility is
now a 100% subsidiary and enjoys tax incentive benefits till 2019. It has the
capacity to manufacture 7.0 crore tablets / capsules annually and ADL plans to
transfer its entire toll manufacturing activities for formulations to this unit over the
next year.
ADL manufactures formulations for large domestic companies using third party
manufacturers. Management expects improved margins in addition to scaling up
the formulation business going forward. The company also plans additional capex
of Rs. 8-10 crore in the next fiscal to scale up and modernize the facility. Q4FY15
sale from this subsidiary was ~Rs. 11.5 crores and Q1FY16 sales was ~Rs. 26.5
crores.
Regionwise sales over last 4 years
61 62 59 62
9 9 14 12
12 11 9 8
4 4 4 42 2 1 1
12 11 12 13
0
10
20
30
40
50
60
70
80
90
100
Jan-12 Jan-13 Jan-14 Jan-15
Latin America
North America
Africa
Europe
Aisa
India
%
Source Aarti Drugs Ltd, Ventura Research
Export sales of ADL in FY15
Latin
America
(Mainly Brazil
and Mexico)
34%
USA
3%
Europe
(Mainly
Netherlands,
Spain Turkey
and Italy)
22%
Africa
9%
Asia (Mainly
China,
Pakistan and
Bangladesh)
32%
Source Aarti Drugs Ltd, Ventura Research
11. - 11 - Saturday, 21
st
November, 2015
This document is for private circulation, and must be read in conjunction with the disclaimer on the last page.
Key Risks
Volatile crude prices
Variation in crude oil prices will always be an area of concern. ADL has already
installed greener technologies like briquette fired boilers, economizers etc. to save
power and fuel costs, which reflects in the financial results of the Company. ADL
was able to cope up with these pressures due to strong operational efficiency and
increased market share of its products.
Foreign exchange fluctuations
Extreme volatility of exchange rate of the Rupee against the US dollar can have a
significant impact on ADL operations because approximately 40% of its total
revenues consist of exports. However, natural hedges mitigate the risk to a large
extent due to the imports. ADL has a strict policy of hedging all of its foreign
currency loans to mitigate the risk of volatility of exchange rate.
Financial Performance
In Q2FY16, the revenue of ADL showed a de growth of 4.7% YoY to Rs 272.8 crore
on account of a fall in crude prices. However, it managed to maintain its EBIDTA
levels at Rs 42.6 crore (Rs 42.4 crore in Q2FY15). PAT showed a decline on
account of increased finance cost, rise in depreciation and higher tax expenses
from Rs 9.4 crore in Q2FY15 to Rs 10.8 crore during the quarter. PAT margin
reported in Q2FY16 is 5.8%.
For FY15, revenue increased by 12% YoY from Rs 971.8 crore in FY14 to Rs
1087.2 crore in FY15. The EBITDA grew by 15% YoY to Rs 169 crore. In FY15,
EBIT margins increased to 13% as compared to 12% in FY14. PAT rose by 25.8%
YoY to Rs 77.6 crore. The PAT margin showed a growth of 70 bps to 7.1%.
12. - 12 - Saturday, 21
st
November, 2015
This document is for private circulation, and must be read in conjunction with the disclaimer on the last page.
Financial Outlook:
With expansion plans in place, the growth trajectory in revenues (2 Yr CAGR of
16% to Rs 1,481 by FY17) should continue. ADL has diversity in its product profile
as well as in its cliente portfolio which reduces the dependency of the company on
a single product or a single client. In addition effective working capital management,
new FDA approvals and opening of new export markets augur well for the future
growth for Aarti Drugs.
We expect Aarti Drugs’s revenues to grow at a 2 year CAGR of 16% to Rs 1481
crores by FY17E while earnings are expected to grow at a CAGR of 19% to Rs 109
crore over the same period. The EBITDA margins (ex OI) and PAT margins are
expected to be at 15.9% and 7.4% respectively.
Consolidated Quarterly Financial Performance (Rs crores)
Description Q2FY16 Q2FY15 FY201503 FY201403
Net Sales 272.8 286.3 1087.2 971.8
Growth (%) -4.7 11.9
Total expenditure 230.3 243.8 918.3 825.4
EBITDA 42.6 42.4 169.0 146.4
Margin (%) 15.6 15.3 15.5 15.1
Depreciation 9.1 7.5 30.7 28.1
EBIT (Ex. OI) 33.5 35.0 138.3 118.2
Non-Operating Income 0.7 0.0
EBIT 33.5 35.0 139.0 118.3
Margin (%) 12.3 12.2 12.8 12.2
Finance Cost 10.8 9.4 38.9 33.5
Extraordinary Items 0.0 0.9
PBT 22.7 25.5 100.1 85.7
Margin (%) 8.3 8.9 9.2 8.8
Provision for Tax 7.0 6.8 22.5 24.0
Profit after Tax 15.7 18.8 77.6 61.7
Margin (%) 5.8 6.6 7.1 6.4
Source Aarti Drugs Ltd, Ventura Research
13. - 13 - Saturday, 21
st
November, 2015
This document is for private circulation, and must be read in conjunction with the disclaimer on the last page.
Consolidated Revenue, Gross & PAT margins
0
2
4
6
8
10
12
14
16
18
20
0
200
400
600
800
1000
1200
1400
1600
Mar-09
Mar-10
Mar-11
Mar-12
Mar-13
Mar-14
Mar-15
Mar-16E
Mar-17E
Sales EBITDA Margin PAT Margin
` in Crore %
Source: Aarti Drugs Ltd, Ventura Research
Strong RoCE & RoE margins
0
5
10
15
20
25
30
Mar-09
Mar-10
Mar-11
Mar-12
Mar-13
Mar-14
Mar-15
Mar-16E
Mar-17E
RoE RoCE
%
Source: Aarti Drugs Ltd, Ventura Research
Net working capital days to remain flat
0
20
40
60
80
100
120
Mar-09
Mar-10
Mar-11
Mar-12
Mar-13
Mar-14
Mar-15
Mar-16E
Mar-17E
Debtor Days Inventory Days Creditor Days
No. of Days
Source: Aarti Drugs Ltd, Ventura Research
D/E ratio expected to be around 0.95
0.50
0.70
0.90
1.10
1.30
1.50
1.70
1.90
Mar-09
Mar-10
Mar-11
Mar-12
Mar-13
Mar-14
Mar-15
Mar-16E
Mar-17E
D/E
Source: Aarti Drugs Ltd, Ventura Research
14. - 14 - Saturday, 21
st
November, 2015
This document is for private circulation, and must be read in conjunction with the disclaimer on the last page.
Valuation
We initiate coverage on Aarti Drugs Ltd as a BUY with a price objective of Rs 675
representing a potential upside of 28% from the CMP of Rs 527 over a period of 16
months. We have used the PE multiple approach to value Aarti Drugs and assigned
a multiple of 15x on FY17 EPS of Rs 45 to arrive at the target price. We are upbeat
on the company due to the following aspects :
Capacity expansion to drive volume growth
Diversified product portfolio significantly reduces risk
Opening of new export markets and receipt of FDA approvals for new drugs
will lead to growth in revenues
Margins to expand due to efficient working capital management and
sufficient cash generation from operations.
ADL P/E Trend
0
100
200
300
400
500
600
700
800
900
Sep-10 Sep-11 Sep-12 Sep-13 Sep-14 Sep-15
CMP 5X 10X 15X 20X 25X
Source : Aarti Drugs Ltd, Ventura Research
ADL P/BV Trend
0
100
200
300
400
500
600
700
800
900
Sep-10 Sep-11 Sep-12 Sep-13 Sep-14 Sep-15
CMP 1X 2.2X 3.4X 4.6X 5.8X
Source : Aarti Drugs Ltd, Ventura Research
ADL EV/EBITDA Trend
0
500
1000
1500
2000
2500
3000
Sep-10 Sep-11 Sep-12 Sep-13 Sep-14 Sep-15
EV 3.5X 6X 8.5X 11X 13.5X
Source : Aarti Drugs Ltd, Ventura Research
15. - 15 - Saturday, 21
st
November, 2015
This document is for private circulation, and must be read in conjunction with the disclaimer on the last page.
Financials and Projections
Y/E March, Fig in ` Cr FY14 FY15 FY16E FY17E Y/E March, Fig in ` Cr FY14 FY15 FY16E FY17E
Profit & Loss Statement Per Share Data (Rs)
Net Sales 971.8 1096.9 1251.2 1481.0 Adj. EPS 25.1 31.9 36.2 45.0
% Chg. 12.9 14.1 18.4 Cash EPS 37.1 44.7 51.0 62.7
Total Expenditure 821.7 924.5 1052.9 1246.3 DPS 6.5 8.0 7.2 9.0
% Chg. 12.5 13.9 18.4 Book Value 103.6 127.2 154.9 189.4
EBDITA 150.1 172.4 198.3 234.7 Capital, Liquidity, Returns Ratio
EBDITA Margin % 15.4 15.7 15.9 15.9 Debt / Equity (x) 1.5 1.5 1.1 1.0
Other Income 0.0 0.6 0.4 0.4 Current Ratio (x) 1.0 1.1 1.2 1.2
PBDIT 150.1 173.0 198.7 235.1 ROE (%) 24.6 25.1 23.3 23.7
Depreciation 28.1 31.0 35.9 43.1 ROCE (%) 20.6 19.6 20.5 21.5
Interest 37.2 42.3 46.0 46.9 Dividend Yield (%) 1.1 1.4 1.2 1.5
Exceptional items 0.0 0.0 0.0 0.0 Valuation Ratio (x)
PBT 84.8 99.7 116.8 145.2 P/E 11.6 18.2 16.1 12.9
Tax Provisions 24.0 22.5 29.2 36.3 P/BV 5.6 4.6 3.7 3.1
Reported PAT 60.8 77.3 87.6 108.9 EV/Sales 1.8 1.7 1.5 1.2
Minority Interest 0.0 0.0 0.0 0.0 EV/EBIDTA 11.8 10.7 9.1 7.8
PAT 60.8 77.3 87.6 108.9 Efficiency Ratio (x)
PAT Margin (%) 6.3 7.0 7.0 7.4 Inventory (days) 60.9 69.7 68.5 67.0
Other opr Exp / Sales (%) 0.0 0.1 0.0 0.0 Debtors (days) 103.9 104.6 101.4 98.6
Tax Rate (%) 28.3 22.5 25.0 25.0 Creditors (days) 72.2 70.8 70.1 67.6
Balance Sheet Cash Flow Statement
Share Capital 12.1 24.2 24.2 24.2 Profit Before Tax 84.8 99.7 116.8 145.2
Reserves & Surplus 238.8 283.9 351.0 434.4 Depreciation 28.1 30.9 35.9 43.1
Minority Interest 0.0 0.0 0.0 0.0 Working Capital Changes -24.1 -49.6 -19.2 -45.8
Long Term Borrowings 76.6 163.5 188.5 203.5 Others 6.6 23.6 16.8 10.5
Deferred Tax Liability 31.0 35.0 32.3 38.8 Operating Cash Flow 95.4 104.6 150.3 152.9
Other Non Current Liabilities 11.5 12.5 12.5 12.3 Capital Expenditure -106.5 -107.0 -95.9 -103.1
Total Liabilities 370.1 519.2 608.5 713.2 Other Investment Activities 1.8 0.0 0.0 0.0
Gross Block 581.1 685.2 781.1 884.2 Cash Flow from Investing -104.7 -107.0 -95.9 -103.1
Less: Acc. Depreciation 208.6 236.7 272.6 315.7 Changes in Share Capital 0.0 0.0 0.0 0.0
Net Block 372.5 448.5 508.5 568.5 Changes in Borrowings 58.2 63.1 5.0 15.0
Capital Work in Progress 8.3 16.1 3.3 6.0 Dividend and Interest -47.4 -61.6 -56.4 -68.6
Other Non Current Assets 4.6 4.6 4.6 4.6 Cash Flow from Financing 10.8 1.5 -51.4 -53.6
Net Current Assets -22.4 42.8 84.9 126.9 Net Change in Cash 1.5 -1.0 3.0 -3.7
Long term Loans & Advances 7.0 7.2 7.2 7.2 Opening Cash Balance 2.9 4.4 3.5 6.5
Total Assets 370.1 519.2 608.5 713.2 Closing Cash Balance 4.4 3.5 6.5 3.0
16. - 16 - Saturday, 21
st
November, 2015
This document is for private circulation, and must be read in conjunction with the disclaimer on the last page.
Disclosures and Disclaimer
Ventura Securities Limited (VSL) is a SEBI registered intermediary offering broking, depository and portfolio management services to clients. VSL is member of
BSE, NSE and MCX-SX. VSL is a depository participant of NSDL. VSL states that no disciplinary action whatsoever has been taken by SEBI against it in last
five years except administrative warning issued in connection with technical and venial lapses observed while inspection of books of accounts and records.
Ventura Commodities Limited, Ventura Guaranty Limited, Ventura Insurance Brokers Limited and Ventura Allied Services Private Limited are associates of VSL.
Research Analyst (RA) involved in the preparation of this research report and VSL disclose that neither RA nor VSL nor its associates (i) have any financial
interest in the company which is the subject matter of this research report (ii) holds ownership of one percent or more in the securities of subject company (iii)
have any material conflict of interest at the time of publication of this research report (iv) have received any compensation from the subject company in the past
twelve months (v) have managed or co-managed public offering of securities for the subject company in past twelve months (vi) have received any
compensation for investment banking merchant banking or brokerage services from the subject company in the past twelve months (vii) have received any
compensation for product or services from the subject company in the past twelve months (viii) have received any compensation or other benefits from the
subject company or third party in connection with the research report. RA involved in the preparation of this research report discloses that he / she has not
served as an officer, director or employee of the subject company. RA involved in the preparation of this research report and VSL discloses that they have not
been engaged in the market making activity for the subject company. Our sales people, dealers, traders and other professionals may provide oral or written
market commentary or trading strategies to our clients that reflect opinions that are contrary to the opinions expressed herein. We may have earlier issued or
may issue in future reports on the companies covered herein with recommendations/ information inconsistent or different those made in this report. In reviewing
this document, you should be aware that any or all of the foregoing, among other things, may give rise to or potential conflicts of interest. We may rely on
information barriers, such as "Chinese Walls" to control the flow of information contained in one or more areas within us, or other areas, units, groups or
affiliates of VSL. This report is for information purposes only and this document/material should not be construed as an offer to sell or the solicitation of an offer
to buy, purchase or subscribe to any securities, and neither this document nor anything contained herein shall form the basis of or be relied upon in connection
with any contract or commitment whatsoever. This document does not solicit any action based on the material contained herein. It is for the general information
of the clients / prospective clients of VSL. VSL will not treat recipients as clients by virtue of their receiving this report. It does not constitute a personal
recommendation or take into account the particular investment objectives, financial situations, or needs of clients / prospective clients. Similarly, this document
does not have regard to the specific investment objectives, financial situation/circumstances and the particular needs of any specific person who may receive
this document. The securities discussed in this report may not be suitable for all investors. The appropriateness of a particular investment or strategy will
depend on an investor's individual circumstances and objectives. Persons who may receive this document should consider and independently evaluate whether
it is suitable for his/ her/their particular circumstances and, if necessary, seek professional/financial advice. And such person shall be responsible for conducting
his/her/their own investigation and analysis of the information contained or referred to in this document and of evaluating the merits and risks involved in the
securities forming the subject matter of this document. The projections and forecasts described in this report were based upon a number of estimates and
assumptions and are inherently subject to significant uncertainties and contingencies. Projections and forecasts are necessarily speculative in nature, and it can
be expected that one or more of the estimates on which the projections and forecasts were based will not materialize or will vary significantly from actual results,
and such variances will likely increase over time. All projections and forecasts described in this report have been prepared solely by the authors of this report
independently of the Company. These projections and forecasts were not prepared with a view toward compliance with published guidelines or generally
accepted accounting principles. No independent accountants have expressed an opinion or any other form of assurance on these projections or forecasts. You
should not regard the inclusion of the projections and forecasts described herein as a representation or warranty by VSL, its associates, the authors of this
report or any other person that these projections or forecasts or their underlying assumptions will be achieved. For these reasons, you should only consider the
projections and forecasts described in this report after carefully evaluating all of the information in this report, including the assumptions underlying such
projections and forecasts. The price and value of the investments referred to in this document/material and the income from them may go down as well as up,
and investors may realize losses on any investments. Past performance is not a guide for future performance. Future returns are not guaranteed and a loss of
original capital may occur. Actual results may differ materially from those set forth in projections. Forward-looking statements are not predictions and may be
subject to change without notice. We do not provide tax advice to our clients, and all investors are strongly advised to consult regarding any potential
investment. VSL, the RA involved in the preparation of this research report and its associates accept no liabilities for any loss or damage of any kind arising out
of the use of this report. This report/document has been prepared by VSL, based upon information available to the public and sources, believed to be reliable.
No representation or warranty, express or implied is made that it is accurate or complete. VSL has reviewed the report and, in so far as it includes current or
historical information, it is believed to be reliable, although its accuracy and completeness cannot be guaranteed. The opinions expressed in this
document/material are subject to change without notice and have no obligation to tell you when opinions or information in this report change. This report or
recommendations or information contained herein do/does not constitute or purport to constitute investment advice in publicly accessible media and should not
be reproduced, transmitted or published by the recipient. The report is for the use and consumption of the recipient only. This publication may not be distributed
to the public used by the public media without the express written consent of VSL. This report or any portion hereof may not be printed, sold or distributed
without the written consent of VSL. This document does not constitute an offer or invitation to subscribe for or purchase or deal in any securities and neither this
document nor anything contained herein shall form the basis of any contract or commitment whatsoever. This document is strictly confidential and is being
furnished to you solely for your information, may not be distributed to the press or other media and may not be reproduced or redistributed to any other person.
The opinions and projections expressed herein are entirely those of the author and are given as part of the normal research activity of VSL and are given as of
this date and are subject to change without notice. Any opinion estimate or projection herein constitutes a view as of the date of this report and there can be no
assurance that future results or events will be consistent with any such opinions, estimate or projection. This document has not been prepared by or in
conjunction with or on behalf of or at the instigation of, or by arrangement with the company or any of its directors or any other person. Information in this
document must not be relied upon as having been authorized or approved by the company or its directors or any other person. Any opinions and projections
contained herein are entirely those of the authors. None of the company or its directors or any other person accepts any liability whatsoever for any loss arising
from any use of this document or its contents or otherwise arising in connection therewith. The information contained herein is not intended for publication or
distribution or circulation in any manner whatsoever and any unauthorized reading, dissemination, distribution or copying of this communication is prohibited
unless otherwise expressly authorized. Please ensure that you have read “Risk Disclosure Document for Capital Market and Derivatives Segments” as
prescribed by Securities and Exchange Board of India before investing in Securities Market.
Ventura Securities Limited
Corporate Office: C-112/116, Bldg No. 1, Kailash Industrial Complex, Park Site, Vikhroli (W), Mumbai – 400079