Industria Agroalimentaria Francia EULER HERMES / SOLUNION nov15
•
1 like•219 views

French agrifood industry: Investment and exports as future bread and butter

Recommended
Recommended
More Related Content
What's hot
What's hot (20)
Viewers also liked
Viewers also liked (20)
Similar to Industria Agroalimentaria Francia EULER HERMES / SOLUNION nov15
Similar to Industria Agroalimentaria Francia EULER HERMES / SOLUNION nov15 (20)
More from Jaime Cubillo Fleming
More from Jaime Cubillo Fleming (20)
Recently uploaded
Recently uploaded (20)
Industria Agroalimentaria Francia EULER HERMES / SOLUNION nov15
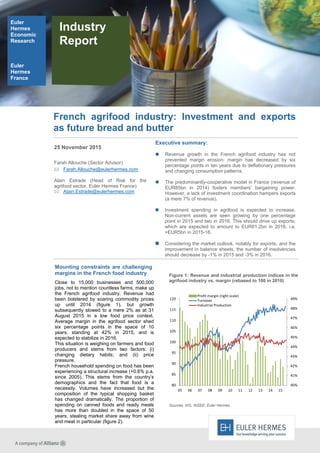
- 1. 25 November 2015 Farah Allouche (Sector Advisor) Farah.Allouche@eulerhermes.com Alain Estrade (Head of Risk for the agrifood sector, Euler Hermes France) Alain.Estrade@eulerhermes.com French agrifood industry: Investment and exports as future bread and butter Euler Hermes Economic Research Euler Hermes France Industry Report Figure 1: Revenue and industrial production indices in the agrifood industry vs. margin (rebased to 100 in 2010) 40% 41% 42% 43% 44% 45% 46% 47% 48% 49% 80 85 90 95 100 105 110 115 120 05 06 07 08 09 10 11 12 13 14 15 Profit margin (right scale) Turnover Industrial Production Sources: IHS, INSEE, Euler Hermes Executive summary: Revenue growth in the French agrifood industry has not prevented margin erosion: margin has decreased by six percentage points in ten years due to deflationary pressures and changing consumption patterns. The predominantly-cooperative model in France (revenue of EUR85bn in 2014) fosters members’ bargaining power. However, a lack of investment coordination hampers exports (a mere 7% of revenue). Investment spending in agrifood is expected to increase. Non-current assets are seen growing by one percentage point in 2015 and two in 2016. This should drive up exports, which are expected to amount to EUR61.2bn in 2016, i.e. +EUR5bn in 2015-16. Considering the market outlook, notably for exports, and the improvement in balance sheets, the number of insolvencies should decrease by -1% in 2015 and -3% in 2016. Mounting constraints are challenging margins in the French food industry Close to 15,000 businesses and 500,000 jobs, not to mention countless farms, make up the French agrifood industry. Revenue had been bolstered by soaring commodity prices up until 2014 (figure 1), but growth subsequently slowed to a mere 2% as at 31 August 2015 in a low food price context. Average margin in the agrifood sector shed six percentage points in the space of 10 years, standing at 42% in 2015, and is expected to stabilize in 2016. This situation is weighing on farmers and food producers and stems from two factors: (i) changing dietary habits; and (ii) price pressure. French household spending on food has been experiencing a structural increase (+0.6% p.a. since 2005). This stems from the country’s demographics and the fact that food is a necessity. Volumes have increased but the composition of the typical shopping basket has changed dramatically. The proportion of spending on canned foods and ready meals has more than doubled in the space of 50 years, stealing market share away from wine and meat in particular (figure 2).
- 2. 2 Figure 2: Shifting dietary habits, changing household shopping baskets (% of total food spending) 1% 2% 3% 2% 3% 4% 14% 12% 7% 9% 5% 5% 0% 2% 4% 6% 8% 10% 12% 14% 16% 1960 1985 2015(f) Ready meals Canned food Fresh meat Wine Sources: INSEE, Euler Hermes Figure 3: Price trends in different retail channels (%, year on year) Sources: DGCCRF, Nielsen, Euler Hermes Figure 4: Breakdown of final food consumption in terms of the induced value added for EUR 100 of food spending (in euros) 10.6 8.3 8.1 7.7 12.0 11.3 10.4 10.1 0 10 20 30 40 50 60 70 80 90 100 00 05 10 15(f) Taxes Final imports Intermediate imports Transport Trade Services Other industries Agrifood Agriculture and fishing Sources: OfPM, Euler Hermes Prices bear the marks of deflationary pressures: retail prices for food products were down by 2% at the end of June compared with the prior year (figure 3). Coming on top of the price effect, value added has slipped across the entire value chain, at the expense of agriculture, livestock farming and processing. For instance, between 2000 and 2015, farmers and processing companies lost respectively EUR 3 and EUR 2 of the value added induced by EUR 100 of food spending (figure 4). A considerable proportion of value creation has shifted over to downstream activities (e.g. services and retail). Unless the agrifood industry makes dramatic changes in order to recapture this value added, everything points to a continuation of this trend. Coordination is much-needed to grow exports Inadequate integration is one of the reasons often cited to explain the problems in this sector. However, integration is characterized as the extent of cooperation between those involved in the different stages of the production process, with activities that complement each other (horizontal and vertical integration). Yet, the predominance of the cooperative model in France – with upwards of 3,000 cooperatives being registered, representing one in three brands – clearly shows that the French agrifood industry is integrated. In their objective to secure and share the production tool for all members, which will enjoy greater market clout and bargaining power in an intensively-competitive market, cooperatives generated close to EUR85bn in revenue in 2014. However, while the cooperative model is very effective in protecting its members, particularly in periods of crisis, their method of governance and business model make it difficult for them to expand their market share in exports (which account for just 7% of total revenue) or to raise capital other than via traditional bank lending channels (e.g. through private equity and the financial markets), in such a way as to speed up innovation and international expansion. Less than 20% of investments made in the agrifood sector are financed via channels other than bank loans or internal cash flows, and this percentage is even lower in the case of cooperatives. Concentration among cooperatives has thus proved inevitable: the number of small cooperatives has halved in 20 years in a bid to increase their market influence. By and large, mergers in the industry have mostly been between cooperatives but private businesses started to attract more of an interest in 2014 with a view to forming centers of expertise. It is therefore not so much a lack of cooperation but rather a difficulty in coordinating investment decisions nationwide that is dampening the potential of French agrifood exports.
- 3. 3 Figure 5: Solvency and net debt/equity ratios for agrifood businesses (%) 30% 35% 40% 45% 50% 55% 60% 65% 70% 75% 35% 37% 39% 41% 43% 45% 47% 07 08 09 10 11 12 13 14 15(f) 16(f) Solvency Debt to equity (right scale) Source: Euler Hermes Figure 6: Non-current assets of agrifood businesses (% of total assets) +1pt +2pt 35% 37% 39% 41% 43% 45% 47% 07 08 09 10 11 12 13 14 15(f) 16(f) Source: Euler Hermes Figure 7: Export percentages for agrifood businesses (% of revenue) 5% 15% 11% - 2 4 6 8 10 12 14 16 18 07 08 09 10 11 12 13 14 15(f) Micro-entreprises SMEs Total Source: Euler Hermes NB: Large Businesses are included in the Total (1) June 2015 / Survey carried out among more than 800 French businesses 2016: Return on investment in the agrifood industry, a more international tilt Investment spending in the agrifood sector has been on hold since 2012 as the focus has turned to deleveraging. The results of Euler Hermes’ Survey into Corporate Investment and Cash Reserves (1) speak volumes: the volatility of commodity prices and pressure on margins are the two main factors impeding investment by the French agrifood industry this year. Defensive investment is the priority (renewal): just 18% of the businesses surveyed said that they intended to invest in R&D. Yet, agrifood businesses have never before been as capable of investing as they are now: the sector’s average solvency ratio has returned to its highest levels at 45% in 2015 and the net debt (total debt less cash in hand) to equity ratio stands at just 65% (figure 5). There are a multitude of incentives to invest considering the relative standardization of products, the speed at which they are becoming obsolescent and the diversity of consumer aspirations (pleasure, health, ethical consumption). Euler Hermes is therefore expecting investment spending (innovation, search for markets), gauged on the basis of growth in non-current assets, to increase by one percentage point in 2015 and two in 2016 (figure 6), notably to expand export sales. This avenue cannot be overlooked since France produces more food than it consumes. The international renown of French cuisine: A fine showcase but one that is not serving everyone The agrifood industry has long been the second-largest contributor to France’s trade surplus (EUR9bn in 2014), but a handful of large companies account for the lion’s share of the export business. The percentage of exports at companies with sales in excess of EUR1.5bn is expected to stand at around 45% in 2015, whereas the average for the entire agrifood industry is just 11% (figure 7). This gulf is beginning to narrow as smaller businesses are now looking to diversify into foreign markets. However, export opportunities vary depending on the segment. The beverage, wines and spirits segment is the biggest export market, as producers have managed to offset lower volumes in the domestic market by making forays into neighboring markets (e.g. UK, Germany and Belgium), and countries farther afield. Growth in the US market averaged 7% p.a. between 2010 and 2014; and Singapore and China have registered respective increases of 10% and 6% per year. While more marginal, some partner countries harbor genuine appeal for French exports: Australia, South Korea and Niger (average annual growth of 18%).
- 4. research@eulerhermes.com 4 DISCLAIMER These assessments are, as always, subject to the disclaimer provided below. This material is published by Euler Hermes SA, a Company of Allianz, for information purposes only and should not be regarded as providing any specific advice. Recipients should make their own independent evaluation of this information and no action should be taken, solely relying on it. This material should not be reproduced or disclosed without our consent. It is not intended for distribution in any jurisdiction in which this would be prohibited. Whilst this information is believed to be reliable, it has not been independently verified by Euler Hermes and Euler Hermes makes no representation or warranty (express or implied) of any kind, as regards the accuracy or completeness of this information, nor does it accept any responsibility or liability for any loss or damage arising in any way from any use made of or reliance placed on, this information. Unless otherwise stated, any views, forecasts, or estimates are solely those of the Euler Hermes Economics Department, as of this date and are subject to change without notice. Euler Hermes SA is authorised and regulated by the Financial Markets Authority of France. © Copyright 2015 Euler Hermes. All rights reserved. Other segments such as meat and dairy produce (15% of French food exports) are faced with more restrictions, notably in relation to food safety. This makes exports more complex, costly and exposed to protectionist measures, as evidenced by the Russian embargo on certain foods, resulting in a EUR60mn loss of revenue for the French pork industry in 2014. Even so, looking at the broader picture, Euler Hermes sees French agrifood exports climbing by EUR2.3bn in 2015 (of which EUR1bn tied to the euro effect) and EUR2.7 bn in 2016, making for a total of EUR61.2 bn (figure 8). Beverages and cereals will continue to be the main drivers in 2016, whereas exports of dairy products and meat are set to remain low, albeit up slightly. Resuming investment in the agrifood industry and capturing new export market share should help remedy insolvencies in 2016 The in-depth transformation of the French agrifood industry and the need for new momentum, notably via foreign markets, has had a considerable bearing on the number of insolvencies. The pace of collective insolvency proceedings filed by agrifood businesses has increased from an annual average of 2.4% between 2000 and 2010 to 3.2% since then, notably peaking at 8% between 2012 and 2013. The combination of higher investment and a greater share of the export market should give margins a boost. Euler Hermes is expecting the number of insolvencies to decrease by 1% in 2015 and 3% in 2016, implying 2,590 and 2,520 filings respectively (figure 9). However, this will still not be enough to return to the pre- crisis level, which was 20% lower. Figure 8: French exports by product type (in millions of euros) 10000 20000 30000 40000 50000 60000 05 06 07 08 09 10 11 12 13 14 15(f) 16(f) Meat Processed, cereal based Dairy Cereals Beverages, wines, spirits Other 59 408 61 190 Sources: ITC, Euler Hermes Figure 9: Collective insolvency proceedings (number) Sources: National data, Euler Hermes France