1. Department of Economics
George Washington Carver Internship Program
July 29, 2016
Jade Harrison, University of Central Missouri
Acknowledgements: Dr. Georgeanne Artz, Assistant Professor, Department of Economics, Iowa State University, The George Washington Carver Internship Program
Will Organics Flood the Market? A Comparison of Organic Versus Conventional Price Cost Margins
Rationale
• The need for organic farming operations increases as
more consumers prefer organic food products
• Understanding the future of organic commodity
markets can help policy makers ensure that more
organic farms exist to meet the demand for organic
products
Data
• Price cost margins were calculated for organic and
conventional operations’ corn, soybeans, and alfalfa
hay enterprises using data from FINBIN database
• Price cost margin is the difference between price (p)
and marginal cost (mc) as a fraction of price, that is:
(p-mc)/p
• Average yields, costs, and prices received were
collected from the FINBIN data in three year intervals
from 1993 to 2015 for both organic and conventional
corn, soybean, and alfalfa
• Total number of USDA certified organic acres was
found on the U.S. from USDA’s Economic Research
Service website
• Regression analysis was used to explain the variation
in price cost margins
The basic empirical model:
PCM𝑖,𝑡 = α + β𝑜𝑟𝑔𝑎𝑛𝑖𝑐𝑖,𝑡 + δ𝑗
𝑗=2
7
𝑡𝑖𝑚𝑒𝑗 + 𝛿 𝑘
𝑘=2
8
𝑠𝑖𝑧𝑒 𝑘 + 𝜀𝑖,𝑡
Key Findings
• On average, price cost margins for organic producers
were higher than conventional for corn and soybeans
• The organic advantage is about 2.5 times larger than
conventional margins for soybeans
• For corn, the average price cost margin for conventional
production in the base year and base size was negative.
These estimates in the model imply that organic price
cost margins are on average much larger than
conventional
• The regression analysis in figure 2 shows an expected
decrease in price cost margins for corn as organic acres
increase
• The coefficient in figure 2 implies that a 1000-acre
increase in certified organic crop acres would result in a
0.001 cent decline in price cost margins for organic corn
• The results in Figure 1 show the price cost margins
generally increase with size
Conclusions
• Organic crops may have higher price cost margins
because consumers are willing to pay a higher price for
organic products that cannot be substituted with
conventional products
• Unless the amount of organic farmland increases
exponentially, organic farmers will continue to see
benefits from higher price premiums
• Slow adoption rate of organic operations and faster
growth in demand could possibly explain the slow
decrease in price cost margins over time
• Future agricultural policy could increase financial
support for larger farms to transition or help smaller
organic farms expand in order to achieve the cost
savings associated with scale and make organic farming
profitable
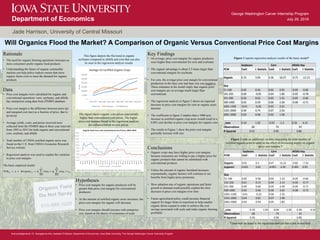
Figure 1 reports regression analysis results of the basic model*
Figure 2 adds an additional variable measuring the total number of
certified organic acres to analyze the effect of increasing supply on organic
price-cost margins *
This figure depicts the flat trend in organic
soybeans compared to alfalfa and corn that can also
be seen in the regression analysis results.
This figure shows organic corn prices consistently
higher than conventional corn prices. The higher
price cost margins found in the regression analysis
are reflected below in corn prices.
*Time was included in the regression analysis but is not shown here
Soybeans Corn Alfalfa Hay
PCM Coef. t Statistic Coef. t Statistic Coef. t Statistic
Organic 0.15 3.94 0.36 18.37 -0.73 -12.13
Size
51-100 0.02 0.56 0.02 0.95 -0.05 -0.82
101-250 0.00 -0.05 0.04 1.86 -0.05 -0.78
251-500 0.03 0.62 0.05 1.91 -0.05 -0.66
500-1000 0.02 0.39 0.06 2.28 -0.08 -0.71
1001-1500 -0.01 -0.26 0.05 2.01
1501-2000 0.04 0.74 0.07 2.56
2001-5000 0.03 0.46 0.05 1.58
_cons 0.10 1.92 -0.03 -1.3 0.36 4.14
Observations 68 74 43
R-Squared 0.53 0.95 0.86
Soybeans Corn Alfalfa Hay
PCM Coef. t Statistic Coef. t Statistic Coef. t Statistic
Organic 0.02 0.3 0.47 15.22 -0.82 -7.25
orgacre1 0.001 2.02 -0.001 -4.26 0.001 0.93
Size
51-100 0.02 0.58 0.02 1.14 -0.05 -0.82
101-250 0.01 0.13 0.04 2.14 -0.05 -0.77
251-500 0.04 0.69 0.05 2.49 -0.05 -0.71
500-1000 0.02 0.46 0.06 2.65 -0.08 -0.72
1001-1500 -0.01 -0.22 0.06 2.35
1501-2000 0.04 0.81 0.07 2.98
2001-5000 0.03 0.49 0.05 1.85
_cons 0.10 1.93 -0.04 -1.56 0.36 4.14
Observations 68 74 43
R-Squared 0.56 0.96 0.86
Hypotheses
• Price cost margins for organic producers will be
greater than price cost margins for conventional
producers
• As the amount of certified organic acres increases, the
price-cost margins for organic will decrease
• Price cost margins should increase with enterprise
size, based on the theory of economies of scale