Communities Creating Racial Equity Case Studies Final Report
UGRA Symposium poster
1. A STUDY OF PUBLIC ENGAGEMENT
COMPARISON OF PUBLIC ENGAGEMENT PREFERENCES OF URBAN AND SUBURBAN
RESIDENTS IN A LOCAL COMPREHENSIVE PLANNING PROCESS IN KANSAS, US
Lead by: Jacqueline Wells Faculty Mentor: Ward Lyles, Ph.D. Funded by: Center for Undergraduate Research
INTRODUCTION
Every neighborhood is different. How a neighborhood is built,
where it is in space and the people who live there are all defining
characteristics. The objectives of this research are to learn
whether those characteristics play a significant part in a residents
participation and prefrences in the public engagement process.
Public engagement is a key aspect of the planning process. With
a better understanding of how residents prefer to be involved in
planning for their community’s future, planners are better able to
involve them in the process. When every resident is represented in a
plan, it best reflects the community’s needs and has the most lasting
effects.
John Randolph, (2011), has identified the evolution of public
engagement as having four generations. Randolph’s four generations
of public engagement best practices are based on Sherry Arnstein’s
Ladder of Participation. In the charts below are the four generations
compared to the public engagement methods utilized by the City of
Lawrence in the revision process of the comprehensive plan, Horizon
2020.
First Generation Public Engagement Techniques Utilized by the
City of Lawrence in the Revision Process of Horizon 2020
Technique Technique Utilized by the City
of Lawrence
Media Public meetings and open
forums were publicized
through the local newspaper,
the Lawrence Journal World
Public Meetings Nine open houses were held
between April and July 2014.
Surveys, Polls, Brochures Surveys were completed in
person at open forums, online
and mailed in
Second Generation Public Engagement Techniques Utilized by
the City of Lawrence in the Revision Process of Horizon 2020
Technique Technique Utilized by the City
of Lawrence
Workshops Public Forums were held on
November 5th and 12th of
2014.
Focus Groups
Advisory Committees A ten person committee is
in place to identify issues of
importance, educate the public
and review drafts and the final
plan
Conflict Resolution Techniques
Third Generation Public Engagement Techniques Utilized by the
City of Lawrence in the Revision Process of Horizon 2020
Technique Technique Utilized by the City of
Lawrence
Stakeholder Collaboration Stakeholders were identified and
invited to public meetings
Partnership
Consensus Building
Fourth Generation Public Engagement Techniques Utilized by the
City of Lawrence in the Revision Process of Horizon 2020
Technique Technique Utilized by the City of
Lawrence
Learning Networks
Joint Fact Finding
Electroning Networks The City of Lawrence manages
a Facebook, Twitter and offers
an email list-serv for updates on
the Horizon 2020 process and
an email for residents to offer
comments, ideas and questions
Open Source/Crowd Sourcing
Design Charrette
Comanagement
EVALUATION OF METHODS
In addition to low participation rates, participation
through out the Lawrence community is not equal.
According to Lawrence planning staff, residents who
participate the most live in central, older parts of town.
The central, older areas in Lawrence are dominated
by urban neighborhoods while the surrounding
neighborhoods are suburban. Thus, my central research
question is: Is land use associated with preferences for
public engagement?
In order to determine whether land use is associated
with preferences for public engagement, an urban
(Old West Lawrence) and a suburban (West Lawrence)
neighborhood were chosen to survey.
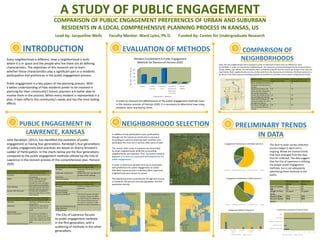
The selection process controlled for the age and income
of residents, the percent minority population and the
population density.
NEIGHBORHOOD SELECTION
COMPARISON OF
NEIGHBORHOODS
Next, the two neighborhoods were analyzed in order to determine if there land use differences were
quantifiable. In order to measure the neighborhoods, the measures of sprawl developed by Yan Song and Gerrit
Knaap, (2004), was utilized. The calculations were completed using GIS and the results are shown in the map and
chart below. Both neighborhoods are very similar aside from the measurement of density. Old West Lawrence is
far denser than West Lawrence leading to greater accessibility to amenities such as parks, shopping and transit.
Engagement Preferences in Old West Lawrence
LJ World Neighborhood Discussion Electronic Sources Other
Engagement Preferences in WestLawrence
LJ World Neighborhood Discussion Electronic Sources Other
0 2 4 6 8 10 12
Attended multiple events
Attended one event
Completed an online survey
Not involved
Other
Involvementin Revision of Horizon 2020
Old West Lawrence West Lawrence
0
5
10
15
20
25
30
email online focus
group
social media civic education
series
other
Engagement Method Preferences
Old West Lawrence West Lawrence
Old West Law-
rence
West Law-
rence
Size of Sample 26 15
Age 55 61
Length of Resi-
dency
16 years 12 years
Percent Male 50% 60%
Percent Home-
owner
90% 90%
1
PUBLIC ENGAGEMENT IN
LAWRENCE, KANSAS
2 4
3 5
PRELIMINARY TRENDS
IN DATA
6
0
50
100
150
200
Survey Public
Forums
Email List
Serv
Email For
Comments,
Questions,
Concerns
Social
Media
NumberofResidents
Engagement Method
Resident Involvementin Public Engagement
Methods for Revision of Horizon 2020
In order to measure the effectiveness of the public engagement methods used
in the revision process of Horizon 2020, it is necessary to determine how many
residents were reached by them.
The City of Lawrence focuses
its public engagement methods
in the first generation, with a
scattering of methods in the other
generations.
Selection Criteria West Lawrence Cumulative
Neighborhood Area
Old West Lawrence Cumula-
tive Neighborhood Area
Blocks: the fewer the blocks
the greater the internal con-
nectivity
.17 .17
Internal Connectivity: the
higher the ratio, the greater
the internal connectivity
.72 .97
Lot Size: the smaller the lot
size, the higher the density.
.23 .13
Single Family Dwelling Unit
Density:the higher the ratio,
the higher the density
.92 2.7
Mix Actual: the higher the
ratio, the greater the land
use mix.
.06 .07
The door to door survey collection
process began in April and is
ongoing. Below are several trends
that have emerged from the data
thus far collected. The data suggest
that the City of Lawrence is utilizing
the proper public engagement
methods, but is not adequately
advertising these methods to the
public.