Call for Papers - African Journal of Biological Sciences, E-ISSN: 2663-2187, ...
UNIT 2.pptx
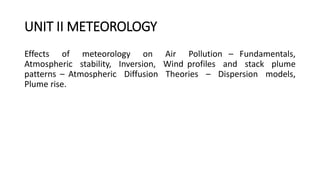
1. UNIT II METEOROLOGY
Effects of meteorology on Air Pollution – Fundamentals,
Atmospheric stability, Inversion, Wind profiles and stack plume
patterns – Atmospheric Diffusion Theories – Dispersion models,
Plume rise.
2. What is meteorology?
• a science that deals with the atmosphere and its phenomena and
especially with weather and weather forecasting studied the
principles of meteorology.
• The branch of science that allows a weatherman to predict what the
weather will be like in the future is an example of meteorology.
3. What is meteorology a study of?
• Meteorology is the study of the atmosphere, atmospheric
phenomena, and atmospheric effects on our weather.
• The atmosphere is the gaseous layer of the physical
environment that surrounds a planet.
4. Uses of Meteorology
• Meteorologists study and predict weather and climate.
• Meteorology focuses on the lower parts of the atmosphere, primarily
the troposphere, where most weather takes place.
• Meteorologists use scientific principles to observe, explain, and
forecast our weather.
• They often focus on atmospheric research or operational weather
forecasting.
• They analyze the relationship between the weather and other
environmental processes and observe the impact of weather and
climate on people, animals, and plants.
5. Effects of meteorology on Air Pollution
• Air movements influence the fate of air pollutants. So any study of air
pollution should include a study of the local weather patterns
(meteorology).
• If the air is calm and pollutants cannot disperse, then the
concentration of these pollutants will build up.
• On the other hand, when strong, turbulent winds blow, pollutants
disperse quickly, resulting in lower pollutant concentrations.
6. Meteorological data helps:
• Identify the source of pollutants.
• Predict air pollution events such as inversions and high-pollutant
concentrations days.
• Simulate and predict air quality using computer models.
7. • When studying air quality, it is important to measure the following
factors as they can help us understand the chemical reactions that
occur in the atmosphere:
• Wind speed and direction
• Temperature
• Humidity
• Rainfall
• Solar radiation
8. Wind speed and direction
• When high pollutant concentrations occur at a monitoring station,
wind data records can determine the general direction and area of
the emissions.
• Identifying the sources means planning to reduce the impacts on air
quality can take place.
• An instrument called an anemometer measures wind speed. At our
monitoring stations, the type of anemometer we use is a sonic
anemometer (Speed and direction).
9.
10. • Temperature
• Measuring temperature supports air quality assessment, air quality modelling
and forecasting activities.
• Humidity
• The amount of water vapour in the atmosphere is highly variable—it depends
on geographic location, how close water bodies are, wind direction and air
temperature. Relative humidity is generally higher during summer when
temperature and rainfall are also at their highest.
• Rainfall (A common method to measure rainfall is to use a tipping bucket rain
gauge)
• Solar radiation
• It is important to monitor solar radiation for use in modelling photochemical
smog events (Cloudiness of the sky, time of day and geographic location all
affect sunlight intensity)
• An instrument called a pyranometer measures solar radiation from the output
of a silicon cell sensor.
14. Methods for Measurement of Meteorological
Variables
• Wind Direction Recorder
• Wind speed recorder
• Temperature measurement
• Solar radiation measurement
16. Wind Direction Aloft
• Pilot Balloons (Pibals)
• Tetroons
• Kite Balloons
• Radio and Radar
• Smoke trails
17.
18.
19.
20. Mixing Height
• The mixing height is the height of vertical mixing of air and suspended
particles above the ground.
• This height is determined by the observation of the atmospheric
temperature profile.
21. Atmospheric Turbulence
• Atmospheric turbulence is caused by a number of factors including
convective currents, wind shear, and airflow over obstacles.
• Atmospheric turbulence can significantly affect power performance of
wind energy and also impacts wind turbine loads as well as wake
effects, and noise propagation.
22.
23. Precipitation (a deposit on the earth of hail, mist, rain,
sleet, or snow also : the quantity of water deposited)
24.
25.
26.
27.
28.
29.
30. Lapse Rate
• The lapse rate is the rate at which an atmospheric variable, normally
temperature in Earth’s atmosphere, changes with altitude.
31. Types of lapse rate
• Adiabatic lapse rate (ALR)
• Dry adiabatic lapse rate (9.8 °C/1000 m)
• Wet adiabatic lapse rate (3.6 – 5.50 C/1000m)
• Ambient or prevailing lapse rate (≈6°C/1000 m)
• Super adiabatic (hotter part having a lesser density )
• Sub adiabatic (With the hotter part having greater
density)
33. Inversion
• Temperature actually increases with altitude near the ground before
it begins to decrease with altitude. This results in warm, low-density
air riding on top of cool high density air: a very stable air column that
traps pollution near the ground
• Types of Inversion
• Radiation Inversion
• Subsidence Inversion
• Double Inversion (Sometimes both occur simultaneously)
34.
35.
36.
37. Radiation Inversion
• Radiation inversions generally happen in places where it cools off a
lot at night. During the night, the ground cools off, radiating the heat
to the sky. Hence, an inversion.
38.
39. Subsidence Inversion
• A subsidence inversion is sinking air that produces an inversion. When
air sinks then it warms adiabatically at the dry adiabatic lapse rate. A
situation in which this can occur is within a warm core high pressure
system. It can also occur on the lee side of a mountain range.
40.
41. Atmospheric Stability
• Stability – Ability to resist vertical motion
• Affects dispersion of pollutants.
• Developed for use in dispersion models.
• Stability classified into classes (A – F)
A. Strongly unstable
B. Moderately unstable
C. Slightly unstable
D. Neutral
E. Slightly stable
F. Moderately stable
42. Plume
• Plume refers to the path and extent in the atmosphere of the gaseous
effluents released from a source, usually a stack.
44. Fanning plume
• Formed at extreme inversion conditions owing to a negative lapse
rate.
• When the environment is under conditions of inversion, a stable
environment occurs just above the stack, and the plume moves
horizontally rather than upwards.
• Occurs more frequently when there is less turbulence.
• For high stack, fanning is considered a favorable meteorological
condition as it doesn’t cause ground pollution.
45. Fanning
• Occurs under large negative lapse rate.
• Strong inversion at a considerable distance above the stack.
• Extremely stable atmosphere
• Little turbulence
• If plume density is similar to air, travels downwind at approximately same
elevation
46.
47. Looping plume
• The wavy looping plume arises in a super adiabatic environment (ELR>ALR),
resulting in a very unstable atmosphere due to rapid mixing.
• In an unstable atmosphere, rapid vertical air motions occur both upward
and downward, resulting in a looping plume.
• As a result, large pollution concentrations may arise near the ground.
• It is common in the afternoon. Moderate and strong winds are formed on
sunny days creating unstable conditions.
• It is a type of plume which has a wavy character.
• It occurs in a highly unstable atmosphere because of rapid mixing.
• It exists for several hours.
48.
49. Looping
• High degree of convective turbulence.
• Super adiabatic lapse rate – strong instabilities.
• Associated with clear daytime conditions accompanied by strong solar
heating and light winds.
• Occurs in unstable atmospheric conditions.
50.
51. Coning plume
• Formed when horizontal wind velocity exceeds 32 km/h and cloud
blocks solar radiation during the day and terrestrial radiation during
the night.
• There is little vertical mixing.
• The environment is slightly unstable under sub-adiabatic conditions
(ELR<ALR).
• The plume shape is vertically symmetrical about the plume line.
52. Coning
• Stable with small-scale turbulence
• Associated with overcast moderate to strong winds
• Pollutants travel fairly long distance before reaching ground level in
significant amounts
• Occurs in neutral atmospheric conditions
53.
54. Lofting Plume
• Lofting plume is produced by a strong super adiabatic lapse rate
immediately above the stack and a negative lapse rate (inversion)
immediately below the stack opening.
• The downward movement is stopped by inversion.
• This results in a very rapid and turbulent upward mixing of the plume.
But the downward mixing is less.
• As a result, the dispersion of pollutants becomes quick, and pollutants
cannot come down to the ground.
• Such a plume is good for dispersing air contaminants and providing
significant protection to living beings.
55. Fumigating Plume
• The fumigant plume is the exact opposite of the lofting plume.
• Pollutants cannot escape above the stack under these conditions,
thus they settle towards the ground due to turbulence and mixing.
• As a result, the dispersion of contaminants in a fumigant plume is
exceedingly poor.
56. Fumigation
• Most dangerous plume: contaminants are all coming down to ground
level.
• They are created when atmospheric conditions are stable above the
plume and unstable below.
• This happens most often after the daylight sun has warned the
atmosphere, which turns a night time fanning plume into fumigation
for about a half an hour.
57. Trapping Plume
• Plume trapping occurs when a plume is emitted into a shallow layer
of unstable air capped by a deep lid of stable air. This condition is
frequent on overcast spring days.
• This plume isn’t optimal for pollution dispersion since it can’t go past
a particular height.
58. Trapping
• When the inversion layer exists above the stack and as well as below
the stack, the plume neither goes up nor goes down, rather it gets
trapped between these two inversion layers.
• This plume is not ideal for dispersion of pollutants as it cannot go
above a certain height.
59.
60.
61.
62. Wind profiles and stack plume patterns
• The dispersion of emitted gases from the source of their production is
known as plume.
• The source is known as stack (chimney).
• The behavior of a plume from any stack depends on localized air stability.
• The geometric forms of stack plumes are the function of the vertical
temperature and wind profiles or vice versa.
• The behavior and dispersion of a plume entirely depend on the
environmental lapse rate influencing the plume behavior are the seasonal
variations in the atmospheric stability and the long term variations which
occur with change in seasons.
63. Wind profile power law
• The wind profile power law is a relationship between the wind speeds
at one height, and those at another.
• The wind profile power law relationship is:
• Limits
• The wind profile of the atmospheric boundary layer (surface to
around 2000 metres) is generally logarithmic in nature and is best
approximated using the log wind profile equation that accounts
for surface roughness and atmospheric stability.
64. Air pollution dispersion
• Air pollution dispersion is the pollution of air dispersed into the
atmosphere.
• Air pollution is the introduction of particulates, biological molecules,
or other harmful materials into Earth’s atmosphere, causing disease,
death to humans, damage to other living organisms such as food
crops or the natural or built environment.
• Air pollution may come from anthropogenic or natural sources.
Dispersion refers to what happens to the pollution during and after its
introduction: understanding this may help in identifying and
controlling it.
65. Air pollution dispersion
• Air pollution has become the focus of environmental conservationists
and governmental environmental protection agencies (local, state,
province and national) of many countries (which have adopted and
used much of the terminology of this field in their laws and
regulations) regarding air pollution control.
66. Dispersion modeling
• Dispersion is the process of spreading out the emission over a large
area thereby reducing the concentration of the pollutants.
• Plume dispersion is in two dimensions:
• Horizontal and vertical.
• It is assumed that the greatest concentration of the pollutants is on
the plume centerline in the direction of the prevailing wind.
• The further the away from the centerline the lower the
concentration.
67. Air Quality Modeling (AQM) / Plume
dispersion models
• Predict pollutant concentrations at various locations around the
source.
• Identify source contribution to air quality problem.
• Assess source impacts and design control strategies.
• Predict future pollutants concentrations from sources after
implementation of new regulatory programs.
68.
69. Air Quality Modelling (AQM)
• Mathematical and numerical techniques are used in AQM to simulate
the dispersion of air pollutants.
• Modeling of the dispersion of pollutants
• Toxic and odorous substances
• Single or multiple points
• Point, Area, or Volume sources
• Input data required for Air Quality Modeling
• Source characteristics
• Meteorological conditions
• Site and surrounding conditions
70. Ambient Air Concentration Modeling
• Types of Pollutant Sources
• Point Sources
• E.g., Stacks or vents
• Area Sources
• E.g., Landfills, ponds, storage piles
• Volume Sources
• E.g., Conveyors, structures with multiple vents
71. Factors Affecting Dispersion of Pollutants in
the Atmosphere
• Source Characteristics
• Emission rate of pollutant
• Stack height
• Exit temperature of the gas
• Stack diameter
• Meteorological Conditions
• Wind velocity
• Wind direction
• Ambient temperature
• Atmospheric stability
72. Plume dispersion model
• Plume dispersion model also referred as air quality model.
• It is a mathematical relationship between emissions and air quality that
incorporates the transport, dispersion and transformation of pollutants
emitted into the air.