1. A149_e
Testing station
ICONNECT / optoNCDT
Test rig for pneumatic actuator
As an alternative to hydraulic cylinders, the company System set-up
Festo has developed a so-called muscle (Fluidic On the test rig a laser-based optical sensor of the
muscle), which is intended to compensate for the series optoNCDT 2200 from Micro-Epsilon is fitted
inadequacies of hydraulic cylinders. A muscle does which acquires the contraction of the muscle. A force
not consist of metal, but rather of a rubber-based transducer measures the forces arising, whereas a
material. It has the shape of a tube and is closed off at pressure transducer is inserted in the tube to deter-
both ends. One end is firmly anchored as with a mine the pressure. The software has been develo-
hydraulic cylinder, the other end is fastened to the ped with ICONNECT and consists of over 200
moving object. If the hose is filled with compressed modules. These three signals are read into
air, it is drawn in and therefore becomes shorter. ICONNECT via a measurement card. Since the
Similarly, it also applies a force to the object to be dynamic system response is of the order of a few Hz,
moved. a sampling rate of 1000 Hz is selected. The block size
To test the muscles a test rig has been developed by is 256 values.
Micro-Epsilon in cooperation with Festo in order to
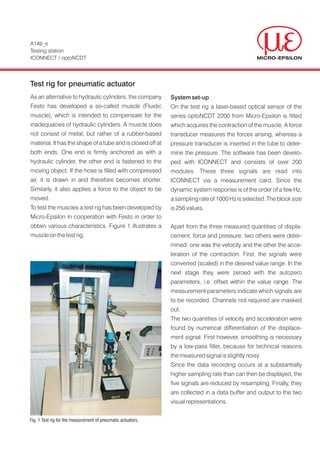
obtain various characteristics. Figure 1 illustrates a Apart from the three measured quantities of displa-
muscle on the test rig. cement, force and pressure, two others were deter-
mined: one was the velocity and the other the acce-
leration of the contraction. First, the signals were
converted (scaled) in the desired value range. In the
next stage they were zeroed with the autozero
parameters, i.e. offset within the value range. The
measurement parameters indicate which signals are
to be recorded. Channels not required are masked
out.
The two quantities of velocity and acceleration were
found by numerical differentiation of the displace-
ment signal. First however, smoothing is necessary
by a low-pass filter, because for technical reasons
the measured signal is slightly noisy.
Since the data recording occurs at a substantially
higher sampling rate than can then be displayed, the
five signals are reduced by resampling. Finally, they
are collected in a data buffer and output to the two
visual representations.
Fig. 1 Test rig for the measurement of pneumatic actuators.
2. Application
In the visual display the measured and calculated In order to find and document the interesting points
values are displayed as curves, as can be seen in after the measurement, the signals can be evaluated
Figure 2. On the right side statistical values are off-line. In the off-line evaluation mode scrolling,
calculated for each signal. These are composed of skipping and zooming over the whole measurement
the minimum, maximum and mean. anywhere in the time spectrum is possible using
The display can be printed out or exported as an cursors and slide controls. In this regard the statistics
image file (JPG). The raw data can be exported in an are always updated over the current display range
Excel data base for further analysis. and it is also possible to export any section.
Test rig for pneumatic actuator
Fig. 2: Visual display of the test rig.
MICRO-EPSILON A member of micro-epsilon group.
Koenigbacher Str. 15 Tel.: 0 85 42/1 68-0 info@micro-epsilon.com Certified DIN EN ISO 9001 : 2000
94496 Ortenburg / Germany Fax: 0 85 42/1 68 90 www.micro-epsilon.com Modifications reserved Y9781149