SlideShare a Scribd company logo
1 of 15
Download to read offline
International Journal of World Policy
and Development Studies
ISSN: 2415-2331
Vol. 1, No. 1, pp: 1-15, 2015
URL: http://arpgweb.com/?ic=journal&journal=11&info=aims
1
Academic Research Publishing Group
Foreign Capital Inflow and Domestic Private Investment in
Nigeria - A Disaggregated Model
Ogbonna Innocent Chukwuka Department of Economics, Enugu State University of Science and Technology (ESUT),
Enugu State, Nigeria
1. Introduction
A consensus exists in economic literature regarding the definition of investment. Any production of capital such
as machinery, dwellings, inventories, or the net increase to existing capital represents investment. The importance of
investment can be gauged from various perspectives. First, investment is a key component of aggregate demand and
of gross national product, and is positively related with both. Second, investment is important because variations in
investment expenditures working through the accelerator are highly correlated with variations in GNP, called the
business cycle. Third, because investment expands the productive capacity, it is a major explanation of and
contribution to economic development or long run growth (Iyoha, 2004).
Investment is generally financed through domestic and/or foreign savings. While it is financed from domestic
saving in typical industrialized and advanced countries of the world, foreign savings are often used to supplement
domestic saving in the financing of investment in many developing economies. This is because domestic savings
tend to be low in a typical developing country due largely to low income and under-developed financial system. The
inadequate savings are indicative that savings will fall short of „required investment‟, that is, investment needed to
grow at a target rate. Inflow of capital representing foreign savings is required to fill the gap. Increased inflows
augment domestic savings, facilitate higher domestic capital accumulation in physical and human capital, increase
efficient use of factor inputs are and hence enhance economic growth and development (Calvo et al., 1994).
Capital inflow into Nigeria has shown some impressive outcomes since late 1990s. For instance, while inflow
was ₦4,374.72 ($544.12) in 1990, it rose to ₦74,451.17 ($3,401.15) in 1997. The figure rose astronomically in 2005
and 2012 with inflow values of ₦2,670,747.79 ($20,373.39) and ₦6,257,924.40 ($40,114.90) respectively. Average
annual inflow in the period 1986–1994 was ₦1,876.07 ($1,508.54) but rose to ₦772,347.70 ($13,729.97) in 1995 –
2012 period. As proportion of GDP, it was equally impressive as it was 7.04% in 1987, 20.64% in 2006, but fell
slightly to 19.31% in 2009. When disaggregated, inflow components were equally impressive both in value and as
ratio of GDP. Specifically, foreign direct investment (FDI), portfolio investment (PFI), and remittances (REM) was
₦2,452.8 ($610.55), ₦4,353.1 ($1,082.9), and ₦12.4 ($4.5) million in 1987, rose to ₦115,952.2 ($1,140.14),
₦51,079.1 ($502.3), ₦177,251.9 ($1,391.8) million in 2000 and further to ₦1,273,815.8 ($8,554.84), ₦70,938.5
Abstract: Foreign capital inflow (KI) is arguably a vital source of external capital, especially for developing
countries with low domestic savings rate. Investigating the trend of KI into Nigeria, we observed that as a ratio
of GDP it was 0.67% in 1979, 6.88% in 1989, 9.45% in 1999, and 19.31% in 2009. Thus, this study „Foreign
Capital Inflow and Domestic Private Investment in Nigeria – A Disaggregated Model‟ is intended to examine
the relationship among aggregate KI and domestic private investment (DPI) on one hand, and disaggregated KI
and DPI on the other in the period 1986Q1-2012Q4. Variables such as DPI, KI, three inflow components:
(foreign direct investment (FDI), portfolio investment (PFI), and remittances (REM)) and dummy are
employed. The framework of Khan (2011) which expressed DPI as a function of the explanatory variables was
modified and adopted. With coefficient of -0.021 and t-statistic of -0.968 for the first model, the results reveal
that aggregate KI has inverse but insignificant relationship with DPI in the short and long run. When
disaggregated (second model), FDI coefficient is 0.190 with t-statistic value of 3.013 indicative that the variable
has significant growth-inducing impact on DPI. The coefficients of PFI and REM are -0.017 and -0.121 with t-
statistic values of -1.105 and -4.887 respectively, suggestive that both have depressing impact on DPI. The joint
depressing impact of PFI and REM on DPI is greater than the expansionary impact of FDI on DPI. The
coefficient of dummy was found to be significantly positive in determining DPI.
Keywords: Foreign capital inflow; Foreign direct investment; Portfolio investment; Private domestic investment;
Remittances.
International Journal of World Policy and Development Studies, 2015, 1(1): 1-15
2
($489.3), and ₦2,710,252.5 ($21,075.1) million in 2009 respectively. In 1987 FDI, PFI, and REM as ratio of GDP
was 2.5, 4.5, and 0.02 respectively, while it rose to 5.1 for FDI, 14.0 for REM, while PFI fell to 0.3 in 2009.
Despite these impressive inflow figures, the Nigerian government has, secretly and publicly taken steps to
encourage private sector-led investment and growth. The government has made the regulatory as well as policy
environment simple for domestic private investment and reduced limitations on foreign investment. The
privatization of public enterprises, which was informed by the dismal performance of enterprises owned by
government in Nigeria, the establishment of free trade zones (FTZs), and the investment promotion council (IPC) are
all aimed at assigning greater importance to the more efficient and more effective private sector and its growth
potential than was the case.
Besides public enterprises and investment reforms, interest rates which hitherto had been kept low in accordance
with Keynesian investment theory were deregulated mid 1986. This deregulation, which was in tandem with
McKinnon and Shaw interest rates, savings and investment hypothesis, were intended to induce savers and hence
stimulate investment. In line with McKinnon-Shaw theory, one of the main purposes of 1986 “interest rate policy in
the monetary and credit guidelines” which has been modified periodically is the stimulation of savings and
investment. Evidence available is indicative that financial savings increased substantially since 1986. As a ratio of
GDP, it was 18.6% in 1986, rose to 32.3% in 1991, further to 39.1% in 2000 and 40.8% in 2012. However, these
impressive inflow figures and the increases in the rate of savings have failed to elicit the required improvement in
domestic private investment and hence economic growth in Nigeria. On its part, investment-GDP ratio which was
3.7% in 1987 rose marginally to 4.0% in 1994, but down to 3.3% in 2000 before rising to 7.9% in 2010.
Table-1. Trends in Aggregate Capital Inflow (KI), Domestic Private Investment (DPI), and Savings (S), (value, ratio of GDP, and growth rate), in
Nigeria (1986 – 2012)
Year
Domestic Private Investment Aggregate Capital Inflow (KI) Savings (S)
Value
($m)
%
GDP
%
Growth
Value
($m)
%
GDP
%
Growth
Value
($m)
%
GDP
%
Growth
1986 857 3.1 -8.44 857 1,36 -42.73 3858 18.62 -13.19
1987 938 3.9 9.38 938 7.04 497.66 5999 24.90 -23.57
1988 801 3.56 -14.56 801 4.11 -43.65 4712 20.25 4.46
1989 882 5.61 10.09 882 6.88 75.14 9527 39.32 2.00
1990 1836 6.00 108.28 544 1.78 -113.02 9869 32.09 38.65
1991 1380 5.03 -24.80 718 2.56 32.02 8853 32.32 -0.38
1992 1199 4.08 -13.10 3083 10.54 329.16 7850 26.79 -2.99
1993 761 4.84 -36.5 2121 13.05 -31.19 3657 23.16 16.00
1994 720 4.00 -5.30 2500 13.92 17.85 3167 17.51 -10.16
1995 1374 4.84 90.69 1812 6.44 -27.51 5378 18.84 -26.20
1996 1599 4.54 16.38 2393 7.30 32.03 4930 14.09 18.10
1997 1772 4.97 10.82 3401 8.84 42.16 5395 15.06 8.84
1998 1462 4.57 -17.49 2588 7.51 -23.91 5856 1.83 -5.06
1999 1395 3.89 -4.58 2317 9.45 -10.47 6781 18.90 -2.93
2000 1546 3.33 10.82 3034 7.41 30.96 18142 39.11 17.03
2001 1573 3.56 1.72 3139 7.14 3.46 7361 16.68 -21.71
2002 2524 4.26 60.42 3289 5.79 4.79 9203 15.57 20.34
2003 3886 5.74 53.96 3251 4.74 -0.12 9655 14.27 50.14
2004 3832 4.37 -1.39 4324 5.25 33.01 16932 19.27 -24.00
2005 3493 3.14 -8.85 20373 18.08 371.20 20241 18.03 -10.46
2006 6840 4.72 95.82 23556 20.64 15.62 43465 29.89 59.39
2007 9099 5.44 33.03 25493 15.32 8.22 20391 12.25 41.73
2008 10408 4.99 14.38 26449 12.78 3.75 48111 23.12 -0.73
2009 12723 7.51 22.23 30117 19.31 13.87 20048 11.83 34.77
2010 15593 7.94 22.60 31058 13.67 3.12 49856 21.72 18.33
2011 15028 6.10 -3.60 22413 9.46 -27.83 65893 26.82 -10.80
2012 13296 5.32 -11.5 40115 15.55 28.98 107066 40.77 -19.89
Source: Plotted by the Author based on the Data from African Development Report (2009) and World Development Indicators (WDI) 2012
From table 1, the relationship between DPI growth and KI is not clear. For instance, in 1987, KI growth was
497.7% while DPI growth was 4.6%. But by 1990, the growth rate of KI fell to a negative figure of 113% while DPI
instead rose to 6.2%. The unclear trend is also observable in 1995 where KI growth was negative at 27.5% but DPI
growth rose to 11.1%. In 2005 KI grew by 371.2% and expectedly DPI also grew by 13.4%, but when KI growth
fell to 13.9% in 2009, that of DPI instead rose to 22.2%. The same unclear trend characterized KI and DPI growth in
2012. It is therefore necessary to establish a relationship between DPI and KI in Nigeria.
The unimpressive private domestic investment outcome despite these reform efforts is the major reason for this
work. Cross-country evidence abound that capital inflows crowd out domestic investment, or that inflows finance
International Journal of World Policy and Development Studies, 2015, 1(1): 1-15
3
current account deficit, or that they are often used to increase the financing of foreign reserves instead of investment
in recipient economies. The overall result is that more foreign inflows into developing economies are converted into
their reserves thereby depleting savings meant for developed economies (Bos et al., 1974; Saltz, 1999).
The type of inflow into an economy is also important. Portfolio flows (equity) which appears to be
speculatively driven by short term motive in a world of unequal access to information have positive effect on
investment only in the economies with more and highly developed domestic financial systems (Hecht et al., 2004).
On its part, flows of FDI are more permanent and less volatile and have proved to be remarkably more stable even
when the host economy is in crises, suggestive of being driven by more permanent desire for economic prosperity of
recipient countries (Elitza, 2008). Workers‟ remittances or transfers from international migrants are important source
of foreign finance and exchange for recipients. They assist stabilize irregular incomes, build human and social
capital, and serve as financial support to many poor families in developing countries.
This study will disaggregate capital inflow into components and examine three types: Foreign Direct Investment
(FDI), Portfolio Investment (PFI), and Remittances (REM). This is done under two regime periods (1986-1994;
1995-2012) to ascertain their individual and joint impacts on private domestic investment in Nigeria. The sum of
these three represents capital inflow (KI) as far as this study is concerned, and the word components or types are
used interchangeably.
While several factors may have accounted for the poor response of private domestic investment, it is pertinent
and relevant to examine the determinants of private domestic investment in Nigeria using foreign capital inflow and
its components as explanatory variables of interest. So far, time series studies for Nigeria on capital inflow and
domestic private investment are hard to come by. Again, none of the few studies reviewed on capital inflow-
domestic private investment included remittances among inflow components of choice despite its impressive inflow
value and growth potentials (Ukeje and Obiechina, 2013). Hence, the objectives of this study are to evaluate the
growth-inducing impact of aggregate and disaggregated capital inflow on private domestic investment in Nigeria in
the period 1986Q1 to 2012Q4. While evidence from single equation shall be provided, the error correction
framework shall be utilized to provide evidence on the subject of interest.
2. Theoretical Literature
2.1. Investment Theory
Many theories are forwarded in the theoretical literature to clarify the changes in capital formation. Five are
briefly discussed.
2.1.1. The Flexible Accelerator Theory
Flexible Accelerator Theory originated by Koyck (1954) hypothesizes that investment depends on the rate of
interest and on the change of output. The reasoning here is that it is not the level of output that induces new net
investment but rather, it is the change in output. The presumption is that firms will need to expand their productive
capacity only if output increases, indicative that the relationship between growth of output and the level of
investment is the “accelerator principle” since it assumes that a rise in the growth rate of output – an acceleration of
output growth – is required to raise the level of investment. Hence, this variable relationship between investment
and growth in output is called the flexible-accelerator framework (Iyoha, 2004).
2.1.2. Marginal Efficiency of Capital Theory
Perhaps, the most accepted criterion for investment decisions in macroeconomic analysis was suggested by
Keynes using the marginal efficiency of capital/marginal efficiency of investment (MEC/MEI) approach.
According to Keynes (1936), a businessman will invest in, say, a machine, if he finds it profitable, that is, if it is
more profitable than buying an existing asset, say, a bond. To simplify the approach, assume that the businessman
has only two choices: invest in the machine or buy bond. If he chose to buy the machine, the decision to invest in
new machines depends on the profitability of such investment against the profitability of holding existing financial
assets. Hence, a businessman will invest in a new machine if its rate of return over cost (RROC) is greater than the
market interest rate. The RROC, which is the yield on such investment, is what Keynes called the MEC. MEC may
be defined as an internal rate or return or a yield.
Keynesian formulation using MEC suggest that investment is inversely linked to the market rate of interest.
Thus, ceteris paribus, an increase in the market rate of interest would lead to a decline in investment while a decrease
in interest rate would result in an increase in investment.
2.1.3. The Profit Theory of Investment
A major modification of the basic investment demand function suggests that investment depends both on the
rate of interest and the level of income. Thus, the hypothesis assumes that higher gross profit results in higher
generation of internal funds (higher levels of income) which are associated with increased volume of investment
while low income level and economic activity are associated with low levels of investment demand (Chirinko,
1993). Thus, this formulation brings in the role of profits and liquidity as partial determinants of investment demand
in modern economies.
International Journal of World Policy and Development Studies, 2015, 1(1): 1-15
4
2.1.4. The Two-Gap Theory of Investment
Another variant of investment theory is the two-gap model developed by McKinnon R.I. (1964) cited in Iyoha
(2004). The theory posits that development in developing countries may be constrained by the existence of two gaps
– the savings gap and the foreign exchange gap. The savings gap arises because, for a variety of reasons, domestic
savings tend to be low in the typical developing country. Thus, savings will inevitably fall short of “required
investment”, that is, investment necessary to grow at a target rate. The option to fill this gap rests with the
capacity/ability of such country to attract foreign savings. This will come in the form of capital inflow. Foreign
capital permits the developing country to invest more than it can save domestically.
Papanek (1960) has suggested that the “need for outside assistance depends on the rate of development
considered desirable and the extent to which a country can reach that rate using its own resources”. It is obvious that
capital inflow recipient country is more likely to achieve the objective of rapid economic growth if the inflow
received is effectively utilized.
Hecht et al. (2004) state that capital inflows unarguably raise investment rates in developing economies. They
argue that because savings are abundant in developed countries with high capital per worker, return on investment is
low. On the other hand, capital per worker is low and return on investment high in developing countries, but savings
are scarce. Hence, if there is free movement of capital internationally, a part of the savings of the advanced
economies would be invested in the developing economies. If this happens, investment rate would fall below the
saving rate in developed economies and rise above the saving rate in developing economies. Given freer
international capital mobility, poorer nations are expected to achieve faster economic growth and thus fast-track
economic convergence among the nations of the world.
Beneficial as they seem, the relationship between foreign capital inflow and domestic investment may equally
be negative. Singer (1950) as well as Prebisch (1968) earlier studied FDI and argued that the target economies
receive very few benefits of FDI, because these benefits are sent to the country from where FDI emanated. One point
regarding the negative impact of FDI on the host economy‟s economic growth prospects is that even though FDI
may increase the level and productivity of investment, it reduces growth rate due to input price variations and
misallocation of resources. Bos et al. (1974) identified that price distortions as a result of protectionism, reduction
in natural resources, and monopoly power are other factors that cause FDI to negatively impact on growth.
2.1.5. Financial Deepening Theory
McKinnon R. I. (1973) and Shaw (1973) equally developed modern theory on capital formation emphasizing the
need to deepen the financial system and raise the rate of interest as determinants of output growth. They opined that
if an economy was deregulated and freed from repressive conditions, savings and investment will increase and hence
output growth. Accordingly, capital formation is a positive function of real interest rate as opposed to modern
classical model. They opined that this assertion is possible because higher rate of interest leads to a rise in saving
deposits through the banks intermediary role thereby increasing the availability of investible funds, a situation
McKinnon refers to as „conduit effect‟. The shortcoming inherent on the modern classical theory is applicable to
this framework because it is different from itself.
2.2. Review of Empirical Studies for Nigeria
Nkoro and Furo (2012) empirically investigated the relationship and dynamic interaction between foreign
investment flows (aid, remittances, FDI, and foreign debt) and GDP growth in Nigeria for the period 1981-2010.
Using some econometric technique like, co-integration, variance decomposition and impulse response function, they
found that both co-integration and variance decomposition analyses support causation running both direction
between capital inflow components and economic growth. Real GDP response to a standard deviation innovation of
capital inflows appears sensitive, that is, the change appears very noticeable within the forecast period. ECM result
however, reveals a significantly positive impact of foreign aid on real GDP. Other ECM results indicate the
following on real GDP: negatively insignificant, positively significant, and negatively significant effect of
remittances, FDI, and external debt on real GDP respectively. All, except the FDI take some time before their
impacts are manifested.
Herzer et al. (2006) using a two-variable VAR framework for the period 1980-2002, found positively FDI and
economic growth relationship for Nigeria, Sri Lanka, Tunisia, and Egypt. Testing for causality relation, it was found
that a long-run bi-directional causal relationship exists between FDI and GDP for all the countries examined, that is,
causality running from FDI to GDP growth and vice versa. In examining whether FDI-growth relationship can be
sustained in Nigeria for the period 1986-2006, Okodua (2009) employed the Johansen co-integration technique and a
multivariable VAR framework within a VECM. Okodua found a long-run nexus between GDP growth and foreign
direct investment inflow. Further analysis by the author showed causality running only from FDI to GDP growth – a
one-way (unidirectional) causality.
Ogbonna et al. (2012) evaluated the nexus between foreign direct investment and economic growth in Nigeria
in the 1986 – 2010 period. Employing OLS technique and causation tests, the authors observed that although FDI
coefficient in the regression result show that 13% of variations in GDP are accounted for by a percent increase in
FDI, their relationship is statistically insignificant. The results of the causation test also reveal that causality runs
both ways – from FDI to GDP and vice versa – a two-way causality, that is, each granger cause the other. They
International Journal of World Policy and Development Studies, 2015, 1(1): 1-15
5
recommended that more sectors of the economy be deregulated so as to encourage and promote more investor
participation in the productive sector of the economy.
Ekeocha et al. (2012) examine the long run factors that determine of foreign portfolio investment (PFI) in
Nigeria for the period 1981 – 2010 using quarterly data. Applying time series analysis specifically the finite
distributed lag model on market capitalization, real exchange rate, real interest rate, real GDP and economic
globalization variables, they find that FPI is positively related with market capitalization and globalization in Nigeria
in the long run. They recommend and support the on-going efforts to sanitize the capital market as a way to attract
portfolio investors and improve the country‟s market capitalization.
Ukeje and Obiechina (2013) in their study on remittances – GDP growth relationship in Nigeria using an error
correction ECM for the period 1970-2010 found that remittances impact significantly and positively on output
growth in the long run. The duo equally reported that in the short run, previous values of remittances significantly
and positively impact on economic growth. Equally, its coefficient is appropriately signed. Their study
recommends that relevant and required infrastructural facilities be provided to attract more remittance inflows into
Nigeria through appropriate and official channels while adopting measures to encourage the remittance receivers to
utilize remittance receipts for productive investment or through domestic savings where investors will access them
for investment purposes and hence output growth.
Oduh and Urama (2012) investigated whether the end-use of remittances reduces poverty and finance growth in
an import-dependent economy like Nigeria. Using macro-econometric framework with six behavioral functions and
six identities and estimating and simulating the impact of remittance inflows on total expenditure in Nigeria, the
simulation result reveals: first, the much praised poverty-reducing impact of remittance inflow does not finance
growth for import-dependent economy as that of Nigeria. The authors blamed the results on the negative effect on
the balance of payment even though it is positively linked to private consumption and investment.
Ogbonna et al. (2014) sought to examine linkages between remittance inflows and private domestic investment
in Nigeria over the period 1970-2012. Applying a time series data from 1970-2012 in an ECM framework, the result
indicates that remittance inflow is insignificantly negative in promoting private domestic investment. The
coefficient of the error correction term is significant and appropriately signed indicative that previous deviations
away from equilibrium state adjust back to equilibrium overtime.
Beneficial as foreign inflows may seem, some empirical results show a crowding-out effect on domestic capital
formation. Saltz (1999) evaluated the impact of MNCs on domestic investment for low income economies off the
world using VAR framework. The findings showed a crowding-out effect between the level of MNCs and domestic
capital formation in 1970-1980 era. He explained that FDI is negatively related with domestic investment because
most of the multi-national companies increase output and force local producers to shut down. Also, most
multinational companies use imported capital and venture into areas hitherto controlled by government owned
enterprises.
2.2.1. Trends in Domestic Private Investment and Capital Inflow Components in Nigeria
for the Two Regime Periods (1986-1994; 1995-2012)
The value of aggregate investment spending in Nigeria in the 1986-1994 (deregulation) period was ₦337.2
($28.1) billion, but rose to ₦23,595 ($181.5) billion in the 1995-2012 (post-deregulation) period. As annual
average, it was ₦37.5 ($3.1) billion and ₦1,310.8 ($10.1) in 1986-1994 and 1995-2012 periods respectively. Annual
domestic investment spending was ₦13.3 ($3.3), ₦44 ($2.0), ₦335.6 ($3.3), and ₦3,405 ($21.4) billion in 1987,
1994, 2000, and 2012 respectively. As proportion of GDP, it was 15% in 1986, 11% in 1994, 7% in 2000, and 8%
in 2012. The above trend is indicative that investment-friendly policies of the government during the deregulation
and post-deregulation periods, such as investment and export promotion, privatization, as well as market determined
economy, failed to elicit the required private sector-led investment spending necessary to grow the economy.
Sectorally, however, the distribution of aggregate investment spending between public and private indicates that the
private sector took advantage of the privatization policy to increase its share in total investment spending. For
instance, while annual domestic public investment share in total investment was 67% in 1986-1994 era, it fell to 42%
in 1995-2012 period. On its part, private investment share in total investment rose from 33% in 1986-1994 to 58%
in 1995-2012 period. On annual basis, while public investment share in total investment showed a downward trend
of 71%, 63%, 52%, and 42% in the period 1987, 1994, 2000, and 2010 respectively; that of private investment share
in total investment trended upward in the same period to 29%, 37%, 48%, and 58% respectively. As proportion of
GDP, private investment spending was however, not impressive as it recorded 4%, 4%, 3% and 8% in 1987, 1994,
2005, and 2010 respectively.
FDI inflow into Nigeria was ₦432 ($485.58) million in 1985, but rose to ₦13,866.2 ($1,884.25) million in
1989, and peaked at ₦1,393,491.32 ($8,841.95) million in 2011. This impressive result was as a result of the
divestment of Federal Government shares in the Shell Petroleum Development Company Nigeria Limited by three
oil companies namely, Shell, Elf, and Agip, which resulted in new capital flows to take up the shares. The
enthronement of democratic government in 1999 as well as the continued deregulation and privatization policies,
especially in the communication, oil, and energy sectors further impacted positively to maintain the upward FDI
inflow. As percent of GDP, FDI inflow was equally impressive as it moved from a low of 0.93% in 1986 to a high
of 10.83% in 1994. However, the re-regulation of the economy end of 1994 resulted in sharp reduction in the FDI as
International Journal of World Policy and Development Studies, 2015, 1(1): 1-15
6
proportion of GDP as it fell to a low of 3.78% in 1995, further to 2.46% in year 2000 before rising marginally to
2.64% and 2.70% in 2010 and 2012 respectively.
Portfolio investment (PFI) inflow between 1986-1998 period was not impressive as negative figures were
reported most of the years, except for 1986 and 1992. However, from 1999 PFI inflow recorded remarkable
increases arising from the positive outcome of the sustained reform programmes, especially the banking sector
consolidation and the high rate of returns on domestic debt instruments, among others. From a low of ₦151.6
($86.63) million in 1986 and a negative figure of ₦1,618.8 ($219.95) million in 1989, it rose to ₦92,518.9 ($832)
million in 2001, ₦360,291.6 ($1,769.19) million in 2006 and peaked at ₦556,585.1 ($2,571.07) million in 2011
arising from the equity participation in the initial public offers (IPOs) of deposit money banks of 2007. As percent
of GDP, PFI was equally not impressive in the period 1986-1998. From a low of 0.42% in 1986 it nose-dived to a
negative figure of 0.91% in 1989 and remained negative till end of 1998. In 1999, it rose to 0.03%, 0.20% in 2004,
and 3.81% in 2012.
Figure-1. graphs DPI, FDI, PFI, and REM as ratio of GDP for the period 1985-2012.
Source: Plotted by the author based on the Data from World Development Indicators (WDI) 2012 and author‟s computation
Figure 1: DPI, KI Components as percent of GDP 1985 - 2012
Remittance inflow (REM) into Nigeria was ₦75.51 ($10.) million in 1989, but rose to N177,251.90 ($1,391.80)
million in 2000; N2,938,239.48 ($22,847.90) million in 2010 and ₦3,645,864.42 ($23,011.01) in 2012. As ratio of
GDP, remittance inflow also displayed an impressive upward trend. For instance, with GDP ratio of 0.01% in 1986,
it rose to 0.23% in 1991, 16.08% in 2006 but fail to 9.04% in 2012. The unabated growth in remittances is
attributable as a direct consequence of the increasing number of Nigerians who travel abroad and the reduction in
transaction costs of remitting.
As aggregates, PFI, FDI and REM inflow in the period 1986-1994 was $3,514.87, $8,568 and $1,494 million
respectively. Between 1995-2012, PFI, FDI, and REM inflow was $19,867.30, $66,967.61 and $160,292.42 million
respectively. As ratio of GDP, PFI, FDI, and REM inflow in the period 1986-1994 stood at 1.65%, 4.01% and
0.70% respectively. However, between 1995-2012, the performance of inflow components as GDP ratio was rather
mixed. While FDI and PFI inflow showed downward movements to 3.33% and 0.99% respectively, REM inflow
maintained its impressive outlook rising to a high of 7.97%.
3. Theoretical Framework and Model Specification
In modeling for domestic private investment, this research drew substantially from Blejer and Khan (1984) neo
classical investment framework. Blejer and Khan in their literature outlined the challenges in using an exact
neoclassical investment framework in developing economies. Our model which is in line with the empirical works of
Khan (2011) is modified to take care of financial difficulties facing firms in Nigeria and other developing
economies. It is modeled around a partial adjustment framework that describes investment as:
Ct - Ct-1 = It = ãt(Cd
t - Ct-1) ………………….. (2)
Where: I = net investment, Cd
= the desired (optimal) stock of capital, Ct-1 = existing stock of capital for the
economy, t = time period, and ã = the adjustment coefficient that may change over time. Both Cd
and ã are internally
determined. Cd
reflects the efficient use of capital stock, while ã results in optimal adjustment drive towards the
desired level of capital stock. It is expected that ã vary systematically with macroeconomic, financial, technological,
and system bottlenecks to meet up with planned level of capital formation. Equation (2) says that any variation in
actual capital stock will react only partly to the difference between optimal C and previous values of C.
Khan (2011) notes that rigidities in the financial system due to under developed financial markets exert effect on
the series of actions towards a change in Cd
, and increases the need for foreign capital inflow to improve investment
in developing countries. According to Stordel (1990), the major bottleneck to investment in developing economies
is the volume of financial resources, not their costs. We assume that the rate of adjustment is constrained not only by
the cost of borrowing (INT), but also by the quantity of foreign capital inflow to the country. However, to capture
the two objectives of the study, aggregate capital inflow (KI) and capital inflow components (foreign direct
-2
0
2
4
6
8
10
12
14
1985 1987 1990 1994 1996 2000 2005 2012
DPI
FDI
PFI
REM
International Journal of World Policy and Development Studies, 2015, 1(1): 1-15
7
investment (FDI), portfolio investment (PFI), and remittances (REM)) are entered in the model separately. Hence,
the adjustment coefficient is given as:
ãt = f(INTt, KIt, FDIt, PFIt, REMt) ……………….. (3)
Investment demand function is negatively interest elastic because a higher market rate of interest (INT)
increases the cost of capital, crowds out return on investment and hence a fall in investment. Thus, ceteris paribus, a
rise in the market rate of interest would lead to a fall in investment while a fall in interest rate would result in an
increase in investment.
Foreign Direct Investment (FDI) is expected to impact on domestic private investment through the spread of
best practices, transfer of technology and sub-contracting to local firms. But increased FDI can also harm domestic
investment as local firms cannot compete with huge multinational corporations and are forced to close down (Khan,
2011). It is therefore difficult to predict a priori the sign of the effect of FDI on the coefficient of adjustment, and
consequently on domestic private investment. Portfolio flows are expected to impact positively on domestic
investment as flows are expected to promote improvements and expansion of financial markets. But portfolio flows
and particularly short-term flows that are driven by speculative considerations are often subject to reversals at the
first sign of trouble, and consequently might not influence domestic investment (Loungani, 2003). Adams and Page
(2005) argue that remittance inflow positively and significantly affect current account balance and economic growth
through its direct implications for savings, human capital development, and, indirectly on consumption. Ratha
(2003) adds that for rural households, remittances raise their consumption level, and this may induce higher
multiplier effect because they are more likely to be spent on home made goods. Hence, remittances are expected to
positively impact on domestic investment.
Government investment (GI) is important and can complement domestic private investment, but the manner and
source of financing is equally important. Public capital expenditure undertaken to boost infrastructure like transport,
communication, education, energy, and irrigation has the potential to complement or crowd in private sector
investment as such projects tend to reduce the cost of production and increase the profitability of private capital.
However, as argued by Aschauer (1989), public investment that involves large fiscal deficits that result in high
interest rate, credit rationing, or a higher current and future tax burden will negatively impact on domestic private
investment. The role of public investment in influencing domestic private investment is therefore not in doubt. The
coefficient of adjustment becomes:
ãt = f(INTt, KIt, FDIt, PFIt, REMt, GIt) ……………….. (4)
Exchange rate is expected to affect the coefficient of adjustment since most developing countries depend on
imported capital inputs for production. However, the theoretical postulation is ambiguous about the direction of the
effect of exchange rate (EXR) on the rate of investment. While a real depreciation raises the cost of imported capital
inputs, and because a large chunk of investment goods in developing countries (Nigeria inclusive) is imported,
domestic private investment would be expected to fall on account of significant depreciation. On the other hand, a
significant depreciation by raising the profitability in the tradable goods sector would be expected to stimulate
private investment in the export sector, but depresses investment in the non tradable goods sector (Ezike and Ogege,
2012). The coefficient of adjustment is now:
ãt = f(INTt, KIt, FDIt, PFIt, REMt, GIt EXRt) ……………….. (5)
Following the accelerator principle which assumes the proportionality of expected capital to required output at
any given period (GDPgt):
Cd
t = f(GDPgt) …………………….. (6)
An expected higher output requires additional inputs which will generate a higher desired capital stock.
Merging equations 2, 5, 6 and adding previous quarter domestic private investment (DPIt-1) gives the domestic
private investment (DPI) model that will be estimated, thus:
DPI = f(DPIt-1, INTt, KIt, FDIt, PFIt, REMt, GIt, EXRt, GDPgt) ………………… (7)
The study covers two regime periods – deregulation era (1986-1994), and post-deregulation era (1995-2012).
We introduce dummy (DUM) variable that has values of zero (0) for deregulation, and one (1) for post-regulation.
The magnitude of the coefficient of the DUM variable in the model is used to evaluate the extent of the difference in
the capital inflow components in stimulating domestic private investment in these periods. The test applies only to
objective two – capital inflow components-domestic private investment nexus. Our model becomes:
DPI = f(DPIt-1, KIt, FDIt, PFIt, REMt, INTt, GIt, EXRt, GDPgt, DUM) ………………… (8)
To standardize the data and enable us interpret as percentages, we transform the variables in their log linear
forms and present as econometric model thus:
lnDPIt = bo + b1lnDPIt-1 + b2[(lnKIt)] + b3[(lnFDIt) + b4(lnPFIt) + b5(lnREMt)] + b6lnGIt + b7INTt + b8GDPgt +
b9lnEXRt + b10DUM + µt ………………….………… (9)
ln shows that the variables are in their log linear form; while t denotes time (1986Q1 – 2012Q4)
While aggregate capital inflow (KI) represents the explanatory variable of interest for objective one, capital
inflow components (FDI, PFI, and REM) are the variables of interest for objective two. The variables – [(KI) and
(FDI, PFI, REM)] – in equation (9) enter the model each at a time and are estimated as such.
Equation (10) is the generalized specification framework of error correction (ECM) model to allow for inclusion
of long-run information.
International Journal of World Policy and Development Studies, 2015, 1(1): 1-15
8
ln∆DPIt = ao + a1ln∆DPIt-1 + a2[(lnKIt)] + a3[(ln∆FDIt + a4ln∆PFIt + a5ln∆REMt)] + a6ln∆GIt + a7∆INTt
+a8∆GDPgt + a9∆ln∆EXRt + a10DUMt + λECMt-1 µt …………..……… (10)
∆ is the first difference operator, a1- a11 are the parameters of the model to be estimated, and λ is the error
correction coefficient, while the rest are as earlier defined.
3.1. Estimation Issues
An important assumption of ordinary least squares (OLS) is the existence of zero correlation between the error
term and any explanatory variable. Any violation of this makes the explanatory variable endogenous and OLS
estimates inconsistent. To test for possible endogeneity problem, we employ Granger (1986) causality test. Granger
(1986) causality method of investigating whether X is the cause of Y is to determine how much of current Y is
explained by past values of itself and then to see if by including previous values of X, we can better the explain Y.
Y is then granger-caused by variable X if X assists predict Y, or if the values obtained from the lagged X‟s have
statistical significant (EViews 3.1 User‟s Guide, 1999). The idea behind the test of causality should be understood;
if X causes Y, then changes in X should come before that in Y (Pindyck and Rubinfeld, 1991). This characteristic
makes causality test an important one in the test of endogeneity.
When you regress non-stationary variables on each other, you might have a nonsense or spurious result
indicating a statistical significant relationship between the variables, when this may just be evidence of
contemporaneous correlation. To ascertain the quality of the variables in our model, we test for the order of
integration of each time series using the Augmented Dickey-Fuller (ADF) and Philips-Perron (PP) unit root tests.
The two approaches are apt because, while the ADF model accounts for the autocorrelation of the first differences of
the series in a parametric way by guessing the value of additional nuisance parameters, the Phillip-Perron makes use
of non-parametric statistical methods to correct for the serial correlation of the disturbances while avoiding lagged
difference terms (Gujarati and Porter, 2009).
Stationarity achieved, we test for the exact numbers of co-integrating equations among the variables – whether
or not there exist long run co-integrating nexus among them. We undertook co-integration tests as given by
Johansen and Juselius (1990) maximum likelihood function. In these tests, both the Trace and Maximum Eigen-
value statistics are compared with their critical values to ascertain number of co-integration equations.
3.2. Data Sources
Majorly, data source for the estimation of equations and analysis of this study covering the period of 108
quarters are from World Development Indicators (WDI) (2012). They include, gross fixed capital formation (both
private and public), aggregate capital inflow (sum of three components: foreign direct investment, foreign portfolio
investment, workers‟ remittances), each of the capital inflow components, and GDP growth rate. Data on interest
and exchange rates are from CBN Statistical Bulletin (various years). However, data on domestic sectoral
investment as percent of total investment are used to compute data on private and public gross fixed capital
formation. Quarterly data generated from annual data 1986 to 2012 using e-views version 6 software are used for
the study. The choice was informed by data availability and the dramatic increase in inflow components following
the deregulation which started in 1986.
4. Empirical Results
4.1. Presentation of Some Preliminary Tests: Unit Root and Co-integration
We utilized the Augmented Dickey-Fuller (ADF) and Philips Perron (PP) for the unit root tests. Both results
show that all the variables are integrated of order one I(I). Afterwards, we undertook co-integration tests based on
the Johansen and Juselius (1990) maximum likelihood framework using both the Trace and Maximum Eigen-value
statistics. Our results provide evidence that there are two co-integration equations each for Trace and Maximum
eigenvalue for the two models. Hence, we conclude that there exists a long run equilibrium relationship among the
variables. Results of these tests are not displayed for want of space.
We carried out the Granger causality test to ascertain whether domestic private investment (DPI) has any causal
relationship with capital inflow components in Nigeria. The results of the pairwise Granger causality test revealed
that DPI does not Granger cause foreign direct investment (FDI) and workers‟ remittances (REM), while it does
Granger cause portfolio investment (PFI). On the other hand, FDI and REM do Granger cause DPI, but PFI variable
does not Granger causes DPI. Hence, the causality relationship between DPI and capital inflow components is
unidirectional in nature with FDI and REM causing DPI, and DPI causing PFI. The maximum lag length for all the
results was 3.
4.2. Empirical Results and Discussion
According to Giles (2013), if time series variables have integration of the same order (example, 1(1)), and they
are co-integrated, two types of models are estimated – an OLS regression model using levels of data, and an ECM
estimate using OLS. From our unit root tests, all the series have the same order of integration, that is, 1(1), and they
are co-integrated. Hence, we estimate two different models. The first is an OLS regression using levels of data
(equation 9) to provide the long-run equilibrium relationship. This equation gave us two sets of results referred to as
models (1a) and (1b). The second, an error correction model using different data (equation 10) that provided the
International Journal of World Policy and Development Studies, 2015, 1(1): 1-15
9
short-run dynamics of the relationship between the variables. This equally gave two sets of results called models
(2a) and (2b).
4.2.1 Model 1a: Long Run Impact Analysis of Aggregate KI-DPI (Using Levels of Data)
The result showed that the coefficient of one quarter lag of the dependent variable (DPI) itself is significantly
positive even at 1% level while aggregate capital inflow (KI) variable is negative and insignificant in explaining
variations in domestic private investment in Nigeria in the long run.
4.2.2. Model 1b: Long Run Impact Analysis of KI Components-DPI (Using Levels of Data)
The coefficients of the inflow types displayed mixed signs and sizes, indicative of their varied individual
impacts on the growth process of domestic private investment in Nigeria. Specifically, while a 1% increase in FDI
during the analysis period significantly increased DPI by about 9% in the long run, an equivalent increase also in PFI
and REM significantly depressed DPI by 3% each in the long run. On its part, the coefficient of one quarter lag of
the dependent variable (DPI) itself is significantly positive even at 1% level in determining the current outcome of
itself.
4.2.3. Model 2a: Short Run Impact Analysis of Aggregate KI-DPI (Using Differenced Data)
In order to support the long-run estimates of model (1a), we present table 2a to see the short-run dynamics of the
error correction model. Consistent with the long run results in table 1a, aggregate capital inflow (KI) coefficient is
negative and insignificant even at 10% level. Specifically, a 1% increase in aggregate KI in a quarter will
insignificantly depress DPI by 2% in the short run. This implies that aggregate capital inflow (KI) contribution to
domestic private investment in Nigeria has been negative, but insignificant both in the short and long run. This is in
tandem with the findings of Saltz (1999) that capital inflow crowed out domestic investment in developing countries,
but inconsistent with the findings of Elitza (2008). Elitza found that aggregate capital inflow raise domestic
investment in transition economies of former Soviet Union.
The error correction term (ecmt-1) is less than one, negative and statistically significant, thus corroborating the
results of the co-integration tests of the existence of a stable long run equilibrium relationship among the variables.
Specifically, the ecmt-1 is -0.30, indicative that 30% of previous quarter‟s disequilibrium (shock) from long run
anchor will be restored within a quarter. DW value of 1.84 is close to 2 and is indicative of the absence of
autocorrelation problem, hence the model is reliable.
However, that aggregate capital inflow coefficient is negative and insignificant may require further
investigation. This is because the type of inflow into an economy is important. Available literature suggests that the
magnitude and direction of impact depend on the type of inflow. Dis-aggregating capital inflow into components
and estimating their individual impacts on DPI is therefore crucial. This was done (using differenced data) and
reported as model 2b presented in table 2b.
4.2.4. Model 2b: Short Run Impact Analysis of KI Components-DPI (Using Differenced
Data)
To examine the relative impacts of capital inflow components on the growth of DPI, the short-run results
presented in table 2b are also consistent with and support our long-run results. The coefficients of FDI, PFI, and
REM are 0.19, -0.02, and -0.12 respectively, while their respective t-statistic is 3.01, -1.11, and -4.89. Specifically,
the results show that in the short run, a 1% increase in FDI significantly increases DPI by 19%, while a 1% increase
each in PFI and REM inflow will depress DPI by 02% and 12% respectively. This finding reveals that first, as
aggregate, the impact of KI on DPI in Nigeria is negative. Second, when disaggregated into components, the relative
and direction of impact of each component vary. Third, as aggregate, the joint contractionary impact of PFI and
REM on DPI is more than the expansionary impact of FDI. This finding is not as surprising as it is interesting.
First, it supports our long-run results reported in table 1b. Second, the unconducive macroeconomic environment
prevalent during the period of policy reversals, shifts and antithetical policy measures of the late 80s, mid 90s and
during the 2007-2009 global economic crises might have resulted in the risk averse private investors to predict the
future, and hence preferred to reverse the reversible investment. Hence, the reversible and volatile nature of PFI as
noted by Hecht et al. (2004) manifested evidently going by its negative coefficient during the study period. Third,
FDI inflow is remarkably stable and more permanent, even during economic crises as evidenced by its positive
coefficient. The positive impact of FDI on DPI as revealed in the results is consistent with the two-gap theoretical
thesis that foreign capital inflow permits the developing countries to invest more than they can save domestically. It
is also in tandem with Ayanwale (2007) who noted that FDI inflow into Nigeria (being mainly in the petroleum
sector) turn in substantial profits after adjusting for risk, so that foreign investors could not be discouraged by policy
inconsistencies and shifts. Other results consistent with our findings are: Hecht et al. (2004) result was for 64
developing countries; Herzer et al. (2006) result was on Nigeria, Sri Lanka, Tunisia, and Egypt; Okodua (2009), and
Ogbonna et al. (2012), studies are for Nigeria. This suggests the need to sustain all pro-FDI policies to further
attract massive inflow of foreign capital (especially FDI), while the current efforts to improve the security situation
remains imperative.
International Journal of World Policy and Development Studies, 2015, 1(1): 1-15
10
The negative and significant impact of REM coefficient is in tandem with results of the earlier works done by
Oduh and Urama (2012); Akinpelu et al. (2013); and Ogbonna et al. (2014) for Nigeria; but inconsistent with the
findings of Ukeje and Obiechina (2013) also for Nigeria. The depressing effect of PFI coefficient is consistent with
most of the previous studies, for instance, the study by Rachdi and Saidi (2011), Durham (2003), and Aitken and
Harrison (1999), but inconsistent with findings of Knill (2005), Errunza (2005), and Ekeocha et al. (2012).
Results of the control variables are largely consistent with a priori expectations. Specifically, 1% increase in
government investment significantly grows DPI by 6%. This is in tandem with theoretical postulation of Khan and
Amia (2003) that public investment (in infrastructure – transport, communication, energy, irrigation, etc.)
complement or crowd in private sector investment as such tend to reduce the cost of production and raise the rate of
return on private capital. However, the result is inconsistent with the findings of Oyejide and Raheem (1993), who
found that most public investment in Nigeria were doubtful in utility and viability and constituted a dead-weight loss
in terms of net benefits to the economy. Despite this, however, the significance of public investment in Nigeria
should not be toyed with or discounted, at least contemporaneously as evidence from this study is indicative that the
sustenance of a high level of private investment and real GDP hinges on government investment.
On its part, output growth (GDPg) dynamics, that is, „acceleration of output‟, are crucial and significant in the
determination of domestic private investment growth in Nigeria. Precisely, a percent positive change in output
growth (GDPg) will significantly increase DPI by 003%. Thus, this finding corroborates the theoretical postulations
by Koyck (1954) and Iyoha (2004) that firms will expand their output only if there is increase in the growth rate of
output – an acceleration of output growth.
The coefficient of interest rate (INT) is in tandem with the theoretical postulations. A 1% increase in prime
interest rate will depress DPI by 002%, while the coefficient of EXR is both positive and significant in determining
growth process of DPI.
The dummy (DUM) variable which entered into the model to account for policy (regime) changes has a
coefficient of -0.04 and t-statistic value of -2.25. These results reveal that the era of deregulation and post-
deregulation periods as provided for in our model, significantly and negatively determined DPI behavior in Nigeria
even at 1% level. The negative co-efficient of DUM variable is largely consistent with our expectations. The
prevailing un-conducive macroeconomic environment during most of the analysis period, derived from policy
inconsistencies and shifts, largely informed our expectations. Hence, the robust but negative DUM coefficient has
further corroborated and reinforced the findings of Anyanwu (1998), but at variance with that of Ayanwale (2007).
The error correction model (ecmt-1) which measures the adjustment speed has a coefficient of –0.28 indicative of
feedback effect of approximately 28%. If DPI is in disequilibrium as a result of contemporaneous dynamic shock, it
will take a speed of approximately 28% within a quarter to adjust back to long-run equilibrium.
The adjusted R2 is 0.73 indicative that the explanatory variables explained about 73% of the variations in DPI.
The DW statistic value is 2.07 indicative of the absence of serial correlation. The F-statistic value of 18.10 is
significantly satisfactory and shows that all the variables jointly explained changes in DPI in Nigeria.
5. Conclusion
The question of whether capital inflow components improve domestic private investment in Nigeria has been
explored in this study. The application of OLS econometric technique in an ECM framework has proved quite
intuitive and acceptable. The empirical investigation sheds new light on the domestic private investment-capital
inflow relationship that would prove useful in the design of macroeconomic policies in Nigeria, and also provide the
platform on which the policies can be measured.
The study covered the period 1986Q1 to 2012Q4 and examined two vital aspects of the research objective.
These are capital inflow-domestic private investment nexus and capital inflow components-domestic private
investment nexus. Overall, the goal was to determine the existence of any unique link between capital inflow and
the above indicators of domestic private investment. The empirical results clearly emphasize the role of foreign
capital inflow in the growth process of the economy of Nigeria through its impact on domestic private investment.
On aggregate, capital inflow coefficient was negative and insignificant. However, when disaggregated, PFI and
REM components were strikingly found to have depressing effect on domestic private investment as against the
expansionary impact of FDI. Hence, by decomposing capital inflow, the study has highlighted that FDI inflow
component is more sustainable and more growth-inducing as far as domestic private investment is concerned.
Having found FDI component the only contributor to DPI in Nigeria, policies to further attract massive inflow of
foreign capital (especially FDI) is imperative.
References
Adams, R. H. and Page, J. (2005). International Migration, remittances and poverty in developing countries. World
Bank: World Development, 33(10): 1645-69.
Aitken, B. J. and Harrison, A. E. (1999). Do domestic firms benefits from direct foreign investment? . American
Economic Review, 89(3): 605-18.
Akinpelu, Y. A., Ogunbi, O. J., Bada, O. T.and Omojola, O. S. (2013). Effects of remittance inflows on economic
growth of Nigeria. Developing Countries Studies, 3(3): 113-22.
International Journal of World Policy and Development Studies, 2015, 1(1): 1-15
11
Anyanwu, J. C. (1998). An econometric investigation of the determinants of foreign investment in Nigeria,
Rekindling investment for economic development in Nigeria by Nigerian Economic Society. Ibadan: 219-
241.
Aschauer (1989). Does public capaital crowd out private capital? Federal Reserve Bank of Chicago staff memoranda
Ayanwale, A. B. (2007). FDI and economic growth: Evidence from Nigeria. AERC Research Paper 165, African
Economic Research Consortium, Nairobi.
Blejer, M. and Khan, M. (1984). Government Policy and private investment in developing countries. IMF Staff
Papers, 31(1): 379-403.
Bos, H. C., Sanders, M.and Secchi, C. (1974). Private foreign investment in developing countries: A quantitative
study on the macroeconomic effects. Reidel: Dardrecht.
Calvo, G. A., Leiderman, L.and Reinhart, C. M. (1994). Capital inflows and real exchange rate appreciation in Latin
America: the role of external factors. IMF Working Paper, 92/62.
Chirinko, R. S. (1993). Business fixed investment spending: modeling strategy, empirical results, and policy
implications. Journal of Econometric Literature, 31(4): 1875-911.
Durham, J. B. (2003). Foreign portfolio investment, foreign bank lending and economic growth. International
Finance Discussion Paper No. 757.
Ekeocha, P. C., Ekeocha, C. S., Malaolu, V.and Oduh, M. O. (2012). Modelling the long run determinants of foreign
portfolio investment in Nigeria. Journal of Economics and Sustainable Development, 3(8): 194-202.
Elitza, M. (2008). The impact of capital flows on domestic investment in transition economies, European Central
Bank Working Paper Series 871.
Errunza, V. (2005). Conditional heteroskedasticity and global stock return distributions. The Financial Review,
29(3): 293–317.
EViews 3.1 User‟s Guide (1999). Irvine, CA: Quantitative Micro Software, LLC. 3th edn.
Ezike, J. E. and Ogege, S. (2012). Nigeria foreign trade policy: Its impact on the on-oil exports. Journal of
Economics and International Finance, 4(8): 192-200.
Giles, D. (2013). Econometrics Beat: ARDL Models – Part II – Bounds Tests.
http://davegiles.blogspot.ca/2013/ardl-models-part-ii-bounds-tests.html
Granger, C. W. J. (1986). Developments in the study of cointegrated economic variables. Oxford Bulletin of
Economics and Statistics, 48(3): 213-28.
Gujarati, D. N. and Porter, D. C. (2009). Basic econometrics. International Edition, McGraw Hill Education (Asian).
Hecht, Y., Razin, A.and Shinar, N. G. (2004). Interactions between capital inflows and domestic investment: Isreal
and developing economies. Israel Economic Review, 2(2): 1-14.
Herzer, D., Klasen, S.and Nowak-Lehmann, D. F. (2006). In search of FDI-led growth in developing countries: the
way forward. Iber Americana Institute for Economic Research.
Iyoha, M. A. (2004). Applied econometrics. 2nd edn: Mindex Publishing: Benin City.
Johansen, S. and Juselius, K. (1990). Maximum likelihood estimation and inference on co-integration with
application to demand for money. Oxford Bulletin of Economics and Statistics, 52(2): 169-210.
Keynes, J. M. (1936). The general theory of employment, interest and money. Macmillan Press: New York.
Khan, A. S. (2011). Volatility of Resource Inflows and Domestic Investment in Cameroon. African Economic
Research Consortium (AERC) Biannual Research Workshop, Nairobi, Kenya.
Khan, A. S. and Amia, G. (2003). Volatility of resource inflows and domestic investment in cameroun. Work-in-
Progress for Presentation at the African Economic Research Consortium (AERC) Biannual Research
Workshop at Nairobi, Kenya.
Knill, A. M. (2005). Can foreign portfolio investment bridge the small firm financing gap around the world? World
Bank Policy Research Working Paper 3796, The World Bank Group, Washington, DC 20433.
Koyck, L. M. (1954). Distributed lags and investment analysis. North-Holland Publishing Company: Amsterdam.
Loungani, P. (2003). The role of information in driving determinants of foreign direct investment: Theory and
evidence, paper presented in the Northern American Winter Meeting of the Econometric Society.
McKinnon, R. I. (1964). Foreign exchange constraints in economic development. Economic Journal, 74(294): 388-
409.
McKinnon, R. I. (1973). Money and capital in economic development. The Brookings Institute: Washington DC.
Nkoro, E. and Furo, A. O. (2012). Foreign capital inflows and economic growth in nigeria: an empirical approach.
Academic Journal of Interdisciplinary Studies, MCSER-CEMAS-Sapienza University of Rome.
Oduh, M. O. and Urama, N. E. (2012). Does the end use of remittance matter? a macro simulation of the Nigerian
economy. Developing Country Studies, 2(10): 48-59.
Ogbonna, I. C., Agu, S.and Chijioke, G. (2014). Do remittances promote investment in developing countries? an
inquiry into „remittance-domestic private investment‟ relationship in Nigeria. Renaissance University
Journal of Management and Social Sciences (RUJMASS), 1(1): 40-51.
Ogbonna, I. C., Uwajumogu, N. R., Nwokoye, E.and Nzeribe, G. (2012). Economic growth and foreign direct
investment in Nigeria: an empirical investigation. Journal of Economics and Sustainable Development,
3(13): 34-41.
Okodua, H. (2009). Foreign direct investment and economic growth: co-integration and causality analysis of Nigeria.
The African Finance Journal II, Part I, II, Part I: 54-73.
International Journal of World Policy and Development Studies, 2015, 1(1): 1-15
12
Oyejide, T. A. and Raheem, M. I. (1993). Nigeria in Taylor (ed.) The Rocky Road to Reform, Washington DC:
United Nations Press.
Papanek, G. F. (1960). Framing a development program. Carnegie Endowment for International Peace: New York.
Pindyck, R. and Rubinfeld, D. (1991). Econometric models and economic forecasts. McGraw-Hill:
Prebisch, R. (1968). Development problems of the peripheral countries and the terms of trade, in: James D.
Theberge, ed. Economics of Trade and Development. John Wiley and Sons Inc: New York.
Rachdi, H. and Saidi, H. (2011). The impact of foreign direct investment and portfolio investment on economic
growth in developing and developed economies. Interdisciplinary Journal of Research in Business, I(6):
10-17.
Ratha, D. (2003). Workers‟ remittances: an important and stable source of external development finance. Global
Development Finance, Washington, DC: The World Bank: 157-72.
Saltz, I. (1999). The Negative Correlation between foreign direct investment and economic growth in the third
world: theory and evidence. Rivista Internazionale di Scienze Economiche e Commerciali, 39(7): 617-33.
Shaw, E. S. (1973). Financial deepening in economic development. Oxford University Press: New York.
Singer, H. W. (1950). The distribution of gains between investing and borrowing countries. American Economic
Review, 40(2): 473-85.
Stordel, H. (1990). Export income risk and determinants of capital formation in developing countries. Review of
World Economics, 126(2): 346-68.
Ukeje, E. U. and Obiechina, M. E. (2013). Workers‟ remittances-economic growth nexus: evidence from Nigeria,
using an error correction methodology. International journal of Humanities and Social Sciences, 3(7): 212-
27.
World Development Indicators (WDI) (2012). data.worldbank.org/sites/default/files/wdi-2012-ebook.pdf
International Journal of World Policy and Development Studies, 2015, 1(1): 1-15
13
Appendix I
Model Estimation Results (Using Levels of Data)
Table-1a. Model 1a – Aggregate KI-DPI Nexus
Dependent Variable: INDPI
Method: Least Squares
Date: 12/29/14 Time: 16:50
Sample (adjusted): 1986Q1 2012Q4
Included observations: 83 after adjustments
Variable Coefficient Std. Error t-Statistic Prob.
C 0.454988 0.154728 2.940562 0.0038
INDPI(-1) 0.906409 0.020391 44.45067 0.0000
INKI -0.003416 0.015128 -0.225781 0.8217
INEXR 0.105230 0.022331 4.712329 0.0000
INGI 0.039143 0.019163 2.042658 0.0428
INT -0.008429 0.002275 -3.704602 0.0003
GDPG -0.001400 0.001264 -1.107808 0.2697
R-squared 0.984816 Mean dependent var 10.01026
Adjusted R-squared 0.963762 S.D. dependent var 2.708408
S.E. of regression 0.095293 Akaike info criterion -1.815877
Sum squared resid 1.407530 Schwarz criterion -1.664037
Log likelihood 155.9940 Hannan-Quinn criter. -1.754231
F-statistic 18672.59 Durbin-Watson stat 0.607116
Prob(F-statistic) 0.000000
Table-1b. Model 1b – KI components-DPI Nexus
Dependent Variable: INDPI
Method: Least Squares
Date: 12/29/14 Time: 17:02
Sample (adjusted): 1986Q1 2012Q4
Included observations: 83 after adjustments
Variable Coefficient Std. Error t-Statistic Prob.
C 0.117046 0.271024 0.431864 0.6673
INDPI(-1) 0.904397 0.027720 32.62602 0.0000
INFDI 0.093506 0.030624 3.053316 0.0033
INPFI -0.030398 0.007427 -4.093202 0.0001
INREM -0.034383 0.011987 -2.868269 0.0056
INEXR 0.095369 0.027145 3.513317 0.0008
INT -0.004001 0.001910 -2.094719 0.0402
GDPG -0.006455 0.001157 -5.580139 0.0000
INGI 0.065441 0.021581 3.032348 0.0035
DUM -0.389528 0.103812 -3.752244 0.0004
R-squared 0.991481 Mean dependent var 12.23153
Adjusted R-squared 0.978407 S.D. dependent var 2.221474
S.E. of regression 0.054113 Akaike info criterion -2.868827
Sum squared resid 0.184479 Schwarz criterion -2.555066
Log likelihood 114.7122 Hannan-Quinn criter. -2.743788
F-statistic 13475.34 Durbin-Watson stat 0.978208
Prob(F-statistic) 0.000000
International Journal of World Policy and Development Studies, 2015, 1(1): 1-15
14
Models Estimation Results (Using Differenced Data)
Model-2a. Aggregate KI-DPI nexus
Dependent Variable: D(INDPI)
Method: Least Squares
Date: 12/29/14 Time: 17:40
Sample (adjusted): 1986Q1 2012Q4
Included observations: 83 after adjustments
Variable Coefficient Std. Error t-Statistic Prob.
C 0.003048 0.005190 0.587160 0.5580
Continue
D(INDPI(-1)) 0.668423 0.045899 14.56279 0.0000
D(INKI) -0.021024 0.021712 -0.968332 0.3344
D(INGI) 0.057011 0.027826 2.048818 0.0422
D(INEXR) 0.301654 0.033556 8.989671 0.0000
D(INT) -0.001973 0.004259 -0.463294 0.6438
D(GDPG) 0.000219 0.001943 0.112600 0.9105
ECM(-1) -0. 300945 0.013356 -2.316979 0.0218
R-squared 0.728878 Mean dependent var 0.048955
Adjusted R-squared 0.716473 S.D. dependent var 0.109450
S.E. of regression 0.058279 Akaike info criterion -2.798729
Sum squared resid 0.519660 Schwarz criterion -2.645616
Log likelihood 233.2977 Hannan-Quinn criter. -2.736559
F-statistic 58.76015 Durbin-Watson stat 1.839112
Prob(F-statistic) 0.000000
Model-2b. KI Components-DPI nexus
Dependent Variable: D(INDPI)
Method: Least Squares
Date: 12/29/14 Time: 18:10
Sample (adjusted): 1986Q1 2012Q4
Included observations: 83 after adjustments
Variable Coefficient Std. Error t-Statistic Prob.
C -0.056572 0.032778 -1.725920 0.0897
D(INDPI(-1)) 0.607320 0.066444 9.140346 0.0000
D(INFDI) 0.189851 0.063006 3.013229 0.0038
D(INPFI) -0.016922 0.015310 -1.105274 0.2736
D(INREM) -0.120993 0.024759 -4.886728 0.0000
D(INGI) 0.075221 0.023306 3.227584 0.0021
D(INEXR) 0.179206 0.075413 2.376343 0.0208
D(INT) -0.001516 0.001866 -0.812794 0.4197
D(GDPG) 0.021249 0.002813 1.844003 0.0447
DUM -0.037870 0.016853 -2.247059 0.0285
ECM(-1) -0. 280250 0. 076937 -1.967894 0.0357
R-squared 0.774398 Mean dependent var 0.063990
Adjusted R-squared 0.731611 S.D. dependent var 0.078382
S.E. of regression 0.040607 Akaike info criterion -3.414953
Sum squared resid 0.095637 Schwarz criterion -3.029496
Log likelihood 131.5233 Hannan-Quinn criter. -3.261845
F-statistic 18.09906 Durbin-Watson stat 2.074244
Prob(F-statistic) 0.000000
International Journal of World Policy and Development Studies, 2015, 1(1): 1-15
15
Appendix II
Granger Causality Test
Table-3. Pairwise Granger Causality Test Results in the KI Components-DPI Causal Relationship (Models (33)
Sample: 1986Q1 2012Q4
No of Lags: 3
Null Hypothesis: Obs F-Statistic Prob.
INFDI does not Granger Cause INDPI 158 3.56144 0.0158
INDPI does not Granger Cause INFDI 0.48066 0.6962
INPFI does not Granger Cause INDPI 64 0.13955 0.9359
INDPI does not Granger Cause INPFI 10.0278 2.E-05
INREM does not Granger Cause INDPI 166 2.13422 0.0980
INDPI does not Granger Cause INREM 0.78964 0.5013

More Related Content

What's hot

Determinants of foreign direct investment in malaysia
Determinants of foreign direct investment in malaysiaDeterminants of foreign direct investment in malaysia
Determinants of foreign direct investment in malaysiaMohammad Hasan Tusher
 
External debt, economic growth and investment in nigeria
External debt, economic growth and investment in nigeriaExternal debt, economic growth and investment in nigeria
External debt, economic growth and investment in nigeriaAlexander Decker
 
Determinants of Foreign Direct Investment in Nigeria
Determinants of Foreign Direct Investment in NigeriaDeterminants of Foreign Direct Investment in Nigeria
Determinants of Foreign Direct Investment in Nigeriaijtsrd
 
Determinants of Foreign Direct Investment (FDI) in Malaysia: What Matters Most?
Determinants of Foreign Direct Investment (FDI) in Malaysia: What Matters Most?Determinants of Foreign Direct Investment (FDI) in Malaysia: What Matters Most?
Determinants of Foreign Direct Investment (FDI) in Malaysia: What Matters Most?Nursuhaili Shahrudin
 
Foreign Investment and Its Effect on the Economic Growth in Nigeria: A Triang...
Foreign Investment and Its Effect on the Economic Growth in Nigeria: A Triang...Foreign Investment and Its Effect on the Economic Growth in Nigeria: A Triang...
Foreign Investment and Its Effect on the Economic Growth in Nigeria: A Triang...iosrjce
 
The impact of foreign direct investment [fdi] on poverty reduction in nigeria
The impact of foreign direct investment [fdi] on poverty reduction in nigeriaThe impact of foreign direct investment [fdi] on poverty reduction in nigeria
The impact of foreign direct investment [fdi] on poverty reduction in nigeriaAlexander Decker
 
Factors Affecting the Investment Climate and the Role of Investments in Econo...
Factors Affecting the Investment Climate and the Role of Investments in Econo...Factors Affecting the Investment Climate and the Role of Investments in Econo...
Factors Affecting the Investment Climate and the Role of Investments in Econo...ijtsrd
 
The impact of interest rates on the development of an emerging market empiric...
The impact of interest rates on the development of an emerging market empiric...The impact of interest rates on the development of an emerging market empiric...
The impact of interest rates on the development of an emerging market empiric...Alexander Decker
 
61176257 determinant-of-foreign-direct-investment-in-the-malaysian-manufactur...
61176257 determinant-of-foreign-direct-investment-in-the-malaysian-manufactur...61176257 determinant-of-foreign-direct-investment-in-the-malaysian-manufactur...
61176257 determinant-of-foreign-direct-investment-in-the-malaysian-manufactur...Jonjongot
 
Tax Incentives and Foreign Direct Investment in Nigeria
Tax Incentives and Foreign Direct Investment in NigeriaTax Incentives and Foreign Direct Investment in Nigeria
Tax Incentives and Foreign Direct Investment in Nigeriaiosrjce
 
Capital flight and exchange rate volatility in nigeria
Capital flight and exchange rate volatility in nigeriaCapital flight and exchange rate volatility in nigeria
Capital flight and exchange rate volatility in nigeriaAlexander Decker
 
Domestic debt and the growth of nigerian economy
Domestic debt and the growth of nigerian economyDomestic debt and the growth of nigerian economy
Domestic debt and the growth of nigerian economyAlexander Decker
 
Financial liberalization and economic growth implications for the conduct of...
Financial liberalization and economic growth  implications for the conduct of...Financial liberalization and economic growth  implications for the conduct of...
Financial liberalization and economic growth implications for the conduct of...Alexander Decker
 
The effect of external debt on economic growth
The effect of external debt on economic growthThe effect of external debt on economic growth
The effect of external debt on economic growthSanjida Sarafat
 
Business mentoring and domestic entrepreneurship in nigeria’s
Business mentoring and domestic entrepreneurship in nigeria’sBusiness mentoring and domestic entrepreneurship in nigeria’s
Business mentoring and domestic entrepreneurship in nigeria’sAlexander Decker
 

What's hot (20)

Determinants of foreign direct investment in malaysia
Determinants of foreign direct investment in malaysiaDeterminants of foreign direct investment in malaysia
Determinants of foreign direct investment in malaysia
 
External debt, economic growth and investment in nigeria
External debt, economic growth and investment in nigeriaExternal debt, economic growth and investment in nigeria
External debt, economic growth and investment in nigeria
 
Determinants of Foreign Direct Investment in Nigeria
Determinants of Foreign Direct Investment in NigeriaDeterminants of Foreign Direct Investment in Nigeria
Determinants of Foreign Direct Investment in Nigeria
 
Determinants of Foreign Direct Investment (FDI) in Malaysia: What Matters Most?
Determinants of Foreign Direct Investment (FDI) in Malaysia: What Matters Most?Determinants of Foreign Direct Investment (FDI) in Malaysia: What Matters Most?
Determinants of Foreign Direct Investment (FDI) in Malaysia: What Matters Most?
 
Foreign Investment and Its Effect on the Economic Growth in Nigeria: A Triang...
Foreign Investment and Its Effect on the Economic Growth in Nigeria: A Triang...Foreign Investment and Its Effect on the Economic Growth in Nigeria: A Triang...
Foreign Investment and Its Effect on the Economic Growth in Nigeria: A Triang...
 
The impact of foreign direct investment [fdi] on poverty reduction in nigeria
The impact of foreign direct investment [fdi] on poverty reduction in nigeriaThe impact of foreign direct investment [fdi] on poverty reduction in nigeria
The impact of foreign direct investment [fdi] on poverty reduction in nigeria
 
Factors Affecting the Investment Climate and the Role of Investments in Econo...
Factors Affecting the Investment Climate and the Role of Investments in Econo...Factors Affecting the Investment Climate and the Role of Investments in Econo...
Factors Affecting the Investment Climate and the Role of Investments in Econo...
 
The global economy in 2015
The global economy in 2015The global economy in 2015
The global economy in 2015
 
The impact of interest rates on the development of an emerging market empiric...
The impact of interest rates on the development of an emerging market empiric...The impact of interest rates on the development of an emerging market empiric...
The impact of interest rates on the development of an emerging market empiric...
 
61176257 determinant-of-foreign-direct-investment-in-the-malaysian-manufactur...
61176257 determinant-of-foreign-direct-investment-in-the-malaysian-manufactur...61176257 determinant-of-foreign-direct-investment-in-the-malaysian-manufactur...
61176257 determinant-of-foreign-direct-investment-in-the-malaysian-manufactur...
 
Interest Rate and Growth Nexus in Nigeria: The ARDL – Bound Test Approach
Interest Rate and Growth Nexus in Nigeria: The ARDL – Bound Test ApproachInterest Rate and Growth Nexus in Nigeria: The ARDL – Bound Test Approach
Interest Rate and Growth Nexus in Nigeria: The ARDL – Bound Test Approach
 
Remittances and Household Welfare in Pakistan
Remittances and Household Welfare in PakistanRemittances and Household Welfare in Pakistan
Remittances and Household Welfare in Pakistan
 
Human resource development and foreign remittances
Human resource development and foreign remittancesHuman resource development and foreign remittances
Human resource development and foreign remittances
 
Macroeconomic issues in Japan and Vietnam
Macroeconomic issues in Japan and VietnamMacroeconomic issues in Japan and Vietnam
Macroeconomic issues in Japan and Vietnam
 
Tax Incentives and Foreign Direct Investment in Nigeria
Tax Incentives and Foreign Direct Investment in NigeriaTax Incentives and Foreign Direct Investment in Nigeria
Tax Incentives and Foreign Direct Investment in Nigeria
 
Capital flight and exchange rate volatility in nigeria
Capital flight and exchange rate volatility in nigeriaCapital flight and exchange rate volatility in nigeria
Capital flight and exchange rate volatility in nigeria
 
Domestic debt and the growth of nigerian economy
Domestic debt and the growth of nigerian economyDomestic debt and the growth of nigerian economy
Domestic debt and the growth of nigerian economy
 
Financial liberalization and economic growth implications for the conduct of...
Financial liberalization and economic growth  implications for the conduct of...Financial liberalization and economic growth  implications for the conduct of...
Financial liberalization and economic growth implications for the conduct of...
 
The effect of external debt on economic growth
The effect of external debt on economic growthThe effect of external debt on economic growth
The effect of external debt on economic growth
 
Business mentoring and domestic entrepreneurship in nigeria’s
Business mentoring and domestic entrepreneurship in nigeria’sBusiness mentoring and domestic entrepreneurship in nigeria’s
Business mentoring and domestic entrepreneurship in nigeria’s
 

Similar to Foreign Capital Inflow and Domestic Private Investment in Nigeria - A Disaggregated Model

7.[68 76]investment, inflation and economic growth-empirical evidence from ni...
7.[68 76]investment, inflation and economic growth-empirical evidence from ni...7.[68 76]investment, inflation and economic growth-empirical evidence from ni...
7.[68 76]investment, inflation and economic growth-empirical evidence from ni...Alexander Decker
 
This is a lirature review sourced from Internet. It is not mine
This is a lirature review sourced from Internet. It is not mineThis is a lirature review sourced from Internet. It is not mine
This is a lirature review sourced from Internet. It is not minezerfudimd
 
Effect of FDI Inflows on Real Sector Economy of Nigeria
Effect of FDI Inflows on Real Sector Economy of NigeriaEffect of FDI Inflows on Real Sector Economy of Nigeria
Effect of FDI Inflows on Real Sector Economy of Nigeriaijtsrd
 
Specific Analysis of FDI and Economic Growth in Nigeria and Ghana
Specific Analysis of FDI and Economic Growth in Nigeria and GhanaSpecific Analysis of FDI and Economic Growth in Nigeria and Ghana
Specific Analysis of FDI and Economic Growth in Nigeria and Ghanainventionjournals
 
FINANCIAL DEEPENING AND FOREIGN DIRECT INVESTMENT IN NIGERIA
FINANCIAL DEEPENING AND FOREIGN DIRECT INVESTMENT IN NIGERIAFINANCIAL DEEPENING AND FOREIGN DIRECT INVESTMENT IN NIGERIA
FINANCIAL DEEPENING AND FOREIGN DIRECT INVESTMENT IN NIGERIAAJHSSR Journal
 
Ekeocha modelling the long run determinants of foreign portfolio investment i...
Ekeocha modelling the long run determinants of foreign portfolio investment i...Ekeocha modelling the long run determinants of foreign portfolio investment i...
Ekeocha modelling the long run determinants of foreign portfolio investment i...Alexander Decker
 
Modelling the Long Run Determinants of Foreign Portfolio in Nigeria
Modelling the Long Run Determinants of Foreign Portfolio in NigeriaModelling the Long Run Determinants of Foreign Portfolio in Nigeria
Modelling the Long Run Determinants of Foreign Portfolio in NigeriaMoses Oduh
 
11.effect of foreign direct investment and stock market development on econom...
11.effect of foreign direct investment and stock market development on econom...11.effect of foreign direct investment and stock market development on econom...
11.effect of foreign direct investment and stock market development on econom...Alexander Decker
 
Effect of foreign direct investment and stock market development on economic ...
Effect of foreign direct investment and stock market development on economic ...Effect of foreign direct investment and stock market development on economic ...
Effect of foreign direct investment and stock market development on economic ...Alexander Decker
 
Fund Mobilization and Sustainable Economic Growth the Nigerian's Experience
Fund Mobilization and Sustainable Economic Growth the Nigerian's ExperienceFund Mobilization and Sustainable Economic Growth the Nigerian's Experience
Fund Mobilization and Sustainable Economic Growth the Nigerian's Experienceijtsrd
 
International Journal of Humanities and Social Science Invention (IJHSSI)
International Journal of Humanities and Social Science Invention (IJHSSI)International Journal of Humanities and Social Science Invention (IJHSSI)
International Journal of Humanities and Social Science Invention (IJHSSI)inventionjournals
 
E373239
E373239E373239
E373239aijbm
 
Cointegration and Causality Inferences on Domestic Savings, Investment and Ec...
Cointegration and Causality Inferences on Domestic Savings, Investment and Ec...Cointegration and Causality Inferences on Domestic Savings, Investment and Ec...
Cointegration and Causality Inferences on Domestic Savings, Investment and Ec...Associate Professor in VSB Coimbatore
 
5.[34 42]effect of foreign direct investment and stock market development on ...
5.[34 42]effect of foreign direct investment and stock market development on ...5.[34 42]effect of foreign direct investment and stock market development on ...
5.[34 42]effect of foreign direct investment and stock market development on ...Alexander Decker
 
11.effect of foreign direct investment and stock market development on econom...
11.effect of foreign direct investment and stock market development on econom...11.effect of foreign direct investment and stock market development on econom...
11.effect of foreign direct investment and stock market development on econom...Alexander Decker
 
5.[34 42]effect of foreign direct investment and stock market development on ...
5.[34 42]effect of foreign direct investment and stock market development on ...5.[34 42]effect of foreign direct investment and stock market development on ...
5.[34 42]effect of foreign direct investment and stock market development on ...Alexander Decker
 
Modeling the effect of capital market empirical evidence from nigeria.
Modeling the effect of capital market empirical evidence from nigeria.Modeling the effect of capital market empirical evidence from nigeria.
Modeling the effect of capital market empirical evidence from nigeria.Alexander Decker
 
Is domestic private investment sensitive to macroeconomic indicators? Further...
Is domestic private investment sensitive to macroeconomic indicators? Further...Is domestic private investment sensitive to macroeconomic indicators? Further...
Is domestic private investment sensitive to macroeconomic indicators? Further...Premier Publishers
 

Similar to Foreign Capital Inflow and Domestic Private Investment in Nigeria - A Disaggregated Model (20)

7.[68 76]investment, inflation and economic growth-empirical evidence from ni...
7.[68 76]investment, inflation and economic growth-empirical evidence from ni...7.[68 76]investment, inflation and economic growth-empirical evidence from ni...
7.[68 76]investment, inflation and economic growth-empirical evidence from ni...
 
This is a lirature review sourced from Internet. It is not mine
This is a lirature review sourced from Internet. It is not mineThis is a lirature review sourced from Internet. It is not mine
This is a lirature review sourced from Internet. It is not mine
 
Effect of FDI Inflows on Real Sector Economy of Nigeria
Effect of FDI Inflows on Real Sector Economy of NigeriaEffect of FDI Inflows on Real Sector Economy of Nigeria
Effect of FDI Inflows on Real Sector Economy of Nigeria
 
Specific Analysis of FDI and Economic Growth in Nigeria and Ghana
Specific Analysis of FDI and Economic Growth in Nigeria and GhanaSpecific Analysis of FDI and Economic Growth in Nigeria and Ghana
Specific Analysis of FDI and Economic Growth in Nigeria and Ghana
 
FINANCIAL DEEPENING AND FOREIGN DIRECT INVESTMENT IN NIGERIA
FINANCIAL DEEPENING AND FOREIGN DIRECT INVESTMENT IN NIGERIAFINANCIAL DEEPENING AND FOREIGN DIRECT INVESTMENT IN NIGERIA
FINANCIAL DEEPENING AND FOREIGN DIRECT INVESTMENT IN NIGERIA
 
Ekeocha modelling the long run determinants of foreign portfolio investment i...
Ekeocha modelling the long run determinants of foreign portfolio investment i...Ekeocha modelling the long run determinants of foreign portfolio investment i...
Ekeocha modelling the long run determinants of foreign portfolio investment i...
 
Modelling the Long Run Determinants of Foreign Portfolio in Nigeria
Modelling the Long Run Determinants of Foreign Portfolio in NigeriaModelling the Long Run Determinants of Foreign Portfolio in Nigeria
Modelling the Long Run Determinants of Foreign Portfolio in Nigeria
 
11.effect of foreign direct investment and stock market development on econom...
11.effect of foreign direct investment and stock market development on econom...11.effect of foreign direct investment and stock market development on econom...
11.effect of foreign direct investment and stock market development on econom...
 
Effect of foreign direct investment and stock market development on economic ...
Effect of foreign direct investment and stock market development on economic ...Effect of foreign direct investment and stock market development on economic ...
Effect of foreign direct investment and stock market development on economic ...
 
Fund Mobilization and Sustainable Economic Growth the Nigerian's Experience
Fund Mobilization and Sustainable Economic Growth the Nigerian's ExperienceFund Mobilization and Sustainable Economic Growth the Nigerian's Experience
Fund Mobilization and Sustainable Economic Growth the Nigerian's Experience
 
International Journal of Humanities and Social Science Invention (IJHSSI)
International Journal of Humanities and Social Science Invention (IJHSSI)International Journal of Humanities and Social Science Invention (IJHSSI)
International Journal of Humanities and Social Science Invention (IJHSSI)
 
International Capital Flows and Inclusive Growth in Nigeria
International Capital Flows and Inclusive Growth in NigeriaInternational Capital Flows and Inclusive Growth in Nigeria
International Capital Flows and Inclusive Growth in Nigeria
 
E373239
E373239E373239
E373239
 
Cointegration and Causality Inferences on Domestic Savings, Investment and Ec...
Cointegration and Causality Inferences on Domestic Savings, Investment and Ec...Cointegration and Causality Inferences on Domestic Savings, Investment and Ec...
Cointegration and Causality Inferences on Domestic Savings, Investment and Ec...
 
5.[34 42]effect of foreign direct investment and stock market development on ...
5.[34 42]effect of foreign direct investment and stock market development on ...5.[34 42]effect of foreign direct investment and stock market development on ...
5.[34 42]effect of foreign direct investment and stock market development on ...
 
11.effect of foreign direct investment and stock market development on econom...
11.effect of foreign direct investment and stock market development on econom...11.effect of foreign direct investment and stock market development on econom...
11.effect of foreign direct investment and stock market development on econom...
 
5.[34 42]effect of foreign direct investment and stock market development on ...
5.[34 42]effect of foreign direct investment and stock market development on ...5.[34 42]effect of foreign direct investment and stock market development on ...
5.[34 42]effect of foreign direct investment and stock market development on ...
 
Impact of Monetary Policy on Capital Inflows in Nigeria
Impact of Monetary Policy on Capital Inflows in NigeriaImpact of Monetary Policy on Capital Inflows in Nigeria
Impact of Monetary Policy on Capital Inflows in Nigeria
 
Modeling the effect of capital market empirical evidence from nigeria.
Modeling the effect of capital market empirical evidence from nigeria.Modeling the effect of capital market empirical evidence from nigeria.
Modeling the effect of capital market empirical evidence from nigeria.
 
Is domestic private investment sensitive to macroeconomic indicators? Further...
Is domestic private investment sensitive to macroeconomic indicators? Further...Is domestic private investment sensitive to macroeconomic indicators? Further...
Is domestic private investment sensitive to macroeconomic indicators? Further...
 

More from International Journal of World Policy and Development Studies

More from International Journal of World Policy and Development Studies (20)

From Growth Poles and Clusters to Business Ecosystems Dynamics: The ILDI Coun...
From Growth Poles and Clusters to Business Ecosystems Dynamics: The ILDI Coun...From Growth Poles and Clusters to Business Ecosystems Dynamics: The ILDI Coun...
From Growth Poles and Clusters to Business Ecosystems Dynamics: The ILDI Coun...
 
Challenges of Participatory Development in West Africa: A Study of Nigeria’s ...
Challenges of Participatory Development in West Africa: A Study of Nigeria’s ...Challenges of Participatory Development in West Africa: A Study of Nigeria’s ...
Challenges of Participatory Development in West Africa: A Study of Nigeria’s ...
 
Evaluating the Programs and Procedures of Project Planning and Management: th...
Evaluating the Programs and Procedures of Project Planning and Management: th...Evaluating the Programs and Procedures of Project Planning and Management: th...
Evaluating the Programs and Procedures of Project Planning and Management: th...
 
Conservation Agriculture: An Agroecological Approach to Adapting and Mitigati...
Conservation Agriculture: An Agroecological Approach to Adapting and Mitigati...Conservation Agriculture: An Agroecological Approach to Adapting and Mitigati...
Conservation Agriculture: An Agroecological Approach to Adapting and Mitigati...
 
Dynamics in Academic Achievement of Female Education in Jima Arjo Woreda and ...
Dynamics in Academic Achievement of Female Education in Jima Arjo Woreda and ...Dynamics in Academic Achievement of Female Education in Jima Arjo Woreda and ...
Dynamics in Academic Achievement of Female Education in Jima Arjo Woreda and ...
 
Economic Loss of Timber Caused by Over Stumps and Defects in Community Forest...
Economic Loss of Timber Caused by Over Stumps and Defects in Community Forest...Economic Loss of Timber Caused by Over Stumps and Defects in Community Forest...
Economic Loss of Timber Caused by Over Stumps and Defects in Community Forest...
 
Stakeholders’ Perspective of Role of Policy and Legislation in Achieving Medi...
Stakeholders’ Perspective of Role of Policy and Legislation in Achieving Medi...Stakeholders’ Perspective of Role of Policy and Legislation in Achieving Medi...
Stakeholders’ Perspective of Role of Policy and Legislation in Achieving Medi...
 
Agricultural Informatics as a Branch of Study in Information Sciences and Tec...
Agricultural Informatics as a Branch of Study in Information Sciences and Tec...Agricultural Informatics as a Branch of Study in Information Sciences and Tec...
Agricultural Informatics as a Branch of Study in Information Sciences and Tec...
 
Problems and Prospects of Subsistence Agriculture among Peasant Farmers in Ru...
Problems and Prospects of Subsistence Agriculture among Peasant Farmers in Ru...Problems and Prospects of Subsistence Agriculture among Peasant Farmers in Ru...
Problems and Prospects of Subsistence Agriculture among Peasant Farmers in Ru...
 
Socioeconomic Impact of COVID-19 in Oil Exporting Countries: An Analytical Re...
Socioeconomic Impact of COVID-19 in Oil Exporting Countries: An Analytical Re...Socioeconomic Impact of COVID-19 in Oil Exporting Countries: An Analytical Re...
Socioeconomic Impact of COVID-19 in Oil Exporting Countries: An Analytical Re...
 
COVID-19 Induced Changes on Lifestyles Education and Socio-Economic Activitie...
COVID-19 Induced Changes on Lifestyles Education and Socio-Economic Activitie...COVID-19 Induced Changes on Lifestyles Education and Socio-Economic Activitie...
COVID-19 Induced Changes on Lifestyles Education and Socio-Economic Activitie...
 
Geopolitics of Religion: How Does Religion Influence International Relations ...
Geopolitics of Religion: How Does Religion Influence International Relations ...Geopolitics of Religion: How Does Religion Influence International Relations ...
Geopolitics of Religion: How Does Religion Influence International Relations ...
 
Lexico-semantic Features as Creative/Stylistic Strategies in Joseph Edoki’s T...
Lexico-semantic Features as Creative/Stylistic Strategies in Joseph Edoki’s T...Lexico-semantic Features as Creative/Stylistic Strategies in Joseph Edoki’s T...
Lexico-semantic Features as Creative/Stylistic Strategies in Joseph Edoki’s T...
 
Female Suicide Bombers in Boko Haram Insurgency: Victims or Perpetrators?
Female Suicide Bombers in Boko Haram Insurgency: Victims or Perpetrators?Female Suicide Bombers in Boko Haram Insurgency: Victims or Perpetrators?
Female Suicide Bombers in Boko Haram Insurgency: Victims or Perpetrators?
 
The Graphic Communication Actor: Generating Visual Rhetoric for Development I...
The Graphic Communication Actor: Generating Visual Rhetoric for Development I...The Graphic Communication Actor: Generating Visual Rhetoric for Development I...
The Graphic Communication Actor: Generating Visual Rhetoric for Development I...
 
Niger Delta Crises and the Way Forward: A Study of the Mood System in Helon H...
Niger Delta Crises and the Way Forward: A Study of the Mood System in Helon H...Niger Delta Crises and the Way Forward: A Study of the Mood System in Helon H...
Niger Delta Crises and the Way Forward: A Study of the Mood System in Helon H...
 
Multicultural Inevitability: Case of Georgia
Multicultural Inevitability: Case of GeorgiaMulticultural Inevitability: Case of Georgia
Multicultural Inevitability: Case of Georgia
 
Unseen Contributor to the Tensions in Georgia
Unseen Contributor to the Tensions in GeorgiaUnseen Contributor to the Tensions in Georgia
Unseen Contributor to the Tensions in Georgia
 
Developments on Helix Theory: Exploring a Micro-Evolutionary Repositioning in...
Developments on Helix Theory: Exploring a Micro-Evolutionary Repositioning in...Developments on Helix Theory: Exploring a Micro-Evolutionary Repositioning in...
Developments on Helix Theory: Exploring a Micro-Evolutionary Repositioning in...
 
Dynamic Relationship Between Global Oil Price and the Eswatini’s Exchange Rat...
Dynamic Relationship Between Global Oil Price and the Eswatini’s Exchange Rat...Dynamic Relationship Between Global Oil Price and the Eswatini’s Exchange Rat...
Dynamic Relationship Between Global Oil Price and the Eswatini’s Exchange Rat...
 

Recently uploaded

Teck Investor Presentation, April 24, 2024
Teck Investor Presentation, April 24, 2024Teck Investor Presentation, April 24, 2024
Teck Investor Presentation, April 24, 2024TeckResourcesLtd
 
VIP Kolkata Call Girl Entally 👉 8250192130 Available With Room
VIP Kolkata Call Girl Entally 👉 8250192130  Available With RoomVIP Kolkata Call Girl Entally 👉 8250192130  Available With Room
VIP Kolkata Call Girl Entally 👉 8250192130 Available With Roomdivyansh0kumar0
 
VIP 7001035870 Find & Meet Hyderabad Call Girls Abids high-profile Call Girl
VIP 7001035870 Find & Meet Hyderabad Call Girls Abids high-profile Call GirlVIP 7001035870 Find & Meet Hyderabad Call Girls Abids high-profile Call Girl
VIP 7001035870 Find & Meet Hyderabad Call Girls Abids high-profile Call Girladitipandeya
 
Q3 FY24 Earnings Conference Call Presentation
Q3 FY24 Earnings Conference Call PresentationQ3 FY24 Earnings Conference Call Presentation
Q3 FY24 Earnings Conference Call PresentationSysco_Investors
 
Sustainability Leadership, April 26 2024
Sustainability Leadership, April 26 2024Sustainability Leadership, April 26 2024
Sustainability Leadership, April 26 2024TeckResourcesLtd
 
Methanex Investor Presentation (April 2024)
Methanex Investor Presentation (April 2024)Methanex Investor Presentation (April 2024)
Methanex Investor Presentation (April 2024)Methanex Corporation
 
Call Girls in Friends Colony 9711199171 Delhi Enjoy Call Girls With Our Escorts
Call Girls in Friends Colony 9711199171 Delhi Enjoy Call Girls With Our EscortsCall Girls in Friends Colony 9711199171 Delhi Enjoy Call Girls With Our Escorts
Call Girls in Friends Colony 9711199171 Delhi Enjoy Call Girls With Our Escortsindian call girls near you
 
Collective Mining | Corporate Presentation - April 2024
Collective Mining | Corporate Presentation - April 2024Collective Mining | Corporate Presentation - April 2024
Collective Mining | Corporate Presentation - April 2024CollectiveMining1
 
Collective Mining | Corporate Presentation - May 2024
Collective Mining | Corporate Presentation - May 2024Collective Mining | Corporate Presentation - May 2024
Collective Mining | Corporate Presentation - May 2024CollectiveMining1
 
slideshare Call girls Noida Escorts 9999965857 henakhan
slideshare Call girls Noida Escorts 9999965857 henakhanslideshare Call girls Noida Escorts 9999965857 henakhan
slideshare Call girls Noida Escorts 9999965857 henakhanhanshkumar9870
 
Russian Call Girls Kolkata Indira 🤌 8250192130 🚀 Vip Call Girls Kolkata
Russian Call Girls Kolkata Indira 🤌  8250192130 🚀 Vip Call Girls KolkataRussian Call Girls Kolkata Indira 🤌  8250192130 🚀 Vip Call Girls Kolkata
Russian Call Girls Kolkata Indira 🤌 8250192130 🚀 Vip Call Girls Kolkataanamikaraghav4
 
Corporate Presentation Probe May 2024.pdf
Corporate Presentation Probe May 2024.pdfCorporate Presentation Probe May 2024.pdf
Corporate Presentation Probe May 2024.pdfProbe Gold
 

Recently uploaded (20)

Teck Investor Presentation, April 24, 2024
Teck Investor Presentation, April 24, 2024Teck Investor Presentation, April 24, 2024
Teck Investor Presentation, April 24, 2024
 
VIP Kolkata Call Girl Entally 👉 8250192130 Available With Room
VIP Kolkata Call Girl Entally 👉 8250192130  Available With RoomVIP Kolkata Call Girl Entally 👉 8250192130  Available With Room
VIP Kolkata Call Girl Entally 👉 8250192130 Available With Room
 
Rohini Sector 17 Call Girls Delhi 9999965857 @Sabina Saikh No Advance
Rohini Sector 17 Call Girls Delhi 9999965857 @Sabina Saikh No AdvanceRohini Sector 17 Call Girls Delhi 9999965857 @Sabina Saikh No Advance
Rohini Sector 17 Call Girls Delhi 9999965857 @Sabina Saikh No Advance
 
VIP 7001035870 Find & Meet Hyderabad Call Girls Abids high-profile Call Girl
VIP 7001035870 Find & Meet Hyderabad Call Girls Abids high-profile Call GirlVIP 7001035870 Find & Meet Hyderabad Call Girls Abids high-profile Call Girl
VIP 7001035870 Find & Meet Hyderabad Call Girls Abids high-profile Call Girl
 
Q3 FY24 Earnings Conference Call Presentation
Q3 FY24 Earnings Conference Call PresentationQ3 FY24 Earnings Conference Call Presentation
Q3 FY24 Earnings Conference Call Presentation
 
Sustainability Leadership, April 26 2024
Sustainability Leadership, April 26 2024Sustainability Leadership, April 26 2024
Sustainability Leadership, April 26 2024
 
Methanex Investor Presentation (April 2024)
Methanex Investor Presentation (April 2024)Methanex Investor Presentation (April 2024)
Methanex Investor Presentation (April 2024)
 
Call Girls in Friends Colony 9711199171 Delhi Enjoy Call Girls With Our Escorts
Call Girls in Friends Colony 9711199171 Delhi Enjoy Call Girls With Our EscortsCall Girls in Friends Colony 9711199171 Delhi Enjoy Call Girls With Our Escorts
Call Girls in Friends Colony 9711199171 Delhi Enjoy Call Girls With Our Escorts
 
Collective Mining | Corporate Presentation - April 2024
Collective Mining | Corporate Presentation - April 2024Collective Mining | Corporate Presentation - April 2024
Collective Mining | Corporate Presentation - April 2024
 
Rohini Sector 15 Call Girls Delhi 9999965857 @Sabina Saikh No Advance
Rohini Sector 15 Call Girls Delhi 9999965857 @Sabina Saikh No AdvanceRohini Sector 15 Call Girls Delhi 9999965857 @Sabina Saikh No Advance
Rohini Sector 15 Call Girls Delhi 9999965857 @Sabina Saikh No Advance
 
Call Girls 🫤 Nehru Place ➡️ 9999965857 ➡️ Delhi 🫦 Russian Escorts FULL ENJOY
Call Girls 🫤 Nehru Place ➡️ 9999965857  ➡️ Delhi 🫦  Russian Escorts FULL ENJOYCall Girls 🫤 Nehru Place ➡️ 9999965857  ➡️ Delhi 🫦  Russian Escorts FULL ENJOY
Call Girls 🫤 Nehru Place ➡️ 9999965857 ➡️ Delhi 🫦 Russian Escorts FULL ENJOY
 
Call Girls In South Delhi 📱 9999965857 🤩 Delhi 🫦 HOT AND SEXY VVIP 🍎 SERVICE
Call Girls In South Delhi 📱  9999965857  🤩 Delhi 🫦 HOT AND SEXY VVIP 🍎 SERVICECall Girls In South Delhi 📱  9999965857  🤩 Delhi 🫦 HOT AND SEXY VVIP 🍎 SERVICE
Call Girls In South Delhi 📱 9999965857 🤩 Delhi 🫦 HOT AND SEXY VVIP 🍎 SERVICE
 
@9999965857 🫦 Sexy Desi Call Girls Vaishali 💓 High Profile Escorts Delhi 🫶
@9999965857 🫦 Sexy Desi Call Girls Vaishali 💓 High Profile Escorts Delhi 🫶@9999965857 🫦 Sexy Desi Call Girls Vaishali 💓 High Profile Escorts Delhi 🫶
@9999965857 🫦 Sexy Desi Call Girls Vaishali 💓 High Profile Escorts Delhi 🫶
 
Collective Mining | Corporate Presentation - May 2024
Collective Mining | Corporate Presentation - May 2024Collective Mining | Corporate Presentation - May 2024
Collective Mining | Corporate Presentation - May 2024
 
Model Call Girl in Uttam Nagar Delhi reach out to us at 🔝9953056974🔝
Model Call Girl in Uttam Nagar Delhi reach out to us at 🔝9953056974🔝Model Call Girl in Uttam Nagar Delhi reach out to us at 🔝9953056974🔝
Model Call Girl in Uttam Nagar Delhi reach out to us at 🔝9953056974🔝
 
Call Girls 🫤 Mukherjee Nagar ➡️ 9999965857 ➡️ Delhi 🫦 Russian Escorts FULL ...
Call Girls 🫤 Mukherjee Nagar ➡️ 9999965857  ➡️ Delhi 🫦  Russian Escorts FULL ...Call Girls 🫤 Mukherjee Nagar ➡️ 9999965857  ➡️ Delhi 🫦  Russian Escorts FULL ...
Call Girls 🫤 Mukherjee Nagar ➡️ 9999965857 ➡️ Delhi 🫦 Russian Escorts FULL ...
 
VIP Call Girls Kolkata Kirti Call Now 8617697112 Kolkata Escorts
VIP Call Girls Kolkata Kirti Call Now 8617697112 Kolkata EscortsVIP Call Girls Kolkata Kirti Call Now 8617697112 Kolkata Escorts
VIP Call Girls Kolkata Kirti Call Now 8617697112 Kolkata Escorts
 
slideshare Call girls Noida Escorts 9999965857 henakhan
slideshare Call girls Noida Escorts 9999965857 henakhanslideshare Call girls Noida Escorts 9999965857 henakhan
slideshare Call girls Noida Escorts 9999965857 henakhan
 
Russian Call Girls Kolkata Indira 🤌 8250192130 🚀 Vip Call Girls Kolkata
Russian Call Girls Kolkata Indira 🤌  8250192130 🚀 Vip Call Girls KolkataRussian Call Girls Kolkata Indira 🤌  8250192130 🚀 Vip Call Girls Kolkata
Russian Call Girls Kolkata Indira 🤌 8250192130 🚀 Vip Call Girls Kolkata
 
Corporate Presentation Probe May 2024.pdf
Corporate Presentation Probe May 2024.pdfCorporate Presentation Probe May 2024.pdf
Corporate Presentation Probe May 2024.pdf
 

Foreign Capital Inflow and Domestic Private Investment in Nigeria - A Disaggregated Model

  • 1. International Journal of World Policy and Development Studies ISSN: 2415-2331 Vol. 1, No. 1, pp: 1-15, 2015 URL: http://arpgweb.com/?ic=journal&journal=11&info=aims 1 Academic Research Publishing Group Foreign Capital Inflow and Domestic Private Investment in Nigeria - A Disaggregated Model Ogbonna Innocent Chukwuka Department of Economics, Enugu State University of Science and Technology (ESUT), Enugu State, Nigeria 1. Introduction A consensus exists in economic literature regarding the definition of investment. Any production of capital such as machinery, dwellings, inventories, or the net increase to existing capital represents investment. The importance of investment can be gauged from various perspectives. First, investment is a key component of aggregate demand and of gross national product, and is positively related with both. Second, investment is important because variations in investment expenditures working through the accelerator are highly correlated with variations in GNP, called the business cycle. Third, because investment expands the productive capacity, it is a major explanation of and contribution to economic development or long run growth (Iyoha, 2004). Investment is generally financed through domestic and/or foreign savings. While it is financed from domestic saving in typical industrialized and advanced countries of the world, foreign savings are often used to supplement domestic saving in the financing of investment in many developing economies. This is because domestic savings tend to be low in a typical developing country due largely to low income and under-developed financial system. The inadequate savings are indicative that savings will fall short of „required investment‟, that is, investment needed to grow at a target rate. Inflow of capital representing foreign savings is required to fill the gap. Increased inflows augment domestic savings, facilitate higher domestic capital accumulation in physical and human capital, increase efficient use of factor inputs are and hence enhance economic growth and development (Calvo et al., 1994). Capital inflow into Nigeria has shown some impressive outcomes since late 1990s. For instance, while inflow was ₦4,374.72 ($544.12) in 1990, it rose to ₦74,451.17 ($3,401.15) in 1997. The figure rose astronomically in 2005 and 2012 with inflow values of ₦2,670,747.79 ($20,373.39) and ₦6,257,924.40 ($40,114.90) respectively. Average annual inflow in the period 1986–1994 was ₦1,876.07 ($1,508.54) but rose to ₦772,347.70 ($13,729.97) in 1995 – 2012 period. As proportion of GDP, it was equally impressive as it was 7.04% in 1987, 20.64% in 2006, but fell slightly to 19.31% in 2009. When disaggregated, inflow components were equally impressive both in value and as ratio of GDP. Specifically, foreign direct investment (FDI), portfolio investment (PFI), and remittances (REM) was ₦2,452.8 ($610.55), ₦4,353.1 ($1,082.9), and ₦12.4 ($4.5) million in 1987, rose to ₦115,952.2 ($1,140.14), ₦51,079.1 ($502.3), ₦177,251.9 ($1,391.8) million in 2000 and further to ₦1,273,815.8 ($8,554.84), ₦70,938.5 Abstract: Foreign capital inflow (KI) is arguably a vital source of external capital, especially for developing countries with low domestic savings rate. Investigating the trend of KI into Nigeria, we observed that as a ratio of GDP it was 0.67% in 1979, 6.88% in 1989, 9.45% in 1999, and 19.31% in 2009. Thus, this study „Foreign Capital Inflow and Domestic Private Investment in Nigeria – A Disaggregated Model‟ is intended to examine the relationship among aggregate KI and domestic private investment (DPI) on one hand, and disaggregated KI and DPI on the other in the period 1986Q1-2012Q4. Variables such as DPI, KI, three inflow components: (foreign direct investment (FDI), portfolio investment (PFI), and remittances (REM)) and dummy are employed. The framework of Khan (2011) which expressed DPI as a function of the explanatory variables was modified and adopted. With coefficient of -0.021 and t-statistic of -0.968 for the first model, the results reveal that aggregate KI has inverse but insignificant relationship with DPI in the short and long run. When disaggregated (second model), FDI coefficient is 0.190 with t-statistic value of 3.013 indicative that the variable has significant growth-inducing impact on DPI. The coefficients of PFI and REM are -0.017 and -0.121 with t- statistic values of -1.105 and -4.887 respectively, suggestive that both have depressing impact on DPI. The joint depressing impact of PFI and REM on DPI is greater than the expansionary impact of FDI on DPI. The coefficient of dummy was found to be significantly positive in determining DPI. Keywords: Foreign capital inflow; Foreign direct investment; Portfolio investment; Private domestic investment; Remittances.
  • 2. International Journal of World Policy and Development Studies, 2015, 1(1): 1-15 2 ($489.3), and ₦2,710,252.5 ($21,075.1) million in 2009 respectively. In 1987 FDI, PFI, and REM as ratio of GDP was 2.5, 4.5, and 0.02 respectively, while it rose to 5.1 for FDI, 14.0 for REM, while PFI fell to 0.3 in 2009. Despite these impressive inflow figures, the Nigerian government has, secretly and publicly taken steps to encourage private sector-led investment and growth. The government has made the regulatory as well as policy environment simple for domestic private investment and reduced limitations on foreign investment. The privatization of public enterprises, which was informed by the dismal performance of enterprises owned by government in Nigeria, the establishment of free trade zones (FTZs), and the investment promotion council (IPC) are all aimed at assigning greater importance to the more efficient and more effective private sector and its growth potential than was the case. Besides public enterprises and investment reforms, interest rates which hitherto had been kept low in accordance with Keynesian investment theory were deregulated mid 1986. This deregulation, which was in tandem with McKinnon and Shaw interest rates, savings and investment hypothesis, were intended to induce savers and hence stimulate investment. In line with McKinnon-Shaw theory, one of the main purposes of 1986 “interest rate policy in the monetary and credit guidelines” which has been modified periodically is the stimulation of savings and investment. Evidence available is indicative that financial savings increased substantially since 1986. As a ratio of GDP, it was 18.6% in 1986, rose to 32.3% in 1991, further to 39.1% in 2000 and 40.8% in 2012. However, these impressive inflow figures and the increases in the rate of savings have failed to elicit the required improvement in domestic private investment and hence economic growth in Nigeria. On its part, investment-GDP ratio which was 3.7% in 1987 rose marginally to 4.0% in 1994, but down to 3.3% in 2000 before rising to 7.9% in 2010. Table-1. Trends in Aggregate Capital Inflow (KI), Domestic Private Investment (DPI), and Savings (S), (value, ratio of GDP, and growth rate), in Nigeria (1986 – 2012) Year Domestic Private Investment Aggregate Capital Inflow (KI) Savings (S) Value ($m) % GDP % Growth Value ($m) % GDP % Growth Value ($m) % GDP % Growth 1986 857 3.1 -8.44 857 1,36 -42.73 3858 18.62 -13.19 1987 938 3.9 9.38 938 7.04 497.66 5999 24.90 -23.57 1988 801 3.56 -14.56 801 4.11 -43.65 4712 20.25 4.46 1989 882 5.61 10.09 882 6.88 75.14 9527 39.32 2.00 1990 1836 6.00 108.28 544 1.78 -113.02 9869 32.09 38.65 1991 1380 5.03 -24.80 718 2.56 32.02 8853 32.32 -0.38 1992 1199 4.08 -13.10 3083 10.54 329.16 7850 26.79 -2.99 1993 761 4.84 -36.5 2121 13.05 -31.19 3657 23.16 16.00 1994 720 4.00 -5.30 2500 13.92 17.85 3167 17.51 -10.16 1995 1374 4.84 90.69 1812 6.44 -27.51 5378 18.84 -26.20 1996 1599 4.54 16.38 2393 7.30 32.03 4930 14.09 18.10 1997 1772 4.97 10.82 3401 8.84 42.16 5395 15.06 8.84 1998 1462 4.57 -17.49 2588 7.51 -23.91 5856 1.83 -5.06 1999 1395 3.89 -4.58 2317 9.45 -10.47 6781 18.90 -2.93 2000 1546 3.33 10.82 3034 7.41 30.96 18142 39.11 17.03 2001 1573 3.56 1.72 3139 7.14 3.46 7361 16.68 -21.71 2002 2524 4.26 60.42 3289 5.79 4.79 9203 15.57 20.34 2003 3886 5.74 53.96 3251 4.74 -0.12 9655 14.27 50.14 2004 3832 4.37 -1.39 4324 5.25 33.01 16932 19.27 -24.00 2005 3493 3.14 -8.85 20373 18.08 371.20 20241 18.03 -10.46 2006 6840 4.72 95.82 23556 20.64 15.62 43465 29.89 59.39 2007 9099 5.44 33.03 25493 15.32 8.22 20391 12.25 41.73 2008 10408 4.99 14.38 26449 12.78 3.75 48111 23.12 -0.73 2009 12723 7.51 22.23 30117 19.31 13.87 20048 11.83 34.77 2010 15593 7.94 22.60 31058 13.67 3.12 49856 21.72 18.33 2011 15028 6.10 -3.60 22413 9.46 -27.83 65893 26.82 -10.80 2012 13296 5.32 -11.5 40115 15.55 28.98 107066 40.77 -19.89 Source: Plotted by the Author based on the Data from African Development Report (2009) and World Development Indicators (WDI) 2012 From table 1, the relationship between DPI growth and KI is not clear. For instance, in 1987, KI growth was 497.7% while DPI growth was 4.6%. But by 1990, the growth rate of KI fell to a negative figure of 113% while DPI instead rose to 6.2%. The unclear trend is also observable in 1995 where KI growth was negative at 27.5% but DPI growth rose to 11.1%. In 2005 KI grew by 371.2% and expectedly DPI also grew by 13.4%, but when KI growth fell to 13.9% in 2009, that of DPI instead rose to 22.2%. The same unclear trend characterized KI and DPI growth in 2012. It is therefore necessary to establish a relationship between DPI and KI in Nigeria. The unimpressive private domestic investment outcome despite these reform efforts is the major reason for this work. Cross-country evidence abound that capital inflows crowd out domestic investment, or that inflows finance
  • 3. International Journal of World Policy and Development Studies, 2015, 1(1): 1-15 3 current account deficit, or that they are often used to increase the financing of foreign reserves instead of investment in recipient economies. The overall result is that more foreign inflows into developing economies are converted into their reserves thereby depleting savings meant for developed economies (Bos et al., 1974; Saltz, 1999). The type of inflow into an economy is also important. Portfolio flows (equity) which appears to be speculatively driven by short term motive in a world of unequal access to information have positive effect on investment only in the economies with more and highly developed domestic financial systems (Hecht et al., 2004). On its part, flows of FDI are more permanent and less volatile and have proved to be remarkably more stable even when the host economy is in crises, suggestive of being driven by more permanent desire for economic prosperity of recipient countries (Elitza, 2008). Workers‟ remittances or transfers from international migrants are important source of foreign finance and exchange for recipients. They assist stabilize irregular incomes, build human and social capital, and serve as financial support to many poor families in developing countries. This study will disaggregate capital inflow into components and examine three types: Foreign Direct Investment (FDI), Portfolio Investment (PFI), and Remittances (REM). This is done under two regime periods (1986-1994; 1995-2012) to ascertain their individual and joint impacts on private domestic investment in Nigeria. The sum of these three represents capital inflow (KI) as far as this study is concerned, and the word components or types are used interchangeably. While several factors may have accounted for the poor response of private domestic investment, it is pertinent and relevant to examine the determinants of private domestic investment in Nigeria using foreign capital inflow and its components as explanatory variables of interest. So far, time series studies for Nigeria on capital inflow and domestic private investment are hard to come by. Again, none of the few studies reviewed on capital inflow- domestic private investment included remittances among inflow components of choice despite its impressive inflow value and growth potentials (Ukeje and Obiechina, 2013). Hence, the objectives of this study are to evaluate the growth-inducing impact of aggregate and disaggregated capital inflow on private domestic investment in Nigeria in the period 1986Q1 to 2012Q4. While evidence from single equation shall be provided, the error correction framework shall be utilized to provide evidence on the subject of interest. 2. Theoretical Literature 2.1. Investment Theory Many theories are forwarded in the theoretical literature to clarify the changes in capital formation. Five are briefly discussed. 2.1.1. The Flexible Accelerator Theory Flexible Accelerator Theory originated by Koyck (1954) hypothesizes that investment depends on the rate of interest and on the change of output. The reasoning here is that it is not the level of output that induces new net investment but rather, it is the change in output. The presumption is that firms will need to expand their productive capacity only if output increases, indicative that the relationship between growth of output and the level of investment is the “accelerator principle” since it assumes that a rise in the growth rate of output – an acceleration of output growth – is required to raise the level of investment. Hence, this variable relationship between investment and growth in output is called the flexible-accelerator framework (Iyoha, 2004). 2.1.2. Marginal Efficiency of Capital Theory Perhaps, the most accepted criterion for investment decisions in macroeconomic analysis was suggested by Keynes using the marginal efficiency of capital/marginal efficiency of investment (MEC/MEI) approach. According to Keynes (1936), a businessman will invest in, say, a machine, if he finds it profitable, that is, if it is more profitable than buying an existing asset, say, a bond. To simplify the approach, assume that the businessman has only two choices: invest in the machine or buy bond. If he chose to buy the machine, the decision to invest in new machines depends on the profitability of such investment against the profitability of holding existing financial assets. Hence, a businessman will invest in a new machine if its rate of return over cost (RROC) is greater than the market interest rate. The RROC, which is the yield on such investment, is what Keynes called the MEC. MEC may be defined as an internal rate or return or a yield. Keynesian formulation using MEC suggest that investment is inversely linked to the market rate of interest. Thus, ceteris paribus, an increase in the market rate of interest would lead to a decline in investment while a decrease in interest rate would result in an increase in investment. 2.1.3. The Profit Theory of Investment A major modification of the basic investment demand function suggests that investment depends both on the rate of interest and the level of income. Thus, the hypothesis assumes that higher gross profit results in higher generation of internal funds (higher levels of income) which are associated with increased volume of investment while low income level and economic activity are associated with low levels of investment demand (Chirinko, 1993). Thus, this formulation brings in the role of profits and liquidity as partial determinants of investment demand in modern economies.
  • 4. International Journal of World Policy and Development Studies, 2015, 1(1): 1-15 4 2.1.4. The Two-Gap Theory of Investment Another variant of investment theory is the two-gap model developed by McKinnon R.I. (1964) cited in Iyoha (2004). The theory posits that development in developing countries may be constrained by the existence of two gaps – the savings gap and the foreign exchange gap. The savings gap arises because, for a variety of reasons, domestic savings tend to be low in the typical developing country. Thus, savings will inevitably fall short of “required investment”, that is, investment necessary to grow at a target rate. The option to fill this gap rests with the capacity/ability of such country to attract foreign savings. This will come in the form of capital inflow. Foreign capital permits the developing country to invest more than it can save domestically. Papanek (1960) has suggested that the “need for outside assistance depends on the rate of development considered desirable and the extent to which a country can reach that rate using its own resources”. It is obvious that capital inflow recipient country is more likely to achieve the objective of rapid economic growth if the inflow received is effectively utilized. Hecht et al. (2004) state that capital inflows unarguably raise investment rates in developing economies. They argue that because savings are abundant in developed countries with high capital per worker, return on investment is low. On the other hand, capital per worker is low and return on investment high in developing countries, but savings are scarce. Hence, if there is free movement of capital internationally, a part of the savings of the advanced economies would be invested in the developing economies. If this happens, investment rate would fall below the saving rate in developed economies and rise above the saving rate in developing economies. Given freer international capital mobility, poorer nations are expected to achieve faster economic growth and thus fast-track economic convergence among the nations of the world. Beneficial as they seem, the relationship between foreign capital inflow and domestic investment may equally be negative. Singer (1950) as well as Prebisch (1968) earlier studied FDI and argued that the target economies receive very few benefits of FDI, because these benefits are sent to the country from where FDI emanated. One point regarding the negative impact of FDI on the host economy‟s economic growth prospects is that even though FDI may increase the level and productivity of investment, it reduces growth rate due to input price variations and misallocation of resources. Bos et al. (1974) identified that price distortions as a result of protectionism, reduction in natural resources, and monopoly power are other factors that cause FDI to negatively impact on growth. 2.1.5. Financial Deepening Theory McKinnon R. I. (1973) and Shaw (1973) equally developed modern theory on capital formation emphasizing the need to deepen the financial system and raise the rate of interest as determinants of output growth. They opined that if an economy was deregulated and freed from repressive conditions, savings and investment will increase and hence output growth. Accordingly, capital formation is a positive function of real interest rate as opposed to modern classical model. They opined that this assertion is possible because higher rate of interest leads to a rise in saving deposits through the banks intermediary role thereby increasing the availability of investible funds, a situation McKinnon refers to as „conduit effect‟. The shortcoming inherent on the modern classical theory is applicable to this framework because it is different from itself. 2.2. Review of Empirical Studies for Nigeria Nkoro and Furo (2012) empirically investigated the relationship and dynamic interaction between foreign investment flows (aid, remittances, FDI, and foreign debt) and GDP growth in Nigeria for the period 1981-2010. Using some econometric technique like, co-integration, variance decomposition and impulse response function, they found that both co-integration and variance decomposition analyses support causation running both direction between capital inflow components and economic growth. Real GDP response to a standard deviation innovation of capital inflows appears sensitive, that is, the change appears very noticeable within the forecast period. ECM result however, reveals a significantly positive impact of foreign aid on real GDP. Other ECM results indicate the following on real GDP: negatively insignificant, positively significant, and negatively significant effect of remittances, FDI, and external debt on real GDP respectively. All, except the FDI take some time before their impacts are manifested. Herzer et al. (2006) using a two-variable VAR framework for the period 1980-2002, found positively FDI and economic growth relationship for Nigeria, Sri Lanka, Tunisia, and Egypt. Testing for causality relation, it was found that a long-run bi-directional causal relationship exists between FDI and GDP for all the countries examined, that is, causality running from FDI to GDP growth and vice versa. In examining whether FDI-growth relationship can be sustained in Nigeria for the period 1986-2006, Okodua (2009) employed the Johansen co-integration technique and a multivariable VAR framework within a VECM. Okodua found a long-run nexus between GDP growth and foreign direct investment inflow. Further analysis by the author showed causality running only from FDI to GDP growth – a one-way (unidirectional) causality. Ogbonna et al. (2012) evaluated the nexus between foreign direct investment and economic growth in Nigeria in the 1986 – 2010 period. Employing OLS technique and causation tests, the authors observed that although FDI coefficient in the regression result show that 13% of variations in GDP are accounted for by a percent increase in FDI, their relationship is statistically insignificant. The results of the causation test also reveal that causality runs both ways – from FDI to GDP and vice versa – a two-way causality, that is, each granger cause the other. They
  • 5. International Journal of World Policy and Development Studies, 2015, 1(1): 1-15 5 recommended that more sectors of the economy be deregulated so as to encourage and promote more investor participation in the productive sector of the economy. Ekeocha et al. (2012) examine the long run factors that determine of foreign portfolio investment (PFI) in Nigeria for the period 1981 – 2010 using quarterly data. Applying time series analysis specifically the finite distributed lag model on market capitalization, real exchange rate, real interest rate, real GDP and economic globalization variables, they find that FPI is positively related with market capitalization and globalization in Nigeria in the long run. They recommend and support the on-going efforts to sanitize the capital market as a way to attract portfolio investors and improve the country‟s market capitalization. Ukeje and Obiechina (2013) in their study on remittances – GDP growth relationship in Nigeria using an error correction ECM for the period 1970-2010 found that remittances impact significantly and positively on output growth in the long run. The duo equally reported that in the short run, previous values of remittances significantly and positively impact on economic growth. Equally, its coefficient is appropriately signed. Their study recommends that relevant and required infrastructural facilities be provided to attract more remittance inflows into Nigeria through appropriate and official channels while adopting measures to encourage the remittance receivers to utilize remittance receipts for productive investment or through domestic savings where investors will access them for investment purposes and hence output growth. Oduh and Urama (2012) investigated whether the end-use of remittances reduces poverty and finance growth in an import-dependent economy like Nigeria. Using macro-econometric framework with six behavioral functions and six identities and estimating and simulating the impact of remittance inflows on total expenditure in Nigeria, the simulation result reveals: first, the much praised poverty-reducing impact of remittance inflow does not finance growth for import-dependent economy as that of Nigeria. The authors blamed the results on the negative effect on the balance of payment even though it is positively linked to private consumption and investment. Ogbonna et al. (2014) sought to examine linkages between remittance inflows and private domestic investment in Nigeria over the period 1970-2012. Applying a time series data from 1970-2012 in an ECM framework, the result indicates that remittance inflow is insignificantly negative in promoting private domestic investment. The coefficient of the error correction term is significant and appropriately signed indicative that previous deviations away from equilibrium state adjust back to equilibrium overtime. Beneficial as foreign inflows may seem, some empirical results show a crowding-out effect on domestic capital formation. Saltz (1999) evaluated the impact of MNCs on domestic investment for low income economies off the world using VAR framework. The findings showed a crowding-out effect between the level of MNCs and domestic capital formation in 1970-1980 era. He explained that FDI is negatively related with domestic investment because most of the multi-national companies increase output and force local producers to shut down. Also, most multinational companies use imported capital and venture into areas hitherto controlled by government owned enterprises. 2.2.1. Trends in Domestic Private Investment and Capital Inflow Components in Nigeria for the Two Regime Periods (1986-1994; 1995-2012) The value of aggregate investment spending in Nigeria in the 1986-1994 (deregulation) period was ₦337.2 ($28.1) billion, but rose to ₦23,595 ($181.5) billion in the 1995-2012 (post-deregulation) period. As annual average, it was ₦37.5 ($3.1) billion and ₦1,310.8 ($10.1) in 1986-1994 and 1995-2012 periods respectively. Annual domestic investment spending was ₦13.3 ($3.3), ₦44 ($2.0), ₦335.6 ($3.3), and ₦3,405 ($21.4) billion in 1987, 1994, 2000, and 2012 respectively. As proportion of GDP, it was 15% in 1986, 11% in 1994, 7% in 2000, and 8% in 2012. The above trend is indicative that investment-friendly policies of the government during the deregulation and post-deregulation periods, such as investment and export promotion, privatization, as well as market determined economy, failed to elicit the required private sector-led investment spending necessary to grow the economy. Sectorally, however, the distribution of aggregate investment spending between public and private indicates that the private sector took advantage of the privatization policy to increase its share in total investment spending. For instance, while annual domestic public investment share in total investment was 67% in 1986-1994 era, it fell to 42% in 1995-2012 period. On its part, private investment share in total investment rose from 33% in 1986-1994 to 58% in 1995-2012 period. On annual basis, while public investment share in total investment showed a downward trend of 71%, 63%, 52%, and 42% in the period 1987, 1994, 2000, and 2010 respectively; that of private investment share in total investment trended upward in the same period to 29%, 37%, 48%, and 58% respectively. As proportion of GDP, private investment spending was however, not impressive as it recorded 4%, 4%, 3% and 8% in 1987, 1994, 2005, and 2010 respectively. FDI inflow into Nigeria was ₦432 ($485.58) million in 1985, but rose to ₦13,866.2 ($1,884.25) million in 1989, and peaked at ₦1,393,491.32 ($8,841.95) million in 2011. This impressive result was as a result of the divestment of Federal Government shares in the Shell Petroleum Development Company Nigeria Limited by three oil companies namely, Shell, Elf, and Agip, which resulted in new capital flows to take up the shares. The enthronement of democratic government in 1999 as well as the continued deregulation and privatization policies, especially in the communication, oil, and energy sectors further impacted positively to maintain the upward FDI inflow. As percent of GDP, FDI inflow was equally impressive as it moved from a low of 0.93% in 1986 to a high of 10.83% in 1994. However, the re-regulation of the economy end of 1994 resulted in sharp reduction in the FDI as
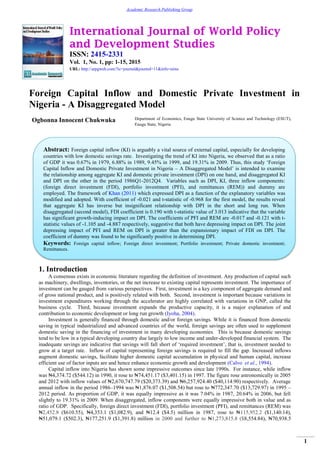
  • 6. International Journal of World Policy and Development Studies, 2015, 1(1): 1-15 6 proportion of GDP as it fell to a low of 3.78% in 1995, further to 2.46% in year 2000 before rising marginally to 2.64% and 2.70% in 2010 and 2012 respectively. Portfolio investment (PFI) inflow between 1986-1998 period was not impressive as negative figures were reported most of the years, except for 1986 and 1992. However, from 1999 PFI inflow recorded remarkable increases arising from the positive outcome of the sustained reform programmes, especially the banking sector consolidation and the high rate of returns on domestic debt instruments, among others. From a low of ₦151.6 ($86.63) million in 1986 and a negative figure of ₦1,618.8 ($219.95) million in 1989, it rose to ₦92,518.9 ($832) million in 2001, ₦360,291.6 ($1,769.19) million in 2006 and peaked at ₦556,585.1 ($2,571.07) million in 2011 arising from the equity participation in the initial public offers (IPOs) of deposit money banks of 2007. As percent of GDP, PFI was equally not impressive in the period 1986-1998. From a low of 0.42% in 1986 it nose-dived to a negative figure of 0.91% in 1989 and remained negative till end of 1998. In 1999, it rose to 0.03%, 0.20% in 2004, and 3.81% in 2012. Figure-1. graphs DPI, FDI, PFI, and REM as ratio of GDP for the period 1985-2012. Source: Plotted by the author based on the Data from World Development Indicators (WDI) 2012 and author‟s computation Figure 1: DPI, KI Components as percent of GDP 1985 - 2012 Remittance inflow (REM) into Nigeria was ₦75.51 ($10.) million in 1989, but rose to N177,251.90 ($1,391.80) million in 2000; N2,938,239.48 ($22,847.90) million in 2010 and ₦3,645,864.42 ($23,011.01) in 2012. As ratio of GDP, remittance inflow also displayed an impressive upward trend. For instance, with GDP ratio of 0.01% in 1986, it rose to 0.23% in 1991, 16.08% in 2006 but fail to 9.04% in 2012. The unabated growth in remittances is attributable as a direct consequence of the increasing number of Nigerians who travel abroad and the reduction in transaction costs of remitting. As aggregates, PFI, FDI and REM inflow in the period 1986-1994 was $3,514.87, $8,568 and $1,494 million respectively. Between 1995-2012, PFI, FDI, and REM inflow was $19,867.30, $66,967.61 and $160,292.42 million respectively. As ratio of GDP, PFI, FDI, and REM inflow in the period 1986-1994 stood at 1.65%, 4.01% and 0.70% respectively. However, between 1995-2012, the performance of inflow components as GDP ratio was rather mixed. While FDI and PFI inflow showed downward movements to 3.33% and 0.99% respectively, REM inflow maintained its impressive outlook rising to a high of 7.97%. 3. Theoretical Framework and Model Specification In modeling for domestic private investment, this research drew substantially from Blejer and Khan (1984) neo classical investment framework. Blejer and Khan in their literature outlined the challenges in using an exact neoclassical investment framework in developing economies. Our model which is in line with the empirical works of Khan (2011) is modified to take care of financial difficulties facing firms in Nigeria and other developing economies. It is modeled around a partial adjustment framework that describes investment as: Ct - Ct-1 = It = ãt(Cd t - Ct-1) ………………….. (2) Where: I = net investment, Cd = the desired (optimal) stock of capital, Ct-1 = existing stock of capital for the economy, t = time period, and ã = the adjustment coefficient that may change over time. Both Cd and ã are internally determined. Cd reflects the efficient use of capital stock, while ã results in optimal adjustment drive towards the desired level of capital stock. It is expected that ã vary systematically with macroeconomic, financial, technological, and system bottlenecks to meet up with planned level of capital formation. Equation (2) says that any variation in actual capital stock will react only partly to the difference between optimal C and previous values of C. Khan (2011) notes that rigidities in the financial system due to under developed financial markets exert effect on the series of actions towards a change in Cd , and increases the need for foreign capital inflow to improve investment in developing countries. According to Stordel (1990), the major bottleneck to investment in developing economies is the volume of financial resources, not their costs. We assume that the rate of adjustment is constrained not only by the cost of borrowing (INT), but also by the quantity of foreign capital inflow to the country. However, to capture the two objectives of the study, aggregate capital inflow (KI) and capital inflow components (foreign direct -2 0 2 4 6 8 10 12 14 1985 1987 1990 1994 1996 2000 2005 2012 DPI FDI PFI REM
  • 7. International Journal of World Policy and Development Studies, 2015, 1(1): 1-15 7 investment (FDI), portfolio investment (PFI), and remittances (REM)) are entered in the model separately. Hence, the adjustment coefficient is given as: ãt = f(INTt, KIt, FDIt, PFIt, REMt) ……………….. (3) Investment demand function is negatively interest elastic because a higher market rate of interest (INT) increases the cost of capital, crowds out return on investment and hence a fall in investment. Thus, ceteris paribus, a rise in the market rate of interest would lead to a fall in investment while a fall in interest rate would result in an increase in investment. Foreign Direct Investment (FDI) is expected to impact on domestic private investment through the spread of best practices, transfer of technology and sub-contracting to local firms. But increased FDI can also harm domestic investment as local firms cannot compete with huge multinational corporations and are forced to close down (Khan, 2011). It is therefore difficult to predict a priori the sign of the effect of FDI on the coefficient of adjustment, and consequently on domestic private investment. Portfolio flows are expected to impact positively on domestic investment as flows are expected to promote improvements and expansion of financial markets. But portfolio flows and particularly short-term flows that are driven by speculative considerations are often subject to reversals at the first sign of trouble, and consequently might not influence domestic investment (Loungani, 2003). Adams and Page (2005) argue that remittance inflow positively and significantly affect current account balance and economic growth through its direct implications for savings, human capital development, and, indirectly on consumption. Ratha (2003) adds that for rural households, remittances raise their consumption level, and this may induce higher multiplier effect because they are more likely to be spent on home made goods. Hence, remittances are expected to positively impact on domestic investment. Government investment (GI) is important and can complement domestic private investment, but the manner and source of financing is equally important. Public capital expenditure undertaken to boost infrastructure like transport, communication, education, energy, and irrigation has the potential to complement or crowd in private sector investment as such projects tend to reduce the cost of production and increase the profitability of private capital. However, as argued by Aschauer (1989), public investment that involves large fiscal deficits that result in high interest rate, credit rationing, or a higher current and future tax burden will negatively impact on domestic private investment. The role of public investment in influencing domestic private investment is therefore not in doubt. The coefficient of adjustment becomes: ãt = f(INTt, KIt, FDIt, PFIt, REMt, GIt) ……………….. (4) Exchange rate is expected to affect the coefficient of adjustment since most developing countries depend on imported capital inputs for production. However, the theoretical postulation is ambiguous about the direction of the effect of exchange rate (EXR) on the rate of investment. While a real depreciation raises the cost of imported capital inputs, and because a large chunk of investment goods in developing countries (Nigeria inclusive) is imported, domestic private investment would be expected to fall on account of significant depreciation. On the other hand, a significant depreciation by raising the profitability in the tradable goods sector would be expected to stimulate private investment in the export sector, but depresses investment in the non tradable goods sector (Ezike and Ogege, 2012). The coefficient of adjustment is now: ãt = f(INTt, KIt, FDIt, PFIt, REMt, GIt EXRt) ……………….. (5) Following the accelerator principle which assumes the proportionality of expected capital to required output at any given period (GDPgt): Cd t = f(GDPgt) …………………….. (6) An expected higher output requires additional inputs which will generate a higher desired capital stock. Merging equations 2, 5, 6 and adding previous quarter domestic private investment (DPIt-1) gives the domestic private investment (DPI) model that will be estimated, thus: DPI = f(DPIt-1, INTt, KIt, FDIt, PFIt, REMt, GIt, EXRt, GDPgt) ………………… (7) The study covers two regime periods – deregulation era (1986-1994), and post-deregulation era (1995-2012). We introduce dummy (DUM) variable that has values of zero (0) for deregulation, and one (1) for post-regulation. The magnitude of the coefficient of the DUM variable in the model is used to evaluate the extent of the difference in the capital inflow components in stimulating domestic private investment in these periods. The test applies only to objective two – capital inflow components-domestic private investment nexus. Our model becomes: DPI = f(DPIt-1, KIt, FDIt, PFIt, REMt, INTt, GIt, EXRt, GDPgt, DUM) ………………… (8) To standardize the data and enable us interpret as percentages, we transform the variables in their log linear forms and present as econometric model thus: lnDPIt = bo + b1lnDPIt-1 + b2[(lnKIt)] + b3[(lnFDIt) + b4(lnPFIt) + b5(lnREMt)] + b6lnGIt + b7INTt + b8GDPgt + b9lnEXRt + b10DUM + µt ………………….………… (9) ln shows that the variables are in their log linear form; while t denotes time (1986Q1 – 2012Q4) While aggregate capital inflow (KI) represents the explanatory variable of interest for objective one, capital inflow components (FDI, PFI, and REM) are the variables of interest for objective two. The variables – [(KI) and (FDI, PFI, REM)] – in equation (9) enter the model each at a time and are estimated as such. Equation (10) is the generalized specification framework of error correction (ECM) model to allow for inclusion of long-run information.
  • 8. International Journal of World Policy and Development Studies, 2015, 1(1): 1-15 8 ln∆DPIt = ao + a1ln∆DPIt-1 + a2[(lnKIt)] + a3[(ln∆FDIt + a4ln∆PFIt + a5ln∆REMt)] + a6ln∆GIt + a7∆INTt +a8∆GDPgt + a9∆ln∆EXRt + a10DUMt + λECMt-1 µt …………..……… (10) ∆ is the first difference operator, a1- a11 are the parameters of the model to be estimated, and λ is the error correction coefficient, while the rest are as earlier defined. 3.1. Estimation Issues An important assumption of ordinary least squares (OLS) is the existence of zero correlation between the error term and any explanatory variable. Any violation of this makes the explanatory variable endogenous and OLS estimates inconsistent. To test for possible endogeneity problem, we employ Granger (1986) causality test. Granger (1986) causality method of investigating whether X is the cause of Y is to determine how much of current Y is explained by past values of itself and then to see if by including previous values of X, we can better the explain Y. Y is then granger-caused by variable X if X assists predict Y, or if the values obtained from the lagged X‟s have statistical significant (EViews 3.1 User‟s Guide, 1999). The idea behind the test of causality should be understood; if X causes Y, then changes in X should come before that in Y (Pindyck and Rubinfeld, 1991). This characteristic makes causality test an important one in the test of endogeneity. When you regress non-stationary variables on each other, you might have a nonsense or spurious result indicating a statistical significant relationship between the variables, when this may just be evidence of contemporaneous correlation. To ascertain the quality of the variables in our model, we test for the order of integration of each time series using the Augmented Dickey-Fuller (ADF) and Philips-Perron (PP) unit root tests. The two approaches are apt because, while the ADF model accounts for the autocorrelation of the first differences of the series in a parametric way by guessing the value of additional nuisance parameters, the Phillip-Perron makes use of non-parametric statistical methods to correct for the serial correlation of the disturbances while avoiding lagged difference terms (Gujarati and Porter, 2009). Stationarity achieved, we test for the exact numbers of co-integrating equations among the variables – whether or not there exist long run co-integrating nexus among them. We undertook co-integration tests as given by Johansen and Juselius (1990) maximum likelihood function. In these tests, both the Trace and Maximum Eigen- value statistics are compared with their critical values to ascertain number of co-integration equations. 3.2. Data Sources Majorly, data source for the estimation of equations and analysis of this study covering the period of 108 quarters are from World Development Indicators (WDI) (2012). They include, gross fixed capital formation (both private and public), aggregate capital inflow (sum of three components: foreign direct investment, foreign portfolio investment, workers‟ remittances), each of the capital inflow components, and GDP growth rate. Data on interest and exchange rates are from CBN Statistical Bulletin (various years). However, data on domestic sectoral investment as percent of total investment are used to compute data on private and public gross fixed capital formation. Quarterly data generated from annual data 1986 to 2012 using e-views version 6 software are used for the study. The choice was informed by data availability and the dramatic increase in inflow components following the deregulation which started in 1986. 4. Empirical Results 4.1. Presentation of Some Preliminary Tests: Unit Root and Co-integration We utilized the Augmented Dickey-Fuller (ADF) and Philips Perron (PP) for the unit root tests. Both results show that all the variables are integrated of order one I(I). Afterwards, we undertook co-integration tests based on the Johansen and Juselius (1990) maximum likelihood framework using both the Trace and Maximum Eigen-value statistics. Our results provide evidence that there are two co-integration equations each for Trace and Maximum eigenvalue for the two models. Hence, we conclude that there exists a long run equilibrium relationship among the variables. Results of these tests are not displayed for want of space. We carried out the Granger causality test to ascertain whether domestic private investment (DPI) has any causal relationship with capital inflow components in Nigeria. The results of the pairwise Granger causality test revealed that DPI does not Granger cause foreign direct investment (FDI) and workers‟ remittances (REM), while it does Granger cause portfolio investment (PFI). On the other hand, FDI and REM do Granger cause DPI, but PFI variable does not Granger causes DPI. Hence, the causality relationship between DPI and capital inflow components is unidirectional in nature with FDI and REM causing DPI, and DPI causing PFI. The maximum lag length for all the results was 3. 4.2. Empirical Results and Discussion According to Giles (2013), if time series variables have integration of the same order (example, 1(1)), and they are co-integrated, two types of models are estimated – an OLS regression model using levels of data, and an ECM estimate using OLS. From our unit root tests, all the series have the same order of integration, that is, 1(1), and they are co-integrated. Hence, we estimate two different models. The first is an OLS regression using levels of data (equation 9) to provide the long-run equilibrium relationship. This equation gave us two sets of results referred to as models (1a) and (1b). The second, an error correction model using different data (equation 10) that provided the
  • 9. International Journal of World Policy and Development Studies, 2015, 1(1): 1-15 9 short-run dynamics of the relationship between the variables. This equally gave two sets of results called models (2a) and (2b). 4.2.1 Model 1a: Long Run Impact Analysis of Aggregate KI-DPI (Using Levels of Data) The result showed that the coefficient of one quarter lag of the dependent variable (DPI) itself is significantly positive even at 1% level while aggregate capital inflow (KI) variable is negative and insignificant in explaining variations in domestic private investment in Nigeria in the long run. 4.2.2. Model 1b: Long Run Impact Analysis of KI Components-DPI (Using Levels of Data) The coefficients of the inflow types displayed mixed signs and sizes, indicative of their varied individual impacts on the growth process of domestic private investment in Nigeria. Specifically, while a 1% increase in FDI during the analysis period significantly increased DPI by about 9% in the long run, an equivalent increase also in PFI and REM significantly depressed DPI by 3% each in the long run. On its part, the coefficient of one quarter lag of the dependent variable (DPI) itself is significantly positive even at 1% level in determining the current outcome of itself. 4.2.3. Model 2a: Short Run Impact Analysis of Aggregate KI-DPI (Using Differenced Data) In order to support the long-run estimates of model (1a), we present table 2a to see the short-run dynamics of the error correction model. Consistent with the long run results in table 1a, aggregate capital inflow (KI) coefficient is negative and insignificant even at 10% level. Specifically, a 1% increase in aggregate KI in a quarter will insignificantly depress DPI by 2% in the short run. This implies that aggregate capital inflow (KI) contribution to domestic private investment in Nigeria has been negative, but insignificant both in the short and long run. This is in tandem with the findings of Saltz (1999) that capital inflow crowed out domestic investment in developing countries, but inconsistent with the findings of Elitza (2008). Elitza found that aggregate capital inflow raise domestic investment in transition economies of former Soviet Union. The error correction term (ecmt-1) is less than one, negative and statistically significant, thus corroborating the results of the co-integration tests of the existence of a stable long run equilibrium relationship among the variables. Specifically, the ecmt-1 is -0.30, indicative that 30% of previous quarter‟s disequilibrium (shock) from long run anchor will be restored within a quarter. DW value of 1.84 is close to 2 and is indicative of the absence of autocorrelation problem, hence the model is reliable. However, that aggregate capital inflow coefficient is negative and insignificant may require further investigation. This is because the type of inflow into an economy is important. Available literature suggests that the magnitude and direction of impact depend on the type of inflow. Dis-aggregating capital inflow into components and estimating their individual impacts on DPI is therefore crucial. This was done (using differenced data) and reported as model 2b presented in table 2b. 4.2.4. Model 2b: Short Run Impact Analysis of KI Components-DPI (Using Differenced Data) To examine the relative impacts of capital inflow components on the growth of DPI, the short-run results presented in table 2b are also consistent with and support our long-run results. The coefficients of FDI, PFI, and REM are 0.19, -0.02, and -0.12 respectively, while their respective t-statistic is 3.01, -1.11, and -4.89. Specifically, the results show that in the short run, a 1% increase in FDI significantly increases DPI by 19%, while a 1% increase each in PFI and REM inflow will depress DPI by 02% and 12% respectively. This finding reveals that first, as aggregate, the impact of KI on DPI in Nigeria is negative. Second, when disaggregated into components, the relative and direction of impact of each component vary. Third, as aggregate, the joint contractionary impact of PFI and REM on DPI is more than the expansionary impact of FDI. This finding is not as surprising as it is interesting. First, it supports our long-run results reported in table 1b. Second, the unconducive macroeconomic environment prevalent during the period of policy reversals, shifts and antithetical policy measures of the late 80s, mid 90s and during the 2007-2009 global economic crises might have resulted in the risk averse private investors to predict the future, and hence preferred to reverse the reversible investment. Hence, the reversible and volatile nature of PFI as noted by Hecht et al. (2004) manifested evidently going by its negative coefficient during the study period. Third, FDI inflow is remarkably stable and more permanent, even during economic crises as evidenced by its positive coefficient. The positive impact of FDI on DPI as revealed in the results is consistent with the two-gap theoretical thesis that foreign capital inflow permits the developing countries to invest more than they can save domestically. It is also in tandem with Ayanwale (2007) who noted that FDI inflow into Nigeria (being mainly in the petroleum sector) turn in substantial profits after adjusting for risk, so that foreign investors could not be discouraged by policy inconsistencies and shifts. Other results consistent with our findings are: Hecht et al. (2004) result was for 64 developing countries; Herzer et al. (2006) result was on Nigeria, Sri Lanka, Tunisia, and Egypt; Okodua (2009), and Ogbonna et al. (2012), studies are for Nigeria. This suggests the need to sustain all pro-FDI policies to further attract massive inflow of foreign capital (especially FDI), while the current efforts to improve the security situation remains imperative.
  • 10. International Journal of World Policy and Development Studies, 2015, 1(1): 1-15 10 The negative and significant impact of REM coefficient is in tandem with results of the earlier works done by Oduh and Urama (2012); Akinpelu et al. (2013); and Ogbonna et al. (2014) for Nigeria; but inconsistent with the findings of Ukeje and Obiechina (2013) also for Nigeria. The depressing effect of PFI coefficient is consistent with most of the previous studies, for instance, the study by Rachdi and Saidi (2011), Durham (2003), and Aitken and Harrison (1999), but inconsistent with findings of Knill (2005), Errunza (2005), and Ekeocha et al. (2012). Results of the control variables are largely consistent with a priori expectations. Specifically, 1% increase in government investment significantly grows DPI by 6%. This is in tandem with theoretical postulation of Khan and Amia (2003) that public investment (in infrastructure – transport, communication, energy, irrigation, etc.) complement or crowd in private sector investment as such tend to reduce the cost of production and raise the rate of return on private capital. However, the result is inconsistent with the findings of Oyejide and Raheem (1993), who found that most public investment in Nigeria were doubtful in utility and viability and constituted a dead-weight loss in terms of net benefits to the economy. Despite this, however, the significance of public investment in Nigeria should not be toyed with or discounted, at least contemporaneously as evidence from this study is indicative that the sustenance of a high level of private investment and real GDP hinges on government investment. On its part, output growth (GDPg) dynamics, that is, „acceleration of output‟, are crucial and significant in the determination of domestic private investment growth in Nigeria. Precisely, a percent positive change in output growth (GDPg) will significantly increase DPI by 003%. Thus, this finding corroborates the theoretical postulations by Koyck (1954) and Iyoha (2004) that firms will expand their output only if there is increase in the growth rate of output – an acceleration of output growth. The coefficient of interest rate (INT) is in tandem with the theoretical postulations. A 1% increase in prime interest rate will depress DPI by 002%, while the coefficient of EXR is both positive and significant in determining growth process of DPI. The dummy (DUM) variable which entered into the model to account for policy (regime) changes has a coefficient of -0.04 and t-statistic value of -2.25. These results reveal that the era of deregulation and post- deregulation periods as provided for in our model, significantly and negatively determined DPI behavior in Nigeria even at 1% level. The negative co-efficient of DUM variable is largely consistent with our expectations. The prevailing un-conducive macroeconomic environment during most of the analysis period, derived from policy inconsistencies and shifts, largely informed our expectations. Hence, the robust but negative DUM coefficient has further corroborated and reinforced the findings of Anyanwu (1998), but at variance with that of Ayanwale (2007). The error correction model (ecmt-1) which measures the adjustment speed has a coefficient of –0.28 indicative of feedback effect of approximately 28%. If DPI is in disequilibrium as a result of contemporaneous dynamic shock, it will take a speed of approximately 28% within a quarter to adjust back to long-run equilibrium. The adjusted R2 is 0.73 indicative that the explanatory variables explained about 73% of the variations in DPI. The DW statistic value is 2.07 indicative of the absence of serial correlation. The F-statistic value of 18.10 is significantly satisfactory and shows that all the variables jointly explained changes in DPI in Nigeria. 5. Conclusion The question of whether capital inflow components improve domestic private investment in Nigeria has been explored in this study. The application of OLS econometric technique in an ECM framework has proved quite intuitive and acceptable. The empirical investigation sheds new light on the domestic private investment-capital inflow relationship that would prove useful in the design of macroeconomic policies in Nigeria, and also provide the platform on which the policies can be measured. The study covered the period 1986Q1 to 2012Q4 and examined two vital aspects of the research objective. These are capital inflow-domestic private investment nexus and capital inflow components-domestic private investment nexus. Overall, the goal was to determine the existence of any unique link between capital inflow and the above indicators of domestic private investment. The empirical results clearly emphasize the role of foreign capital inflow in the growth process of the economy of Nigeria through its impact on domestic private investment. On aggregate, capital inflow coefficient was negative and insignificant. However, when disaggregated, PFI and REM components were strikingly found to have depressing effect on domestic private investment as against the expansionary impact of FDI. Hence, by decomposing capital inflow, the study has highlighted that FDI inflow component is more sustainable and more growth-inducing as far as domestic private investment is concerned. Having found FDI component the only contributor to DPI in Nigeria, policies to further attract massive inflow of foreign capital (especially FDI) is imperative. References Adams, R. H. and Page, J. (2005). International Migration, remittances and poverty in developing countries. World Bank: World Development, 33(10): 1645-69. Aitken, B. J. and Harrison, A. E. (1999). Do domestic firms benefits from direct foreign investment? . American Economic Review, 89(3): 605-18. Akinpelu, Y. A., Ogunbi, O. J., Bada, O. T.and Omojola, O. S. (2013). Effects of remittance inflows on economic growth of Nigeria. Developing Countries Studies, 3(3): 113-22.
  • 11. International Journal of World Policy and Development Studies, 2015, 1(1): 1-15 11 Anyanwu, J. C. (1998). An econometric investigation of the determinants of foreign investment in Nigeria, Rekindling investment for economic development in Nigeria by Nigerian Economic Society. Ibadan: 219- 241. Aschauer (1989). Does public capaital crowd out private capital? Federal Reserve Bank of Chicago staff memoranda Ayanwale, A. B. (2007). FDI and economic growth: Evidence from Nigeria. AERC Research Paper 165, African Economic Research Consortium, Nairobi. Blejer, M. and Khan, M. (1984). Government Policy and private investment in developing countries. IMF Staff Papers, 31(1): 379-403. Bos, H. C., Sanders, M.and Secchi, C. (1974). Private foreign investment in developing countries: A quantitative study on the macroeconomic effects. Reidel: Dardrecht. Calvo, G. A., Leiderman, L.and Reinhart, C. M. (1994). Capital inflows and real exchange rate appreciation in Latin America: the role of external factors. IMF Working Paper, 92/62. Chirinko, R. S. (1993). Business fixed investment spending: modeling strategy, empirical results, and policy implications. Journal of Econometric Literature, 31(4): 1875-911. Durham, J. B. (2003). Foreign portfolio investment, foreign bank lending and economic growth. International Finance Discussion Paper No. 757. Ekeocha, P. C., Ekeocha, C. S., Malaolu, V.and Oduh, M. O. (2012). Modelling the long run determinants of foreign portfolio investment in Nigeria. Journal of Economics and Sustainable Development, 3(8): 194-202. Elitza, M. (2008). The impact of capital flows on domestic investment in transition economies, European Central Bank Working Paper Series 871. Errunza, V. (2005). Conditional heteroskedasticity and global stock return distributions. The Financial Review, 29(3): 293–317. EViews 3.1 User‟s Guide (1999). Irvine, CA: Quantitative Micro Software, LLC. 3th edn. Ezike, J. E. and Ogege, S. (2012). Nigeria foreign trade policy: Its impact on the on-oil exports. Journal of Economics and International Finance, 4(8): 192-200. Giles, D. (2013). Econometrics Beat: ARDL Models – Part II – Bounds Tests. http://davegiles.blogspot.ca/2013/ardl-models-part-ii-bounds-tests.html Granger, C. W. J. (1986). Developments in the study of cointegrated economic variables. Oxford Bulletin of Economics and Statistics, 48(3): 213-28. Gujarati, D. N. and Porter, D. C. (2009). Basic econometrics. International Edition, McGraw Hill Education (Asian). Hecht, Y., Razin, A.and Shinar, N. G. (2004). Interactions between capital inflows and domestic investment: Isreal and developing economies. Israel Economic Review, 2(2): 1-14. Herzer, D., Klasen, S.and Nowak-Lehmann, D. F. (2006). In search of FDI-led growth in developing countries: the way forward. Iber Americana Institute for Economic Research. Iyoha, M. A. (2004). Applied econometrics. 2nd edn: Mindex Publishing: Benin City. Johansen, S. and Juselius, K. (1990). Maximum likelihood estimation and inference on co-integration with application to demand for money. Oxford Bulletin of Economics and Statistics, 52(2): 169-210. Keynes, J. M. (1936). The general theory of employment, interest and money. Macmillan Press: New York. Khan, A. S. (2011). Volatility of Resource Inflows and Domestic Investment in Cameroon. African Economic Research Consortium (AERC) Biannual Research Workshop, Nairobi, Kenya. Khan, A. S. and Amia, G. (2003). Volatility of resource inflows and domestic investment in cameroun. Work-in- Progress for Presentation at the African Economic Research Consortium (AERC) Biannual Research Workshop at Nairobi, Kenya. Knill, A. M. (2005). Can foreign portfolio investment bridge the small firm financing gap around the world? World Bank Policy Research Working Paper 3796, The World Bank Group, Washington, DC 20433. Koyck, L. M. (1954). Distributed lags and investment analysis. North-Holland Publishing Company: Amsterdam. Loungani, P. (2003). The role of information in driving determinants of foreign direct investment: Theory and evidence, paper presented in the Northern American Winter Meeting of the Econometric Society. McKinnon, R. I. (1964). Foreign exchange constraints in economic development. Economic Journal, 74(294): 388- 409. McKinnon, R. I. (1973). Money and capital in economic development. The Brookings Institute: Washington DC. Nkoro, E. and Furo, A. O. (2012). Foreign capital inflows and economic growth in nigeria: an empirical approach. Academic Journal of Interdisciplinary Studies, MCSER-CEMAS-Sapienza University of Rome. Oduh, M. O. and Urama, N. E. (2012). Does the end use of remittance matter? a macro simulation of the Nigerian economy. Developing Country Studies, 2(10): 48-59. Ogbonna, I. C., Agu, S.and Chijioke, G. (2014). Do remittances promote investment in developing countries? an inquiry into „remittance-domestic private investment‟ relationship in Nigeria. Renaissance University Journal of Management and Social Sciences (RUJMASS), 1(1): 40-51. Ogbonna, I. C., Uwajumogu, N. R., Nwokoye, E.and Nzeribe, G. (2012). Economic growth and foreign direct investment in Nigeria: an empirical investigation. Journal of Economics and Sustainable Development, 3(13): 34-41. Okodua, H. (2009). Foreign direct investment and economic growth: co-integration and causality analysis of Nigeria. The African Finance Journal II, Part I, II, Part I: 54-73.
  • 12. International Journal of World Policy and Development Studies, 2015, 1(1): 1-15 12 Oyejide, T. A. and Raheem, M. I. (1993). Nigeria in Taylor (ed.) The Rocky Road to Reform, Washington DC: United Nations Press. Papanek, G. F. (1960). Framing a development program. Carnegie Endowment for International Peace: New York. Pindyck, R. and Rubinfeld, D. (1991). Econometric models and economic forecasts. McGraw-Hill: Prebisch, R. (1968). Development problems of the peripheral countries and the terms of trade, in: James D. Theberge, ed. Economics of Trade and Development. John Wiley and Sons Inc: New York. Rachdi, H. and Saidi, H. (2011). The impact of foreign direct investment and portfolio investment on economic growth in developing and developed economies. Interdisciplinary Journal of Research in Business, I(6): 10-17. Ratha, D. (2003). Workers‟ remittances: an important and stable source of external development finance. Global Development Finance, Washington, DC: The World Bank: 157-72. Saltz, I. (1999). The Negative Correlation between foreign direct investment and economic growth in the third world: theory and evidence. Rivista Internazionale di Scienze Economiche e Commerciali, 39(7): 617-33. Shaw, E. S. (1973). Financial deepening in economic development. Oxford University Press: New York. Singer, H. W. (1950). The distribution of gains between investing and borrowing countries. American Economic Review, 40(2): 473-85. Stordel, H. (1990). Export income risk and determinants of capital formation in developing countries. Review of World Economics, 126(2): 346-68. Ukeje, E. U. and Obiechina, M. E. (2013). Workers‟ remittances-economic growth nexus: evidence from Nigeria, using an error correction methodology. International journal of Humanities and Social Sciences, 3(7): 212- 27. World Development Indicators (WDI) (2012). data.worldbank.org/sites/default/files/wdi-2012-ebook.pdf
  • 13. International Journal of World Policy and Development Studies, 2015, 1(1): 1-15 13 Appendix I Model Estimation Results (Using Levels of Data) Table-1a. Model 1a – Aggregate KI-DPI Nexus Dependent Variable: INDPI Method: Least Squares Date: 12/29/14 Time: 16:50 Sample (adjusted): 1986Q1 2012Q4 Included observations: 83 after adjustments Variable Coefficient Std. Error t-Statistic Prob. C 0.454988 0.154728 2.940562 0.0038 INDPI(-1) 0.906409 0.020391 44.45067 0.0000 INKI -0.003416 0.015128 -0.225781 0.8217 INEXR 0.105230 0.022331 4.712329 0.0000 INGI 0.039143 0.019163 2.042658 0.0428 INT -0.008429 0.002275 -3.704602 0.0003 GDPG -0.001400 0.001264 -1.107808 0.2697 R-squared 0.984816 Mean dependent var 10.01026 Adjusted R-squared 0.963762 S.D. dependent var 2.708408 S.E. of regression 0.095293 Akaike info criterion -1.815877 Sum squared resid 1.407530 Schwarz criterion -1.664037 Log likelihood 155.9940 Hannan-Quinn criter. -1.754231 F-statistic 18672.59 Durbin-Watson stat 0.607116 Prob(F-statistic) 0.000000 Table-1b. Model 1b – KI components-DPI Nexus Dependent Variable: INDPI Method: Least Squares Date: 12/29/14 Time: 17:02 Sample (adjusted): 1986Q1 2012Q4 Included observations: 83 after adjustments Variable Coefficient Std. Error t-Statistic Prob. C 0.117046 0.271024 0.431864 0.6673 INDPI(-1) 0.904397 0.027720 32.62602 0.0000 INFDI 0.093506 0.030624 3.053316 0.0033 INPFI -0.030398 0.007427 -4.093202 0.0001 INREM -0.034383 0.011987 -2.868269 0.0056 INEXR 0.095369 0.027145 3.513317 0.0008 INT -0.004001 0.001910 -2.094719 0.0402 GDPG -0.006455 0.001157 -5.580139 0.0000 INGI 0.065441 0.021581 3.032348 0.0035 DUM -0.389528 0.103812 -3.752244 0.0004 R-squared 0.991481 Mean dependent var 12.23153 Adjusted R-squared 0.978407 S.D. dependent var 2.221474 S.E. of regression 0.054113 Akaike info criterion -2.868827 Sum squared resid 0.184479 Schwarz criterion -2.555066 Log likelihood 114.7122 Hannan-Quinn criter. -2.743788 F-statistic 13475.34 Durbin-Watson stat 0.978208 Prob(F-statistic) 0.000000
  • 14. International Journal of World Policy and Development Studies, 2015, 1(1): 1-15 14 Models Estimation Results (Using Differenced Data) Model-2a. Aggregate KI-DPI nexus Dependent Variable: D(INDPI) Method: Least Squares Date: 12/29/14 Time: 17:40 Sample (adjusted): 1986Q1 2012Q4 Included observations: 83 after adjustments Variable Coefficient Std. Error t-Statistic Prob. C 0.003048 0.005190 0.587160 0.5580 Continue D(INDPI(-1)) 0.668423 0.045899 14.56279 0.0000 D(INKI) -0.021024 0.021712 -0.968332 0.3344 D(INGI) 0.057011 0.027826 2.048818 0.0422 D(INEXR) 0.301654 0.033556 8.989671 0.0000 D(INT) -0.001973 0.004259 -0.463294 0.6438 D(GDPG) 0.000219 0.001943 0.112600 0.9105 ECM(-1) -0. 300945 0.013356 -2.316979 0.0218 R-squared 0.728878 Mean dependent var 0.048955 Adjusted R-squared 0.716473 S.D. dependent var 0.109450 S.E. of regression 0.058279 Akaike info criterion -2.798729 Sum squared resid 0.519660 Schwarz criterion -2.645616 Log likelihood 233.2977 Hannan-Quinn criter. -2.736559 F-statistic 58.76015 Durbin-Watson stat 1.839112 Prob(F-statistic) 0.000000 Model-2b. KI Components-DPI nexus Dependent Variable: D(INDPI) Method: Least Squares Date: 12/29/14 Time: 18:10 Sample (adjusted): 1986Q1 2012Q4 Included observations: 83 after adjustments Variable Coefficient Std. Error t-Statistic Prob. C -0.056572 0.032778 -1.725920 0.0897 D(INDPI(-1)) 0.607320 0.066444 9.140346 0.0000 D(INFDI) 0.189851 0.063006 3.013229 0.0038 D(INPFI) -0.016922 0.015310 -1.105274 0.2736 D(INREM) -0.120993 0.024759 -4.886728 0.0000 D(INGI) 0.075221 0.023306 3.227584 0.0021 D(INEXR) 0.179206 0.075413 2.376343 0.0208 D(INT) -0.001516 0.001866 -0.812794 0.4197 D(GDPG) 0.021249 0.002813 1.844003 0.0447 DUM -0.037870 0.016853 -2.247059 0.0285 ECM(-1) -0. 280250 0. 076937 -1.967894 0.0357 R-squared 0.774398 Mean dependent var 0.063990 Adjusted R-squared 0.731611 S.D. dependent var 0.078382 S.E. of regression 0.040607 Akaike info criterion -3.414953 Sum squared resid 0.095637 Schwarz criterion -3.029496 Log likelihood 131.5233 Hannan-Quinn criter. -3.261845 F-statistic 18.09906 Durbin-Watson stat 2.074244 Prob(F-statistic) 0.000000
  • 15. International Journal of World Policy and Development Studies, 2015, 1(1): 1-15 15 Appendix II Granger Causality Test Table-3. Pairwise Granger Causality Test Results in the KI Components-DPI Causal Relationship (Models (33) Sample: 1986Q1 2012Q4 No of Lags: 3 Null Hypothesis: Obs F-Statistic Prob. INFDI does not Granger Cause INDPI 158 3.56144 0.0158 INDPI does not Granger Cause INFDI 0.48066 0.6962 INPFI does not Granger Cause INDPI 64 0.13955 0.9359 INDPI does not Granger Cause INPFI 10.0278 2.E-05 INREM does not Granger Cause INDPI 166 2.13422 0.0980 INDPI does not Granger Cause INREM 0.78964 0.5013