3 2019 oladele poster for iarsaf
•
0 likes•105 views

Ololade projects
Recommended

Recommended
More Related Content
Similar to 3 2019 oladele poster for iarsaf
Similar to 3 2019 oladele poster for iarsaf (20)
More from International Institute of Tropical Agriculture
More from International Institute of Tropical Agriculture (20)
Recently uploaded
Recently uploaded (20)
3 2019 oladele poster for iarsaf
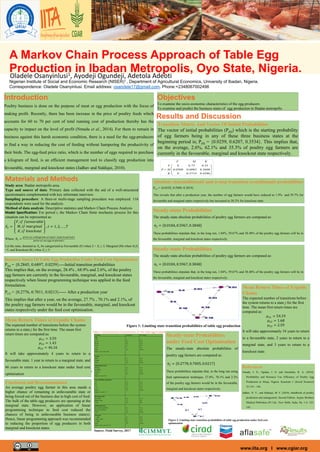
- 1. www.iita.org I www.cgiar.org A Markov Chain Process Approach of Table Egg Production in Ibadan Metropolis, Oyo State, Nigeria. Oladele Osanyinlusi1, Ayodeji Ogundeji, Adetola Adeoti Nigerian Institute of Social and Economic Research (NISER)1 , Department of Agricultural Economics, University of Ibadan, Nigeria. Correspondence: Oladele Osanyinlusi. Email address: osandele17@gmail.com. Phone:+2348067002496 Introduction Poultry business is done on the purpose of meat or egg production with the focus of making profit. Recently, there has been increase in the price of poultry feeds which accounts for 60 to 70 per cent of total running cost of production thereby has the capacity to impact on the level of profit (Nmadu et al., 2014). For them to remain in business against this harsh economic condition, there is a need for the egg-producers to find a way in reducing the cost of feeding without hampering the productivity of their birds. The egg-feed price ratio, which is the number of eggs required to purchase a kilogram of feed, is an efficient management tool to classify egg production into favourable, marginal and knockout states (Jadhav and Siddiqui, 2010). Materials and Methods Study area: Ibadan metropolis area. Type and source of data: Primary data collected with the aid of a well-structured questionnaire complemented with key informant interview. Sampling procedure: A three-or multi-stage sampling procedure was employed. 116 respondents were used for the analysis. Method of data analysis: Descriptive statistics and Markov Chain Process Analysis Model Specification: For period t, the Markov Chain finite stochastic process for this situation can be represented as: 𝑋𝑋𝑡𝑡 = 𝐹𝐹, 𝑖𝑖𝑖𝑖 𝑓𝑓𝑓𝑓𝑓𝑓𝑓𝑓𝑓𝑓𝑓𝑓𝑓𝑓𝑓𝑓𝑓𝑓𝑓𝑓 𝑀𝑀, 𝑖𝑖𝑖𝑖 𝑚𝑚𝑚𝑚𝑚𝑚𝑚𝑚𝑚𝑚𝑚𝑚𝑚𝑚𝑚𝑚 𝐾𝐾, 𝑖𝑖𝑖𝑖 𝑘𝑘𝑘𝑘𝑘𝑘𝑘𝑘𝑘𝑘𝑘𝑘𝑘𝑘𝑘𝑘 , 𝑡𝑡 = 1, 2, … , 𝑇𝑇 Where: 𝑋𝑋𝑡𝑡 = 𝑝𝑝𝑝𝑝𝑝𝑝𝑝𝑝𝑝𝑝 𝑜𝑜𝑜𝑜 𝑎𝑎 𝑘𝑘𝑘𝑘𝑘𝑘𝑘𝑘 𝑘𝑘𝑘𝑘𝑘𝑘𝑘𝑘 𝑜𝑜𝑜𝑜 𝑙𝑙𝑙𝑙𝑙𝑙𝑙𝑙𝑙𝑙 𝑓𝑓𝑓𝑓𝑓𝑓𝑓𝑓 𝑖𝑖 𝑖𝑖 𝑝𝑝𝑝𝑝𝑝𝑝𝑝𝑝 𝑝𝑝𝑝𝑝 𝑡𝑡 𝑝𝑝𝑝𝑝𝑝𝑝𝑝𝑝𝑝𝑝 𝑜𝑜𝑜𝑜 𝑎𝑎𝑎𝑎 𝑒𝑒𝑒𝑒𝑒𝑒 𝑖𝑖 𝑖𝑖 𝑝𝑝𝑝𝑝𝑝𝑝𝑝𝑝 𝑝𝑝𝑝𝑝 𝑡𝑡 Let the ratio, denoted as Xt, be categorized as Favourable (F) when 2 ˂ Xt ≤ 3, Marginal (M) when 4≤Xt <5, and Knockout (K) when Xt ≥ 5. Objectives To examine the socio-economic characteristics of the egg-producers To examine and predict the business states of egg production in Ibadan metropolis Results and Discussion Transition Matrix And Vector Of Initial Probabilities The vector of initial probabilities (P(0)) which is the starting probability of egg farmers being in any of these three business states at the beginning period is; P(0) = {0.0259, 0.6207, 0.3534}. This implies that, on the average, 2.6%, 62.1% and 35.3% of poultry egg farmers are currently in the favourable, marginal and knockout state respectively. = 4286.05714.00 3608.06083.00309.0 25.075.00 K M F P KMF Absolute (unconditional) and n-step transition (conditional) probabilities P(1) = {0.0192, 0.5989, 0.3819} This reveals that after a production year, the number of egg farmers would have reduced to 1.9% and 59.7% for favourable and marginal states respectively but increased to 38.2% for knockout state. Steady-state Probabilities The steady-state absolute probabilities of poultry egg farmers are computed as: 𝜋𝜋𝐽𝐽 = 0.0184, 0.5967, 0.3848 These probabilities stipulate that, in the long run, 1.84%, 59.67% and 38.48% of the poultry egg farmers will be in the favourable, marginal and knockout states respectively. Steady-state Probabilities The steady-state absolute probabilities of poultry egg farmers are computed as: 𝜋𝜋𝐽𝐽 = 0.0184, 0.5967, 0.3848 These probabilities stipulate that, in the long run, 1.84%, 59.67% and 38.48% of the poultry egg farmers will be in the favourable, marginal and knockout states respectively. Figure 1: Limiting state transition probabilities of table egg production Business States Of Table Egg Production Under Feed Cost Optimization P(0) = {0.2845, 0.6897, 0.0259}----Initial transition probabilities This implies that, on the average, 28.4% , 68.9% and 2.6%, of the poultry egg farmers are currently in the favourable, marginal, and knockout states respectively when linear programming technique was applied in the feed formulation. P(1) = {0.2776, 0.7011, 0.0213}----- After a production year This implies that after a year, on the average, 27.7% , 70.1% and 2.1%, of the poultry egg farmers would be in the favourable, marginal, and knockout states respectively under the feed cost optimisation. Mean Return Times of Ergodic Chains The expected number of transitions before the system returns to a state j for the first time. The mean first return times are computed as: 𝜇𝜇11 = 3.59 𝜇𝜇12 = 1.43 𝜇𝜇13 = 46.16 It will take approximately 4 years to return to a favourable state, 1 year to return to a marginal state, and 46 years to return to a knockout state under feed cost optimisation Table 1: Social Economic Characteristics of the Table Egg Producers Variables Frequency Percentage Age < 30 30-39 40-49 50-59 ≥ 60 Total Mean = 45.2; Std= 9.64 6 29 39 34 8 116 5.2 25.0 33.6 29.3 6.9 100.0 Gender Male Female Total 97 19 116 83.6 16.4 100.0 Educational status Primary Secondary Tertiary Total Mean=13; std =4.72 18 47 51 116 15.5 40.5 44.0 100.0 Year of poultry experience 1-3 4-6 7-9 ≥ 10 Total Mean=6.3; std=2.71 19 44 37 16 116 16.4 37.9 31.9 13.8 100.0 Housing system Deep litter Battery Cage Total 44 72 116 37.9 62.1 100 Initial stock type Day-old-chicks (DOC) Point-of-lay (POL) Total 83 33 116 71.6 28.4 100.0 Stock size < 1,000 1,000 - 4,999 ≥ 5,000 Total Mean=2,837; std=1,877.33 33 61 22 116 28.4 52.6 19.0 100.0 Mean Return Times of Ergodic Chains The expected number of transitions before the system returns to a state j for the first time. The mean first return times are computed as: 𝜇𝜇11 = 54.19 𝜇𝜇12 = 1.68 𝜇𝜇13 = 2.59 It will take approximately 54 years to return to a favourable state, 2 years to return to a marginal state, and 3 years to return to a knockout state. Steady-state Probabilities under Feed Cost Optimisation The steady-state absolute probabilities of poultry egg farmers are computed as: 𝜋𝜋𝐽𝐽 = 0.2778, 0.7005, 0.0217 These probabilities stipulate that, in the long run using feed optimisation technique, 27.8%, 70.1% and 2.2% of the poultry egg farmers would be in the favourable, marginal and knockout states respectively. Conclusion and Recommendation An average poultry egg farmer in this area stands a higher chance of remaining in unfavourable state or being forced out of the business due to high cost of feed. The bulk of the table egg producers are operating at the marginal state. However, an application of linear programming technique to feed cost reduced the chances of being in unfavourable business state(s). Hence, linear programming approach was recommended to reducing the proportion of egg producers in both marginal and knockout states. Figure 2: Limiting state transition probabilities of table egg production under feed cost optimization References Nmadu, J. N., Ogidan, I. O. and Omolehin, R. A. (2014). Profitability and Resource Use Efficiency of Poultry Egg Production in Abuja, Nigeria. Kasetsart J. (Social Sciences) 35:134 – 146. Jadhav, N. V., and Siddiqui, M. F. (2010). Handbook of poultry production and management. Second Edition. Jaypee Brothers Medical Publishers (P) Ltd., New Delhi, India. Pp. 1-4; 125- 145. Source: Field Survey, 2017