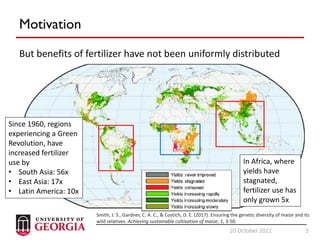
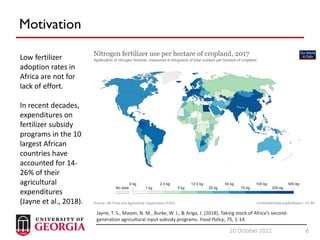
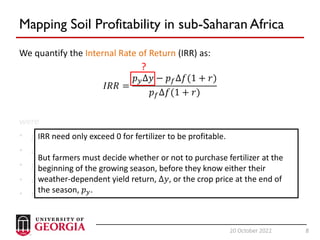
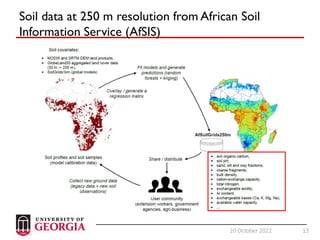
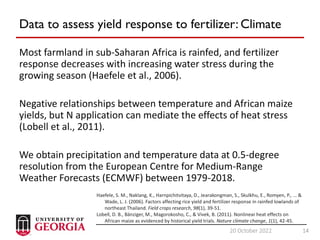
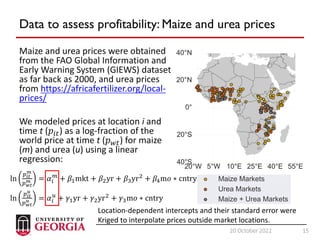
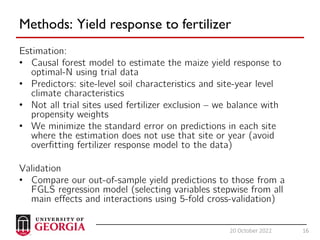
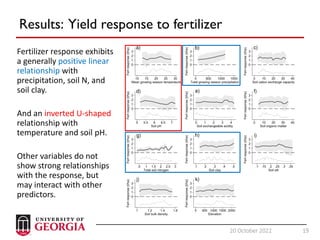
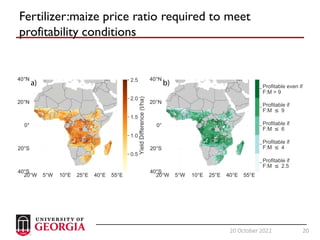
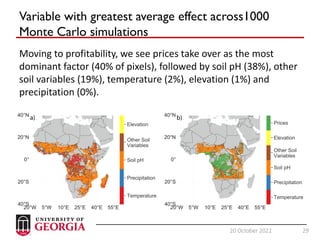
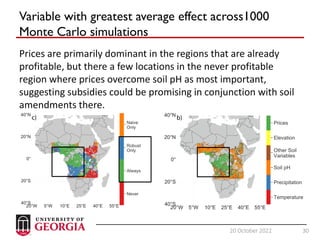
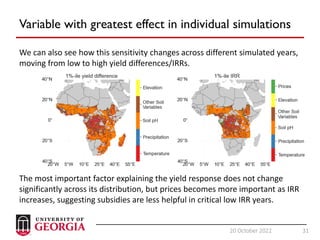
1
20 October 2022
Modeling climate smart soil fertility
investments in sub-Saharan Africa
Ellen McCullough
October 17, 2022
2
20 October 2022 2
This is a paper 8 years in the making!
I started grad school at Cornell in 2011. In 2012, I entered an NSF Integrated
Graduate Education and Research Traineeship (IGERT) on Food Systems and
Poverty Reduction.
In the summer of 2013, our cohort went to Ethiopia and spent two weeks
with the Ethiopian Agricultural Transformation Agency where we developed a
research proposal. 8 years later, we finally published our study!
Ellen McCullough, AEM Julianne Quinn, CEE Andrew Simons, AEM
3
20 October 2022 3
This is a paper 8 years in the making!
I started grad school at Cornell in 2011. In 2012, I entered an NSF Integrated
Graduate Education and Research Traineeship (IGERT) on Food Systems and
Poverty Reduction.
In the summer of 2013, our cohort went to Ethiopia and spent two weeks
with the Ethiopian Agricultural Transformation Agency where we developed a
research proposal. 8 years later, we finally published our study!
Ellen McCullough, UGA Julianne Quinn, UVA Andrew Simons, Fordham
4
20 October 2022 4
Motivation
The majority of people in developing countries live in rural areas,
and most of them depend on agriculture for their livelihoods
(IFAD, 2016).
Food security for these smallholder farmers was greatly
improved by the Green Revolution of the 1950s and 1960s.
Input intensification, of which fertilizer plays a key role, has
accounted for 60% of agricultural output increases since 1960 in
developing countries (Fuglie, 2018).
IFAD. (2016). Rural development report 2016: Fostering inclusive rural transformation.
Fuglie, K. O. (2018). Is agricultural productivity slowing?. Global food security, 17, 73-83.
5
20 October 2022 5
Motivation
But benefits of fertilizer have not been uniformly distributed
Since 1960, regions
experiencing a Green
Revolution, have
increased fertilizer
use by
• South Asia: 56x
• East Asia: 17x
• Latin America: 10x
In Africa, where
yields have
stagnated,
fertilizer use has
only grown 5x
Smith, J. S., Gardner, C. A. C., & Costich, D. E. (2017). Ensuring the genetic diversity of maize and its
wild relatives. Achieving sustainable cultivation of maize, 1, 3-50.
6
20 October 2022 6
Motivation
Low fertilizer
adoption rates in
Africa are not for
lack of effort.
In recent decades,
expenditures on
fertilizer subsidy
programs in the 10
largest African
countries have
accounted for 14-
26% of their
agricultural
expenditures
(Jayne et al., 2018).
Jayne, T. S., Mason, N. M., Burke, W. J., & Ariga, J. (2018). Taking stock of Africa’s second-
generation agricultural input subsidy programs. Food Policy, 75, 1-14.
7
20 October 2022 7
Research Questions and Hypotheses
Africa’s large scale trends raise questions:
• Why is fertilizer adoption so low in Africa?
• Could fertilizer subsidy programs be better targeted?
• Would other initiatives be more effective than subsidies?
Our hypothesis:
- Fertilizer adoption is low because using fertilizer is not profitable
We seek to:
1) understand variability of fertilizer use profitability from year to
year and location to location
2) Inform targeting that could improve profitability
8
20 October 2022 8
Mapping Soil Profitability in sub-Saharan Africa
We quantify the Internal Rate of Return (IRR) as:
𝐼𝑅𝑅 =
𝑝𝑦Δ𝑦 − 𝑝𝑓Δ𝑓(1 + 𝑟)
𝑝𝑓Δ𝑓(1 + 𝑟)
were
• 𝑝𝑦 is the price of crop 𝑦,
• Δ𝑦 is the change in yield of crop 𝑦 resulting from applying Δ𝑓, and
• 𝑝𝑓 is the price of fertilizer,
• Δ𝑓 is the amount of applied fertilizer,
• r is the interest rate
IRR need only exceed 0 for fertilizer to be profitable.
But farmers must decide whether or not to purchase fertilizer at the
beginning of the growing season, before they know either their
weather-dependent yield return, Δ𝑦, or the crop price at the end of
the season, 𝑝𝑦.
?
9
20 October 2022 9
Robust Profitability
Many studies assume farmers will adopt fertilizer if average IRR
is above a target T (say IRR>30%).
We instead assume farmers will adopt fertilizer if they can expect
an IRR > T at least p% of the time (say 70%).
To estimate this throughout Africa, we need to understand:
1) The yield response to fertilizer adoption as a function of soil
and weather conditions
2) Spatiotemporal soil, weather, and prices
10
20 October 2022 10
Data to assess yield response to fertilizer: Maize trials
Several field studies throughout
Africa between 1999-2007 and
2013-2016 have performed maize
production trials in which no N
management regime and an
optimal-N management regime
(120-125 kg/ha) were applied with
15-18 kg P/ha in both treatments.
We use these datasets to estimate
the maize yield return of applying
optimal-N fertilizer.
11
20 October 2022 11
Data to assess yield response to fertilizer: Soils
We expect the yield response to fertilizer to vary spatially and
temporally based on soil and weather conditions.
For example, soil organic carbon (SOC) influences soil structure
and retention of soil moisture and nutrients like N.
Marenya, P. P., & Barrett, C. B. (2009). State‐conditional fertilizer yield response on western
Kenyan farms. American Journal of Agricultural Economics, 91(4), 991-1006.
12
20 October 2022 12
Data to assess yield response to fertilizer: Soils
We expect the yield response to fertilizer to vary spatially and
temporally based on soil and weather conditions.
E.g., soil pH influences the ability of SOC and minerals to retain
nutrients, with fertilizer-mineral interactions typically weakened
as soils become more acidic (Sarkar and Wynjones, 1982).
In researcher-managed fertilizer trials in East Africa, fertilizer
response was higher in clayey soils than sandy soils (Tully et al.,
2016).
Sarkar, A. N., & Wynjones, R. G. (1982). Effect of rhizosphere pH on the availability
and uptake of Fe, Mn and Zn. Plant and Soil, 66(3), 361-372.
Tully, K. L., Hickman, J., McKenna, M., Neill, C., & Palm, C. A. (2016). Effects of
fertilizer on inorganic soil N in East Africa maize systems: vertical distributions and
temporal dynamics. Ecological Applications, 26(6), 1907-1919.
13
20 October 2022 13
Soil data at 250 m resolution from African Soil
Information Service (AfSIS)
14
20 October 2022 14
Data to assess yield response to fertilizer: Climate
Most farmland in sub-Saharan Africa is rainfed, and fertilizer
response decreases with increasing water stress during the
growing season (Haefele et al., 2006).
Negative relationships between temperature and African maize
yields, but N application can mediate the effects of heat stress
(Lobell et al., 2011).
We obtain precipitation and temperature data at 0.5-degree
resolution from the European Centre for Medium-Range
Weather Forecasts (ECMWF) between 1979-2018.
Haefele, S. M., Naklang, K., Harnpichitvitaya, D., Jearakongman, S., Skulkhu, E., Romyen, P., ... &
Wade, L. J. (2006). Factors affecting rice yield and fertilizer response in rainfed lowlands of
northeast Thailand. Field crops research, 98(1), 39-51.
Lobell, D. B., Bänziger, M., Magorokosho, C., & Vivek, B. (2011). Nonlinear heat effects on
African maize as evidenced by historical yield trials. Nature climate change, 1(1), 42-45.
15
20 October 2022 15
Data to assess profitability: Maize and urea prices
Maize and urea prices were obtained
from the FAO Global Information and
Early Warning System (GIEWS) dataset
as far back as 2000, and urea prices
from https://africafertilizer.org/local-
prices/
We modeled prices at location i and
time t (𝑝𝑖𝑡) as a log-fraction of the
world price at time t (𝑝𝑤𝑡) for maize
(m) and urea (u) using a linear
regression:
ln
𝑝𝑖𝑡
𝑚
𝑝𝑤𝑡
𝑚 = 𝛼𝑖
𝑚
+ 𝛽1mkt + 𝛽2yr + 𝛽3yr2
+ 𝛽4m𝑜 ∗ cntry
ln
𝑝𝑖𝑡
𝑢
𝑝𝑤𝑡
𝑢 = 𝛼𝑖
𝑢
+ 𝛾1yr + 𝛾2yr2
+ 𝛾3m𝑜 ∗ cntry
Location-dependent intercepts and their standard error were
Kriged to interpolate prices outside market locations.
16
20 October 2022 16
Estimation:
• Causal forest model to estimate the maize yield response to
optimal-N using trial data
• Predictors: site-level soil characteristics and site-year level
climate characteristics
• Not all trial sites used fertilizer exclusion – we balance with
propensity weights
• We minimize the standard error on predictions in each site
where the estimation does not use that site or year (avoid
overfitting fertilizer response model to the data)
Validation
• Compare our out-of-sample yield predictions to those from a
FGLS regression model (selecting variables stepwise from all
main effects and interactions using 5-fold cross-validation)
Methods: Yield response to fertilizer
17
20 October 2022 17
Results: Yield response to fertilizer
Causal Forest Random
Forest
FGLS
Ave predicted yield, F=0 (t/ha) 3.01 2.45
(0.07) (0.84)
Ave predicted yield, F=1 (t/ha) 4.27 4.51
(0.18) (0.70)
Predicted fertilizer response (t/ha) 1.49 1.26 2.07
(0.13) (0.12) (0.52)
RMSE 2.26 5.20
18
20 October 2022 18
Results: Yield response to fertilizer
Most important yield response
predictor: precipitation in the first
period of the growing season,
followed by % clay and soil pH.
19
20 October 2022 19
Results: Yield response to fertilizer
Fertilizer response exhibits
a generally positive linear
relationship with
precipitation, soil N, and
soil clay.
And an inverted U-shaped
relationship with
temperature and soil pH.
Other variables do not
show strong relationships
with the response, but
may interact with other
predictors.
20
20 October 2022 20
Fertilizer:maize price ratio required to meet
profitability conditions
21
20 October 2022 21
Profitability distribution estimation
We estimate the profitability distribution at each site using a
1000-yr Monte Carlo simulation.
Generate a synthetic climate dataset (lag-1 autocorrelation)
using historical data (1979-2018) and projecting linear trends.
Predict random errors in the yield response using standard error
of the out-of-sample casual forest prediction
Predict random errors in output prices from a normal
distribution with mean α and standard deviation s(α).
22
20 October 2022 22
Profitability findings
The average yield response to fertilizer exhibits great spatial
variation (a), and the profitability of that return exhibits
differential temporal variability across sites (b).
23
20 October 2022 23
Profitability findings
Using a definition for “robust profitability” of IRR>0.3 in at least
70% of simulations, 3 of 10 randomly selected maize trial sites
fail to meet this threshold (2510, 922, 1037).
24
20 October 2022 24
Profitability findings
How does this definition of being “robustly profitable”
(P 𝐼𝑅𝑅 > 0.3 > 0.7) compare with a “naïve” definition
assuming profitability simply if 𝔼 𝐼𝑅𝑅 > 0.3?
Using a naïve profitability definition based on mean yield
response to fertilizer classifies 12.5% of sites as profitable that
our robust definition does not and vice versa.
25
20 October 2022 25
Implications for targeting
We can use the previous map to target fertilizer promotion
efforts where they are robustly profitable.
But why is profitability low in so may places?
We perform a local, one-at-a-time sensitivity analysis perturbing
each site’s soil conditions and simulated weather and prices by
+5% and -5%.
For each pixel, we find which variable elicits the greatest
absolute change in yield response and IRR when it is perturbed.
26
20 October 2022 26
Variable with greatest average effect across1000
Monte Carlo simulations
The variable to which most pixels’ yield response is most sensitive is soil pH
(51%), followed by other soil characteristics (31%), temperature (14%),
precipitation (2%), and elevation (2%).
Precipitation is the most important predictor in the causal forest model, but
explains more spatial variability than local temporal variability. Soil pH can be
improved with interventions
27
20 October 2022 27
Variable with greatest average effect across1000
Monte Carlo simulations
The robustly profitable locations are most influenced by temperature
and other soil variables than pH.
The areas sensitive to temperature should be monitored, as their
robust profitability may change in the future as temperatures continue
to warm.
28
20 October 2022 28
Variable with greatest average effect across1000
Monte Carlo simulations
Locations that are never profitable are primarily sensitive to soil
pH, suggesting soil amendments such as liming could make
maize yields more responsive to fertilizer applications.
29
20 October 2022 29
Variable with greatest average effect across1000
Monte Carlo simulations
Moving to profitability, we see prices take over as the most
dominant factor (40% of pixels), followed by soil pH (38%), other
soil variables (19%), temperature (2%), elevation (1%) and
precipitation (0%).
30
20 October 2022 30
Variable with greatest average effect across1000
Monte Carlo simulations
Prices are primarily dominant in the regions that are already
profitable, but there a few locations in the never profitable
region where prices overcome soil pH as most important,
suggesting subsidies could be promising in conjunction with soil
amendments there.
31
20 October 2022 31
Variable with greatest effect in individual simulations
We can also see how this sensitivity changes across different simulated years,
moving from low to high yield differences/IRRs.
The most important factor explaining the yield response does not change
significantly across its distribution, but prices becomes more important as IRR
increases, suggesting subsidies are less helpful in critical low IRR years.
32
20 October 2022 32
Conclusions
It is important to understand uncertainty in yield response to fertilizer,
and what variables are controlling it, to inform economic and soil
health interventions.
Using a naïve profitability definition based on mean yield response to
fertilizer classifies 12.5% of sites as profitable that our robust definition
does not and vice versa.
Furthermore, we find price sensitivity is most prominent in areas that
are already profitable, limiting the potential for subsidies to improve
adoption.
But there could be great potential to improve adoption through
targeted soil amendments.

FertilizerProfitability - IFPRI Malawi (003).pdf

  • 1.
    1 20 October 2022 Modelingclimate smart soil fertility investments in sub-Saharan Africa Ellen McCullough October 17, 2022
  • 2.
    2 20 October 20222 This is a paper 8 years in the making! I started grad school at Cornell in 2011. In 2012, I entered an NSF Integrated Graduate Education and Research Traineeship (IGERT) on Food Systems and Poverty Reduction. In the summer of 2013, our cohort went to Ethiopia and spent two weeks with the Ethiopian Agricultural Transformation Agency where we developed a research proposal. 8 years later, we finally published our study! Ellen McCullough, AEM Julianne Quinn, CEE Andrew Simons, AEM
  • 3.
    3 20 October 20223 This is a paper 8 years in the making! I started grad school at Cornell in 2011. In 2012, I entered an NSF Integrated Graduate Education and Research Traineeship (IGERT) on Food Systems and Poverty Reduction. In the summer of 2013, our cohort went to Ethiopia and spent two weeks with the Ethiopian Agricultural Transformation Agency where we developed a research proposal. 8 years later, we finally published our study! Ellen McCullough, UGA Julianne Quinn, UVA Andrew Simons, Fordham
  • 4.
    4 20 October 20224 Motivation The majority of people in developing countries live in rural areas, and most of them depend on agriculture for their livelihoods (IFAD, 2016). Food security for these smallholder farmers was greatly improved by the Green Revolution of the 1950s and 1960s. Input intensification, of which fertilizer plays a key role, has accounted for 60% of agricultural output increases since 1960 in developing countries (Fuglie, 2018). IFAD. (2016). Rural development report 2016: Fostering inclusive rural transformation. Fuglie, K. O. (2018). Is agricultural productivity slowing?. Global food security, 17, 73-83.
  • 5.
    5 20 October 20225 Motivation But benefits of fertilizer have not been uniformly distributed Since 1960, regions experiencing a Green Revolution, have increased fertilizer use by • South Asia: 56x • East Asia: 17x • Latin America: 10x In Africa, where yields have stagnated, fertilizer use has only grown 5x Smith, J. S., Gardner, C. A. C., & Costich, D. E. (2017). Ensuring the genetic diversity of maize and its wild relatives. Achieving sustainable cultivation of maize, 1, 3-50.
  • 6.
    6 20 October 20226 Motivation Low fertilizer adoption rates in Africa are not for lack of effort. In recent decades, expenditures on fertilizer subsidy programs in the 10 largest African countries have accounted for 14- 26% of their agricultural expenditures (Jayne et al., 2018). Jayne, T. S., Mason, N. M., Burke, W. J., & Ariga, J. (2018). Taking stock of Africa’s second- generation agricultural input subsidy programs. Food Policy, 75, 1-14.
  • 7.
    7 20 October 20227 Research Questions and Hypotheses Africa’s large scale trends raise questions: • Why is fertilizer adoption so low in Africa? • Could fertilizer subsidy programs be better targeted? • Would other initiatives be more effective than subsidies? Our hypothesis: - Fertilizer adoption is low because using fertilizer is not profitable We seek to: 1) understand variability of fertilizer use profitability from year to year and location to location 2) Inform targeting that could improve profitability
  • 8.
    8 20 October 20228 Mapping Soil Profitability in sub-Saharan Africa We quantify the Internal Rate of Return (IRR) as: 𝐼𝑅𝑅 = 𝑝𝑦Δ𝑦 − 𝑝𝑓Δ𝑓(1 + 𝑟) 𝑝𝑓Δ𝑓(1 + 𝑟) were • 𝑝𝑦 is the price of crop 𝑦, • Δ𝑦 is the change in yield of crop 𝑦 resulting from applying Δ𝑓, and • 𝑝𝑓 is the price of fertilizer, • Δ𝑓 is the amount of applied fertilizer, • r is the interest rate IRR need only exceed 0 for fertilizer to be profitable. But farmers must decide whether or not to purchase fertilizer at the beginning of the growing season, before they know either their weather-dependent yield return, Δ𝑦, or the crop price at the end of the season, 𝑝𝑦. ?
  • 9.
    9 20 October 20229 Robust Profitability Many studies assume farmers will adopt fertilizer if average IRR is above a target T (say IRR>30%). We instead assume farmers will adopt fertilizer if they can expect an IRR > T at least p% of the time (say 70%). To estimate this throughout Africa, we need to understand: 1) The yield response to fertilizer adoption as a function of soil and weather conditions 2) Spatiotemporal soil, weather, and prices
  • 10.
    10 20 October 202210 Data to assess yield response to fertilizer: Maize trials Several field studies throughout Africa between 1999-2007 and 2013-2016 have performed maize production trials in which no N management regime and an optimal-N management regime (120-125 kg/ha) were applied with 15-18 kg P/ha in both treatments. We use these datasets to estimate the maize yield return of applying optimal-N fertilizer.
  • 11.
    11 20 October 202211 Data to assess yield response to fertilizer: Soils We expect the yield response to fertilizer to vary spatially and temporally based on soil and weather conditions. For example, soil organic carbon (SOC) influences soil structure and retention of soil moisture and nutrients like N. Marenya, P. P., & Barrett, C. B. (2009). State‐conditional fertilizer yield response on western Kenyan farms. American Journal of Agricultural Economics, 91(4), 991-1006.
  • 12.
    12 20 October 202212 Data to assess yield response to fertilizer: Soils We expect the yield response to fertilizer to vary spatially and temporally based on soil and weather conditions. E.g., soil pH influences the ability of SOC and minerals to retain nutrients, with fertilizer-mineral interactions typically weakened as soils become more acidic (Sarkar and Wynjones, 1982). In researcher-managed fertilizer trials in East Africa, fertilizer response was higher in clayey soils than sandy soils (Tully et al., 2016). Sarkar, A. N., & Wynjones, R. G. (1982). Effect of rhizosphere pH on the availability and uptake of Fe, Mn and Zn. Plant and Soil, 66(3), 361-372. Tully, K. L., Hickman, J., McKenna, M., Neill, C., & Palm, C. A. (2016). Effects of fertilizer on inorganic soil N in East Africa maize systems: vertical distributions and temporal dynamics. Ecological Applications, 26(6), 1907-1919.
  • 13.
    13 20 October 202213 Soil data at 250 m resolution from African Soil Information Service (AfSIS)
  • 14.
    14 20 October 202214 Data to assess yield response to fertilizer: Climate Most farmland in sub-Saharan Africa is rainfed, and fertilizer response decreases with increasing water stress during the growing season (Haefele et al., 2006). Negative relationships between temperature and African maize yields, but N application can mediate the effects of heat stress (Lobell et al., 2011). We obtain precipitation and temperature data at 0.5-degree resolution from the European Centre for Medium-Range Weather Forecasts (ECMWF) between 1979-2018. Haefele, S. M., Naklang, K., Harnpichitvitaya, D., Jearakongman, S., Skulkhu, E., Romyen, P., ... & Wade, L. J. (2006). Factors affecting rice yield and fertilizer response in rainfed lowlands of northeast Thailand. Field crops research, 98(1), 39-51. Lobell, D. B., Bänziger, M., Magorokosho, C., & Vivek, B. (2011). Nonlinear heat effects on African maize as evidenced by historical yield trials. Nature climate change, 1(1), 42-45.
  • 15.
    15 20 October 202215 Data to assess profitability: Maize and urea prices Maize and urea prices were obtained from the FAO Global Information and Early Warning System (GIEWS) dataset as far back as 2000, and urea prices from https://africafertilizer.org/local- prices/ We modeled prices at location i and time t (𝑝𝑖𝑡) as a log-fraction of the world price at time t (𝑝𝑤𝑡) for maize (m) and urea (u) using a linear regression: ln 𝑝𝑖𝑡 𝑚 𝑝𝑤𝑡 𝑚 = 𝛼𝑖 𝑚 + 𝛽1mkt + 𝛽2yr + 𝛽3yr2 + 𝛽4m𝑜 ∗ cntry ln 𝑝𝑖𝑡 𝑢 𝑝𝑤𝑡 𝑢 = 𝛼𝑖 𝑢 + 𝛾1yr + 𝛾2yr2 + 𝛾3m𝑜 ∗ cntry Location-dependent intercepts and their standard error were Kriged to interpolate prices outside market locations.
  • 16.
    16 20 October 202216 Estimation: • Causal forest model to estimate the maize yield response to optimal-N using trial data • Predictors: site-level soil characteristics and site-year level climate characteristics • Not all trial sites used fertilizer exclusion – we balance with propensity weights • We minimize the standard error on predictions in each site where the estimation does not use that site or year (avoid overfitting fertilizer response model to the data) Validation • Compare our out-of-sample yield predictions to those from a FGLS regression model (selecting variables stepwise from all main effects and interactions using 5-fold cross-validation) Methods: Yield response to fertilizer
  • 17.
    17 20 October 202217 Results: Yield response to fertilizer Causal Forest Random Forest FGLS Ave predicted yield, F=0 (t/ha) 3.01 2.45 (0.07) (0.84) Ave predicted yield, F=1 (t/ha) 4.27 4.51 (0.18) (0.70) Predicted fertilizer response (t/ha) 1.49 1.26 2.07 (0.13) (0.12) (0.52) RMSE 2.26 5.20
  • 18.
    18 20 October 202218 Results: Yield response to fertilizer Most important yield response predictor: precipitation in the first period of the growing season, followed by % clay and soil pH.
  • 19.
    19 20 October 202219 Results: Yield response to fertilizer Fertilizer response exhibits a generally positive linear relationship with precipitation, soil N, and soil clay. And an inverted U-shaped relationship with temperature and soil pH. Other variables do not show strong relationships with the response, but may interact with other predictors.
  • 20.
    20 20 October 202220 Fertilizer:maize price ratio required to meet profitability conditions
  • 21.
    21 20 October 202221 Profitability distribution estimation We estimate the profitability distribution at each site using a 1000-yr Monte Carlo simulation. Generate a synthetic climate dataset (lag-1 autocorrelation) using historical data (1979-2018) and projecting linear trends. Predict random errors in the yield response using standard error of the out-of-sample casual forest prediction Predict random errors in output prices from a normal distribution with mean α and standard deviation s(α).
  • 22.
    22 20 October 202222 Profitability findings The average yield response to fertilizer exhibits great spatial variation (a), and the profitability of that return exhibits differential temporal variability across sites (b).
  • 23.
    23 20 October 202223 Profitability findings Using a definition for “robust profitability” of IRR>0.3 in at least 70% of simulations, 3 of 10 randomly selected maize trial sites fail to meet this threshold (2510, 922, 1037).
  • 24.
    24 20 October 202224 Profitability findings How does this definition of being “robustly profitable” (P 𝐼𝑅𝑅 > 0.3 > 0.7) compare with a “naïve” definition assuming profitability simply if 𝔼 𝐼𝑅𝑅 > 0.3? Using a naïve profitability definition based on mean yield response to fertilizer classifies 12.5% of sites as profitable that our robust definition does not and vice versa.
  • 25.
    25 20 October 202225 Implications for targeting We can use the previous map to target fertilizer promotion efforts where they are robustly profitable. But why is profitability low in so may places? We perform a local, one-at-a-time sensitivity analysis perturbing each site’s soil conditions and simulated weather and prices by +5% and -5%. For each pixel, we find which variable elicits the greatest absolute change in yield response and IRR when it is perturbed.
  • 26.
    26 20 October 202226 Variable with greatest average effect across1000 Monte Carlo simulations The variable to which most pixels’ yield response is most sensitive is soil pH (51%), followed by other soil characteristics (31%), temperature (14%), precipitation (2%), and elevation (2%). Precipitation is the most important predictor in the causal forest model, but explains more spatial variability than local temporal variability. Soil pH can be improved with interventions
  • 27.
    27 20 October 202227 Variable with greatest average effect across1000 Monte Carlo simulations The robustly profitable locations are most influenced by temperature and other soil variables than pH. The areas sensitive to temperature should be monitored, as their robust profitability may change in the future as temperatures continue to warm.
  • 28.
    28 20 October 202228 Variable with greatest average effect across1000 Monte Carlo simulations Locations that are never profitable are primarily sensitive to soil pH, suggesting soil amendments such as liming could make maize yields more responsive to fertilizer applications.
  • 29.
    29 20 October 202229 Variable with greatest average effect across1000 Monte Carlo simulations Moving to profitability, we see prices take over as the most dominant factor (40% of pixels), followed by soil pH (38%), other soil variables (19%), temperature (2%), elevation (1%) and precipitation (0%).
  • 30.
    30 20 October 202230 Variable with greatest average effect across1000 Monte Carlo simulations Prices are primarily dominant in the regions that are already profitable, but there a few locations in the never profitable region where prices overcome soil pH as most important, suggesting subsidies could be promising in conjunction with soil amendments there.
  • 31.
    31 20 October 202231 Variable with greatest effect in individual simulations We can also see how this sensitivity changes across different simulated years, moving from low to high yield differences/IRRs. The most important factor explaining the yield response does not change significantly across its distribution, but prices becomes more important as IRR increases, suggesting subsidies are less helpful in critical low IRR years.
  • 32.
    32 20 October 202232 Conclusions It is important to understand uncertainty in yield response to fertilizer, and what variables are controlling it, to inform economic and soil health interventions. Using a naïve profitability definition based on mean yield response to fertilizer classifies 12.5% of sites as profitable that our robust definition does not and vice versa. Furthermore, we find price sensitivity is most prominent in areas that are already profitable, limiting the potential for subsidies to improve adoption. But there could be great potential to improve adoption through targeted soil amendments.