1. TUNUGUNTLA HEMANTH KOM05 - FIN309
11703707
Abstract:
It is to analyse the performance of equity stocks and keep a track on the performance of the
stocks for a time period in the investment portfolio and track the results and performance. A
sum of amount to be invested in different sectors and based on the returns whether it is low or
high by analysing the market and get the deeper understanding on what basis the prices goes
up or fall down on what conditions and have greater view on the market as a study.
Introduction:
Investment is defined as a financial business that returns the income in the future. With an
exception of low income to high income depends on many factors which is known as
investment risk. As it based on the savings that create an income in the form of financial assets.
Main Objective:
1)To study about the risks and returns.
2)To study on the selected companies after analysing would provide a good returns to the
investor.
3)To analyse about the market and portfolio
Construction of my portfolio in Banking and FMCG Sector is based on my analysis on the
market and I have a good idea as I have been holding it from more than a year and IT Sector
companies are selected on NSE listings.
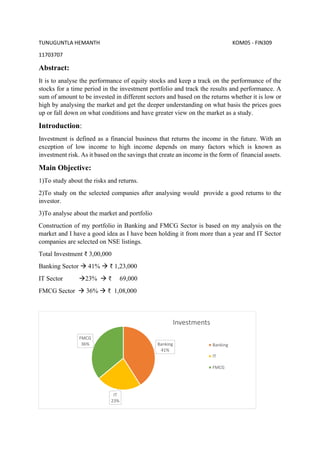
Total Investment ₹ 3,00,000
Banking Sector → 41% → ₹ 1,23,000
IT Sector →23% → ₹ 69,000
FMCG Sector → 36% → ₹ 1,08,000
Banking
41%
IT
23%
FMCG
36%
Investments
Banking
IT
FMCG
2. Banking Sector:
Union Bank Of India.
ICICI Bank Ltd.
Kotak Mahindra Bank Ltd.
IT Sector
Bharat Heavy Electricals Ltd.
Tech Mahindra Ltd.
FMCG Sector
Godrej Consumer Products Ltd.
Jubilant Food Works Ltd.
Godfrey Phillips India Ltd.
ITC Ltd.
Banking Sector
Union Bank of India 19% ₹ 24,900
ICICI Bank 61% ₹ 74,347
Kotak Mahindra Bank 20% ₹ 24,035
Daily Reports for Banking Sector Stocks:
Particulars Date Banking Sector
1,23,000
24,900 74,347 24,035 P/L for Day
Union Bank ICICI Bank Kotak Mahindra
Sep-24
No. of shares 1000 215 19
Total Investment 24,900 74,347 24,035
Average cost 24.9 345.8 1265
Closing price 24.95 337.85 1241
No. of shares 1000 215 19
Closing Investment 24,950 72,637.75 23,579
P & L 950 -1,709.25 -456 -1,215.25
Sep-25
Opening price 24.85 339.6 1255.15
No. of shares held 1000 215 19
Total Investment 24,850 73014 23847.85
Closing price 24.3 347.5 1250.15
No. of shares 1000 215 19
Closing Investment 24,300 74712.5 23752.85
P & L -550 1698 -95 1053
Total Investment: ₹ 1,23,000
3. Sep-26 Holiday Holiday Holiday
Sep-27 Holiday Holiday Holiday
Opening price Sep-28 24.5 351.45 1258.85
No. of shares held 1000 215 19
Total Investment 24500 75561.75 23918.15
Closing price 24.9 363.05 1282
No. of shares 1000 215 19
Closing Investment 24900 78055.75 24358
P & L 500 2494 439.85 3433.85
Sep-29
Opening price 25 362.7 1286.8
No. of shares held 1000 215 19
Total Investment 25000 77980.5 24449.2
Closing price 24.75 358.4 1265
No. of shares 1000 215 19
Closing Investment 24750 77056 24,035
P & L -250 -924 -414.2 -1588.2
Sep-30
Opening price 24.7 356.95 1265.8
No. of shares held 1000 215 19
Total Investment 24700 76744.25 24050.2
Closing price 24.4 353.5 1266.7
No. of shares 1000 215 19
Closing Investment 24400 76002.5 24067.3
P & L -300 -741.75 17.1 -1024.65
Oct-01
Opening price 24.5 358.45 1280
No. of shares held 1000 215 19
Total Investment 24500 77066.75 24320
Closing price 24.35 368.4 1306
No. of shares 1000 215 19
Closing Investment 24350 79206 24814
P & L -150 2139.25 494 2483.25
Oct-02 Holiday Holiday Holiday
Oct-03 Holiday Holiday Holiday
Total P/L for
Banking Sector 3142
4. BHEL ₹ 32,745 & Tech Mahindra ₹ 36,202
Daily Report for IT Sector:
Particulars Date IT Sector
69,000
32,745 36,202 P/L for Day
BHEL
Tech
Mahindra
Sep-24
No. of shares 1060 46
Total Investment 32,745 36,202
Average cost 30.9 787
Closing price 29.9 753
No. of shares 1060 46
Closing Investment 31694 34638
P & L -1,051 -1,564 -2,615
Sep-25
Opening price 30.2 755.05
No. of shares held 1060 46
Total Investment 32012 34732.3
Closing price 30.35 774.45
No. of shares 1060 46
Closing Investment 32171 35624.7
P & L 159 892.4 1051.4
Sep-26 Holiday Holiday
Sep-27 Holiday Holiday
Opening price Sep-28 30.8 775.3
No. of shares held 1060 46
Total Investment 32648 35663.8
Closing price 31.85 778
No. of shares 1060 46
Closing Investment 33761 35788
BHEL
48%
Tech Mahindra
52%
IT Sector
BHEL
Tech Mahindra
5. P & L 1113 124.2 1237.2
Sep-29
Opening price 32.25 783.9
No. of shares held 1060 46
Total Investment 34185 36059.4
Closing price 30.25 764.85
No. of shares 1060 46
Closing Investment 32065 35183.1
P & L -2120 -876.3 -2996.3
Sep-30
Opening price 30.4 771.8
No. of shares held 1060 46
Total Investment 32224 35502.8
Closing price 29.4 789.55
No. of shares 1060 46
Closing Investment 31164 36319.3
P & L -1060 816.5 -243.5
Oct-01
Opening price 29.7 798.45
No. of shares held 1060 46
Total Investment 31482 36728.7
Closing price 29.65 821.85
No. of shares 1060 46
Closing Investment 31429 37805.1
P & L -53 1076.4 1023.4
Oct-02 Holiday Holiday
Oct-03 Holiday Holiday
Total P/L for IT Sector -2,542.8
Godrej
34%
Jubliant
42%
Phillips
17%
ITC
7% FMCG SECTOR
Godrej
Jubliant
Phillips
ITC
6. Daily Report for FMCG Sector:
Particulars Date FMCG
1,08,000 P/L for Day
36,973 46,003 17,940 7,207
Godrej Jubilant Phillips ITC
Sep-24
No. of shares 55 20 20 42
Total Investment 36,973 46,003 17,940 7,207
Average cost 672.25 2300.15 897 171.6
Closing price 690.85 2268 916.25 167.4
No. of shares 55 20 20 42
Closing
Investment 37996.75 45360 18325 7030.8
P & L 1,024 -643 385 -176 590
Sep-25
Opening price 701.15 2293.25 923 168.45
No. of shares held 55 20 20 42
Total Investment 38563.25 45865 18460 7074.9
Closing price 699.5 2318.3 923 171.15
No. of shares 55 20 20 42
Closing
Investment 38472.5 46366 18460 7188.3
P & L -90.75 501 0 113.4 523.65
Sep-26 Holiday Holiday Holiday Holiday
Sep-27 Holiday Holiday Holiday Holiday
Opening price Sep-28 705 2336 920.1 171
No. of shares held 55 20 20 42
Total Investment 38775 46720 18402 7182
Closing price 713.5 2422.05 928 173.65
No. of shares 55 20 20 42
Closing
Investment 39242.5 48441 18560 7293.3
P & L 467.5 1721 158 111.3 2457.8
Sep-29
Opening price 716.7 2440 926 174.45
No. of shares held 55 20 20 42
Total Investment 39418.5 48800 18520 7326.9
Closing price 705.95 2375.95 916 169.5
No. of shares 55 20 20 42
Closing
Investment 38827.25 47519 18320 7119
P & L -591.25 -1281 -200 -207.9 -2280.15
Sep-30
Opening price 706.15 2370 919 170.1
No. of shares held 55 20 20 42
Total Investment 38838.25 47400 18380 7144.2
7. Closing price 724.15 2347 920.05 171.95
No. of shares 55 20 20 42
Closing
Investment 39828.25 46940 18401 7221.9
P & L 990 -460 21 77.7 628.7
Oct-01
Opening price 728.5 2375.55 927.9 174.15
No. of shares held 55 20 20 42
Total Investment 40067.5 47511 18558 7314.3
Closing price 735.5 2370.45 918.95 170.9
No. of shares 55 20 20 42
Closing
Investment 40452.5 47409 18379 7177.8
P & L 385 -102 -179 -136.5 -32.5
Oct-02 Holiday Holiday Holiday Holiday
Oct-03 Holiday Holiday Holiday Holiday
Total P/L for
FMCG Sector 1,887
Total money Invested on 24 Sept-2020 = ₹3,00,352
Total money as on 2nd
Oct-2020 = ₹3,02,839
Total Profit = ₹ 2,487
**Daily Report are noted at 9:15 AM as opening price & closing price at 15:29 PM. Based on the
opening and closing value of the stock then profit/loss for that particular day is calculated. All the
stocks are Equity type. As these are risky type and the price that fluctuate regularly on the market so
the investors can experience great profit or losses based on large movement of stocks. Equity stocks
are good for long term processing and there is a much possibility chances that there will be a gain in
the principal amount invested and it also provides tax benefits.
Fundamental Analysis:
Union Bank: As it is currently undervalued, I think it might be a good time for the investor
to increase the share price.
8. ICICI Bank: It appears to be expensive but having Price to Earning ratio the future seems to
be bright for ICICI. And the main thing is the price is stable as compared with the rest of the
market.
Kotak Mahindra: As this bank is extremely well capitalised and had a brilliant performance
in Q-4 of 2019 and its performance in controlling its NPA’s
BHEL: As it has a fair value and the most advantageous thing is that the government ruled
out that it won’t be privatised, and I think there will be a good increase in next upcoming
years.
9. Tech Mahindra: As it provides a good dividend on time this year ₹5.00 per share and last
year ₹15.00 per share but due to pandemic it has has affected but it would recover in the next
couple of years.
Godrej: As it has a good consumer in demand, and it is likely to pick up in Q1 of 2021. And
it one of the largest companies with good consumer demand.
ITC: Having a good revenue and with 16% profit in Q3 of 2020 even during pandemic and
launces brands that attracts the consumers and also one of the largest private sectors in India.
10. Phillips: It is having a high Price-to-Earning ratio which means the investor has to pay higher
price. From this I predict that what the company wants to achieve in future.
Jubilant Foods: Its price have increased 81% in the previous one year with Dominos having
the high potential and is expected to have more in the coming future.
Bull Market: In a Stock Market where the prices are expected to rise. It is a good sign that
economy is doing well or coming out from the previous mishap and depending on the
surroundings around.
Bear Market: It is opposite to that of Bull Market where the prices are expected to fall and
the investors are trying to sell out their shares instead of having a loss and happens on any
bad economic news or any others issues and that leads investors get panic and sell out and
that causes price dropout.
11. As per my Analysis on the stocks that I have invested and keep a track on them in that last 10
days the performance of the companies is:
Union Bank of India stocks were Moderately Bullish
Kotak Mahindra Bank stocks were Moderately Bullish
Tech Mahindra stocks were Moderately Bullish
BHEL stocks were Moderately Bullish
Jubilant Foods stocks were Moderately Bullish
ITC stocks were Moderately Bullish
Phillips stocks were Moderately Bearish
Godrej stocks were Moderately Bearish
ICICI Bank stocks were Moderately Bearish
Conclusion:
Based on the above statistics 6 out of 9 companies were Bullish which means having a good
profit and as observed 24th
Sept market was low and there was a loss and then market
regained back 25th
& 28th
was showing a good profit for the investors & on 29th
there was a
loss and there was much fluctuation observed on 30th
of September as Q3 ending and the
same fluctuation on 01st
Oct . Then market was closed on 2nd
and 3Rd
of October. As on the
market day growth there was a profit of almost 6,000 for 3,00,000 investment that proper
fundamental and technical analysis is required to have a good profit.
For any investment the main factors that are to be considered are risk and returns. So
diversify of portfolio is very much important as it helps in reducing the risk factor.
--------------------------------------------------------------------------------------------------------------------------------------
Hemanth Tunuguntla
11703707